

Quick Answer
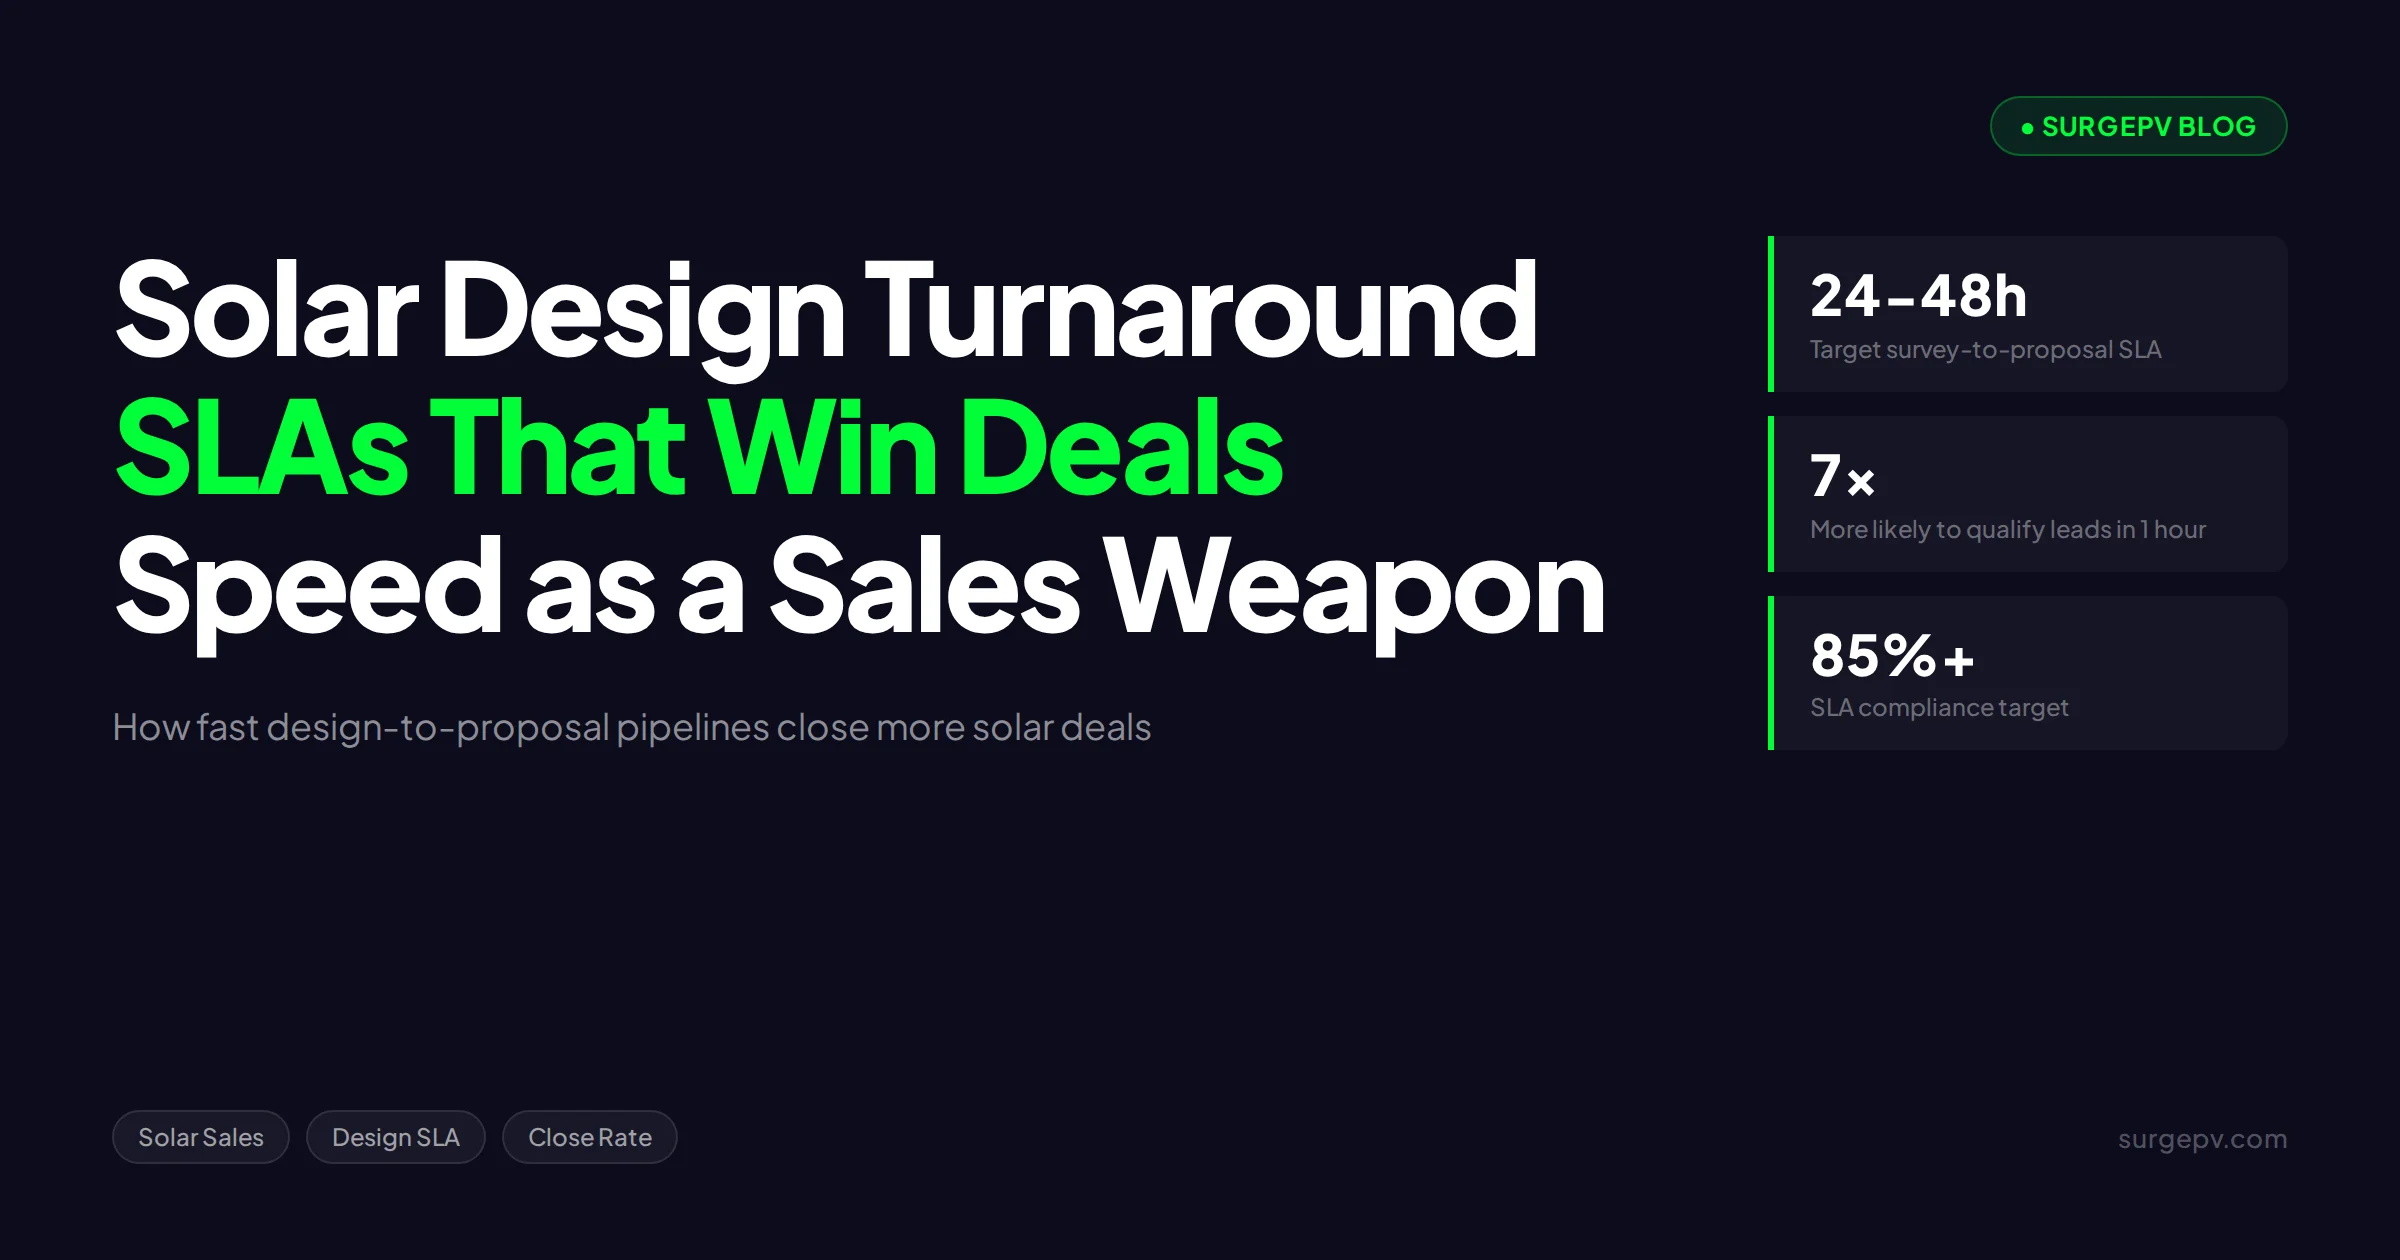
Solar design turnaround time is the elapsed time from site survey to a delivered proposal. Top installers hit 24-48 hours end to end: survey-to-design in under 24 hours and design-to-proposal in under 8. Fast turnaround wins because buyers sign with the first credible quote, and speed signals operational competence.
A homeowner signs a solar contract on Tuesday evening. The winning installer surveyed the roof on Friday, delivered a full proposal on Saturday morning, and presented it live on Monday. Two competitors sent their quotes the following Friday. Their designs were fine. Their prices were lower. Neither mattered, because the deal was already closed. We see this pattern repeat across the 400+ installations our team has worked on: the fastest credible quote wins far more often than the best quote.
Solar design turnaround time is the least tracked, highest-impact number in most installer businesses. Owners obsess over cost per lead and close rate. Few measure the hours between “survey complete” and “proposal delivered.” That gap is where deals quietly die. Buyers interpret a slow proposal as a preview of a slow installation, and they are usually right.
This guide breaks down how to set, staff, and enforce internal service-level agreements (SLAs) for your design pipeline. An SLA here means a hard internal deadline with an owner and a measurement, not a vague aspiration. You will get specific targets for survey-to-design and design-to-proposal, a workflow that hits 24-48 hours end to end, and the tooling decisions that make the numbers repeatable.
Quick Answer
Solar design turnaround time is the elapsed time from site survey to a delivered proposal. Top installers hit 24-48 hours end to end: survey-to-design in under 24 hours and design-to-proposal in under 8. Fast turnaround wins because buyers sign with the first credible quote, and speed signals operational competence.
In this guide:
- Why turnaround time decides who wins the deal
- The real cost of a slow design queue
- The 2 SLAs every installer should set, with specific hour targets
- A step-by-step 24-48 hour survey-to-proposal workflow
- What to automate and what to keep human
- Why the “speed kills quality” argument is wrong
- The KPIs and review cadence that keep SLAs alive
Why Turnaround Time Decides Who Wins the Deal
Solar design turnaround time decides deal outcomes because buyers commit while intent is hot. The first credible proposal anchors the buyer’s price expectations, frames every later quote as a comparison, and captures the customer before momentum fades. Speed at the proposal stage compounds the advantage you built with fast lead response.
The lead-response research is blunt on this. Companies that contact prospects within 1 hour are nearly 7 times more likely to qualify the lead than those that wait even 1 hour longer, according to Harvard Business Review, 2011. We covered the front end of this in our speed-to-lead guide for solar sales. The same decay curve applies after the survey, and almost nobody measures it.
Homeowners rarely buy from the only quote they receive. They collect 2-3 proposals, and the first one becomes the reference point. Every later quote gets judged against your layout, your savings chart, and your price per watt. Arriving first means competitors have to beat your numbers on paper. Arriving third means you are negotiating against a deal that is already half-closed.
Competition makes this worse every year. The US installed a record volume of new solar capacity in 2024, roughly 50 GWdc, according to the SEIA and Wood Mackenzie Solar Market Insight report, 2025. More capacity means more installers fighting for the same roofs, and shoppers who comparison-quote pay meaningfully less than those who accept the first offer, according to EnergySage marketplace data, 2024. Buyers are trained to collect quotes. Your only durable edge is being first and credible.
Commercial buyers behave the same way, on a longer clock. A facilities manager evaluating 3 EPC bids for a 500 kW rooftop still anchors on the first complete proposal. The difference is that “fast” in commercial means 1-2 weeks, not 48 hours. The installers who systematize turnaround win in both segments, as the data in our solar proposal win-rate benchmarks post shows.
The Real Cost of a Slow Design Queue
A slow design queue costs you in 3 places: lost close rate, wasted survey spend, and designer capacity burned on rework. Industry-observed close rates fall by a third or more once a proposal arrives more than 5-7 days after the survey. Every stalled job also holds a survey slot, a truck roll, and a sales rep’s follow-up time hostage.
Start with the close rate. Our solar close rate analysis covers the benchmarks in detail, but the pattern is consistent: quotes delivered within 48 hours of survey close at materially higher rates than quotes delivered after a week. The buyer’s urgency decays, a spouse gets cold feet, or a competitor presents first. You rarely find out which one killed the deal.
Then there is the money already spent. A residential site survey costs $75-$250 in labor and vehicle time (industry-observed range). Marketing already paid to generate that lead. Sales already paid to run the appointment. When the design sits in a queue for 6 days and the deal dies, all 3 costs write down to zero. Sales reps already spend just 28% of their week actually selling, according to the Salesforce State of Sales report, 2024. Slow proposals force them to spend even more of that scarce selling time resurrecting cold deals.
Soft costs tell the same story at market level. Non-hardware costs such as customer acquisition, permitting, and labor account for roughly 65% of US residential system prices, according to NREL, 2023. Turnaround time sits inside customer acquisition cost. Every day of queue delay inflates the most expensive line item on your P&L.
The third cost is rework. A designer who picks up a survey 6 days later re-reads notes, re-opens photos, and re-asks the surveyor questions. We have timed this on real projects: a stale design file carries 20-40 minutes of ramp-up that a fresh file does not (our internal observation across field teams, not a published figure). Multiply that by 15 jobs a week and slow queues quietly consume a full designer-day.
Pro Tip
Pull your last 50 closed-won and 50 closed-lost deals. Timestamp survey completion and proposal delivery for each. Most installers who run this exercise find their won deals averaged under 72 hours and their lost deals averaged over a week.
Setting Internal SLAs: Survey to Design, Design to Proposal
Set 2 SLAs and no more: survey-to-design in 24 hours, and design-to-proposal in 8 working hours. Two numbers are easy to remember, easy to assign an owner to, and easy to dashboard. More SLAs than that and your team stops treating any of them as real.
The survey-to-design SLA starts when survey data hits your system, not when the survey happens. It ends when a complete design exists: 3D roof model, module layout, string sizing, shading simulation, and production estimate. The design-to-proposal SLA starts when design is complete and ends when the customer receives the proposal. Split the clock this way because the 2 stages have different owners and different failure modes.
| SLA | Clock starts | Clock stops | Target | Stretch target |
|---|---|---|---|---|
| Survey-to-design (residential) | Survey data received | Design + simulation complete | 24 h | 8 h |
| Design-to-proposal (residential) | Design complete | Proposal in customer’s inbox | 8 working h | 2 h |
| Survey-to-design (C&I, 100-500 kW) | Survey data received | Design + financial model complete | 48 h | 24 h |
| Design-to-proposal (C&I) | Design complete | Proposal delivered | 24 h | 8 h |
Assign a single owner to each SLA. The design lead owns survey-to-design. The sales rep owns design-to-proposal. Shared ownership means no ownership.
What about the clock before the survey? Keep it out of these 2 SLAs. Lead-to-appointment speed is a separate metric with a separate owner. Mixing the front-end clock into the design SLA muddies accountability. The design team cannot control how fast sales books the survey, so do not hold them to it.
Handle breaches the same day. Any job that misses its SLA gets reviewed in the next morning’s standup: what blocked it, who unblocks it, what the new commit time is. Silence after a breach teaches the team the SLA is decorative. Our solar survey-to-proposal workflow guide covers the handoff mechanics between these 2 stages in more detail.
Building a 24-48 Hour Design-to-Proposal Workflow
A 24-48 hour workflow works by removing wait states, not by making designers type faster. The design itself takes 30-90 minutes on a modern cloud tool. Everything else is queue time, missing data, and approval loops. Attack the gaps and the SLA holds.
Here is the sequence we recommend for residential jobs:
- Survey day, same evening (hour 0-4): The surveyor uploads photos, measurements, and electrical panel details from the field using a standardized checklist. No paper forms, no “I’ll upload it tomorrow.”
- Next morning (hour 4-12): The designer builds the 3D roof model and module layout in the PV design software. Obstructions from survey photos go straight into the model.
- Same session (hour 12-16): Run the shading simulation and production estimate. With physics-based solar shadow analysis software, this runs in the same workspace as the layout, so there is no export-import round trip.
- Same afternoon (hour 16-20): The sales rep pulls the design into the proposal template, confirms pricing and financing, and generates the customer-ready PDF with solar proposal software.
- Hour 20-24: The rep presents the proposal live, on a call or in person. Live presentation lets you adjust layout or pricing in the room, which is where same-day revisions pay for themselves.
The discipline that makes this work is the survey checklist. Most SLA breaches trace back to missing data: no panel photo, no roof measurement, an unreadable utility meter. A mandatory checklist with photo requirements kills 80% of design-stage stalls (industry-observed figure). Standardize the inputs and the pipeline speeds up on its own.
For commercial jobs, stretch each stage by a factor of 2 and add a load-profile review step. The workflow shape stays the same.
One failure mode deserves its own warning: the “approval queue.” Some companies route every proposal past an owner or sales manager before it goes out. A 24-hour design pipeline feeding a 3-day approval inbox is a 3-day pipeline. Fix it with guardrails instead of approvals: pre-approved price bands, pre-approved financing options, and manager review only for exceptions outside the bands. The proposals inside the guardrails go straight to the customer.
Tooling the SLA: What to Automate and What to Keep Human
Automate anything that is calculation, rendering, or document assembly. Keep human judgment on layout tradeoffs, pricing strategy, and the customer conversation. The classic failure mode is automating the selling and hand-crafting the math, which is exactly backwards.
On the automation side, 4 things should never consume designer hours again. First, manual shading math: cloud-rendered shadow analysis replaces hour-by-hour obstruction calculations. Second, yield simulation and financial modeling: the generation and financial tool produces payback, IRR, and NPV in the same workspace as the design, so there is no spreadsheet re-keying. Third, proposal document assembly: templates with auto-filled financials and visuals remove the formatting tax. Fourth, first-draft proposal copy: Clara AI drafts design descriptions and proposal text that a rep edits instead of writing from scratch.
Keep these human. Layout decisions on complex roofs, because a designer who has stood on 500 roofs spots drainage and access issues a model misses. Pricing, because your margin strategy changes by competitor and by season. And the presentation, because deals close on trust, not on PDFs.
The broader principle: a rep should touch a job 3 times (survey handoff, pricing review, presentation), and the software should do everything between those touches. Our post on how proposal software increases solar sales quantifies the time savings per stage.
There is also a tooling tradeoff worth naming. Desktop CAD-based design tools give fine-grained control that power users love, and for unusual structures that control matters. But desktop tools force a serial workflow: one licensed machine, one user, files passed around by email. A cloud platform lets the surveyor, designer, and rep work on the same project record the same day. For the 90% of jobs that are standard residential rooftops, the parallel workflow beats the extra control. For the other 10%, accept the slower clock and flag the job as an SLA exception up front.
See a full design-to-proposal run in 20 minutes
Watch our team go from rooftop imagery to a branded proposal with financials, live, on your own example project.
Book a DemoNo commitment required · 20 minutes · Live project walkthrough
Staffing the SLA: Capacity Math for Your Design Team
A 24-hour SLA lives or dies on capacity, so do the math before you promise it. One designer on a modern cloud platform completes 6-10 residential designs per day. That means a 20-surveys-per-week residential operation needs roughly 1 full-time designer, plus 30-50% buffer for complex roofs, revisions, and sick days.
The formula is simple: weekly surveys × minutes per design ÷ available designer minutes = designers required. For a 20-survey week at 60 minutes per design, you need 1,200 design minutes against roughly 2,400 available minutes per designer per week. One designer carries it at 50% load. At 40 surveys per week, you are at 100% load and one absence breaks the SLA. That is your trigger to hire or cross-train.
Three capacity tactics keep the SLA safe as volume grows. First, cross-train 1-2 senior sales reps to build standard residential designs, so overflow has somewhere to go. Second, batch commercial work into specific days so a 500 kW project does not stall 15 residential jobs behind it. Third, keep a pre-approved outsourcing agreement on file for genuine overflow weeks. The exception is worth stating plainly: if your volume swings wildly by season, size the team for the shoulder season and absorb peaks with cross-trained reps, because a permanently oversized design team burns margin 6 months a year.
The Myth: Faster Proposals Mean Sloppier Designs
The most common objection we hear from design managers is that a 24-hour SLA will degrade design quality. Our take, after watching teams on both sides of this: the opposite is true. Fast pipelines produce better designs because they run on standardized inputs and fewer context switches.
Here is the tradeoff, honestly framed. A designer who starts a layout 6 days after the survey works from stale memory and half-remembered site details. That designer makes more errors than one who models the roof the morning after the survey, while the surveyor is still reachable by phone. Slow queues also fragment attention. A designer juggling 15 aging jobs re-opens files, re-reads notes, and re-does work. Rework, not speed, is what introduces mistakes.
The quality lever is not elapsed time in the queue. It is the checklist at the front and the simulation at the back. A physics-based shading engine catches layout errors more reliably than a tired designer on a Friday afternoon. Standardized survey data removes the guesswork that slow teams mislabel as “thoroughness.”
Where the myth does hold: compressing the design session itself below 20-30 minutes for a complex roof, or skipping the simulation step to save 10 minutes. That is rushing, and it does cause errors. The SLA targets the queue, not the craft. Cut the 5 days of waiting, keep the 60 minutes of design work intact.
There is one more nuance worth admitting. A brand-new designer will be slower, and forcing a junior hire onto a 24-hour SLA in week 1 does produce sloppy work. Ramp new designers on a 48-hour clock for their first month, then tighten. The SLA is a team standard, not a hazing ritual.
Measuring SLA Performance: KPIs and Cadence
Track 4 metrics weekly: median survey-to-design hours, median design-to-proposal hours, SLA compliance rate per stage, and close rate by delivery speed band. Medians, not averages, because one stuck commercial job will skew a mean and hide a residential problem.
| Metric | Target | Review cadence | Owner |
|---|---|---|---|
| Median survey-to-design time | under 24 h | Weekly | Design lead |
| Median design-to-proposal time | under 8 h | Weekly | Sales manager |
| SLA compliance rate | 85%+ of jobs | Weekly | Ops / owner |
| Close rate by speed band (under 48 h vs over 7 days) | Tracked monthly | Monthly | Sales manager |
| Designer throughput (designs per designer per week) | Baseline +10%/quarter | Monthly | Design lead |
The close-rate-by-speed-band row is the one that sustains executive attention. When the owner sees that under-48-hour quotes close at, say, 38% and week-plus quotes close at 19% (hypothetical example, run your own numbers), the SLA stops being an ops nicety and becomes a revenue target. Our solar proposal analytics guide shows how to instrument proposal opens and views so you know exactly when engagement drops.
Review cadence matters more than dashboard polish. Fifteen minutes in Monday standup on breaches, one monthly session on trends. Skip the weekly review for a month and compliance quietly slides back to the old baseline.
Here is a worked example of the capacity math behind the KPI table. A 60-person installer runs 30 residential surveys per week. At 60 minutes of design work per job, that is 1,800 design minutes. Two designers provide roughly 4,800 available minutes, so the team runs at about 38% load with headroom for revisions. The SLA breaks only when survey volume jumps past about 65 per week, which is the signal to add a third designer or activate cross-trained reps. Run this same calculation with your own minutes-per-design number; teams on legacy desktop tools often measure 3-4 hours per design, which halves the breaking point.
For teams running high lead volume in India, the same SLA logic applies on the CRM side. Pairing a fast design pipeline with automated follow-up is standard practice there; the QuickEstimate guide to proposal automation covers how Indian EPCs wire proposals and follow-ups together.
Conclusion
Solar design turnaround time is a sales weapon disguised as an ops metric. The installer who delivers a credible proposal in 24-48 hours anchors the deal, signals competence, and closes before slower competitors finish their first draft. The fix is not heroic effort. It is 2 SLAs, a standardized survey checklist, automation of the calculation and document work, and a weekly review that treats breaches as real.
Three actions to take this week:
- Baseline your current turnaround. Timestamp survey-to-proposal for your last 100 deals and split close rates by delivery speed. You cannot fix a number you have never measured.
- Set the 2 SLAs and name their owners. Survey-to-design in 24 hours owned by the design lead, design-to-proposal in 8 working hours owned by the sales rep. Review every breach within 24 hours.
- Remove the 3 biggest wait states. Standardize the survey checklist, move shading and financial simulation into one cloud workspace, and template your proposals so assembly takes minutes, not hours.
Frequently Asked Questions
What is a good solar design turnaround time?
A good solar design turnaround time is 24-48 hours from completed site survey to a proposal in the customer’s inbox. High-performing residential teams deliver designs within 24 hours of survey data arriving. Commercial teams targeting 100 kW and above should aim for 48-72 hours because of interconnection and load analysis.
How fast should a solar proposal reach the customer after a site survey?
Within 48 hours for residential jobs. Buyer attention decays fast after the survey visit, and most homeowners collect 2-3 quotes. The installer who presents first anchors the price conversation and sets the comparison bar for every competitor who follows.
Does faster proposal delivery really increase close rates?
Yes. Lead-response research popularized by Harvard Business Review shows companies contacting prospects within 1 hour are 7 times more likely to qualify the lead. The same dynamic applies at the proposal stage: industry-observed close rates drop sharply once a quote arrives more than 5-7 days after the survey.
How do I set SLAs for my solar design team?
Set 2 internal SLAs: survey-to-design (24 hours from survey data receipt to completed 3D model and simulation) and design-to-proposal (8 working hours from approved design to delivered quote). Track compliance weekly per designer and per project, and review any job that breaches either SLA within 24 hours.
What tools help hit a 24-hour solar design turnaround?
Cloud-based design platforms with 3D modeling, automated shading analysis, and built-in financial simulation cut design time from hours to minutes. SurgePV combines 3D rooftop modeling, physics-based shadow analysis, energy yield simulation, and branded proposal generation in one workspace, so a designer can go from survey photos to a customer-ready PDF in a single session.
Should I outsource solar design to hit my SLAs?
Outsourcing works as overflow capacity, not as your core SLA strategy. Third-party design services typically quote 24-72 hour turnarounds themselves, so you add a handoff and a revision loop. In-house design on a fast cloud tool gives you same-day revisions and live changes during the sales call, which outsourcing cannot match.
Where this fits
This article is part of SurgePV's Solar Sales & Proposals hub, which works through the topic from first principles to the decisions a project team actually has to make.


