

Quick Answer
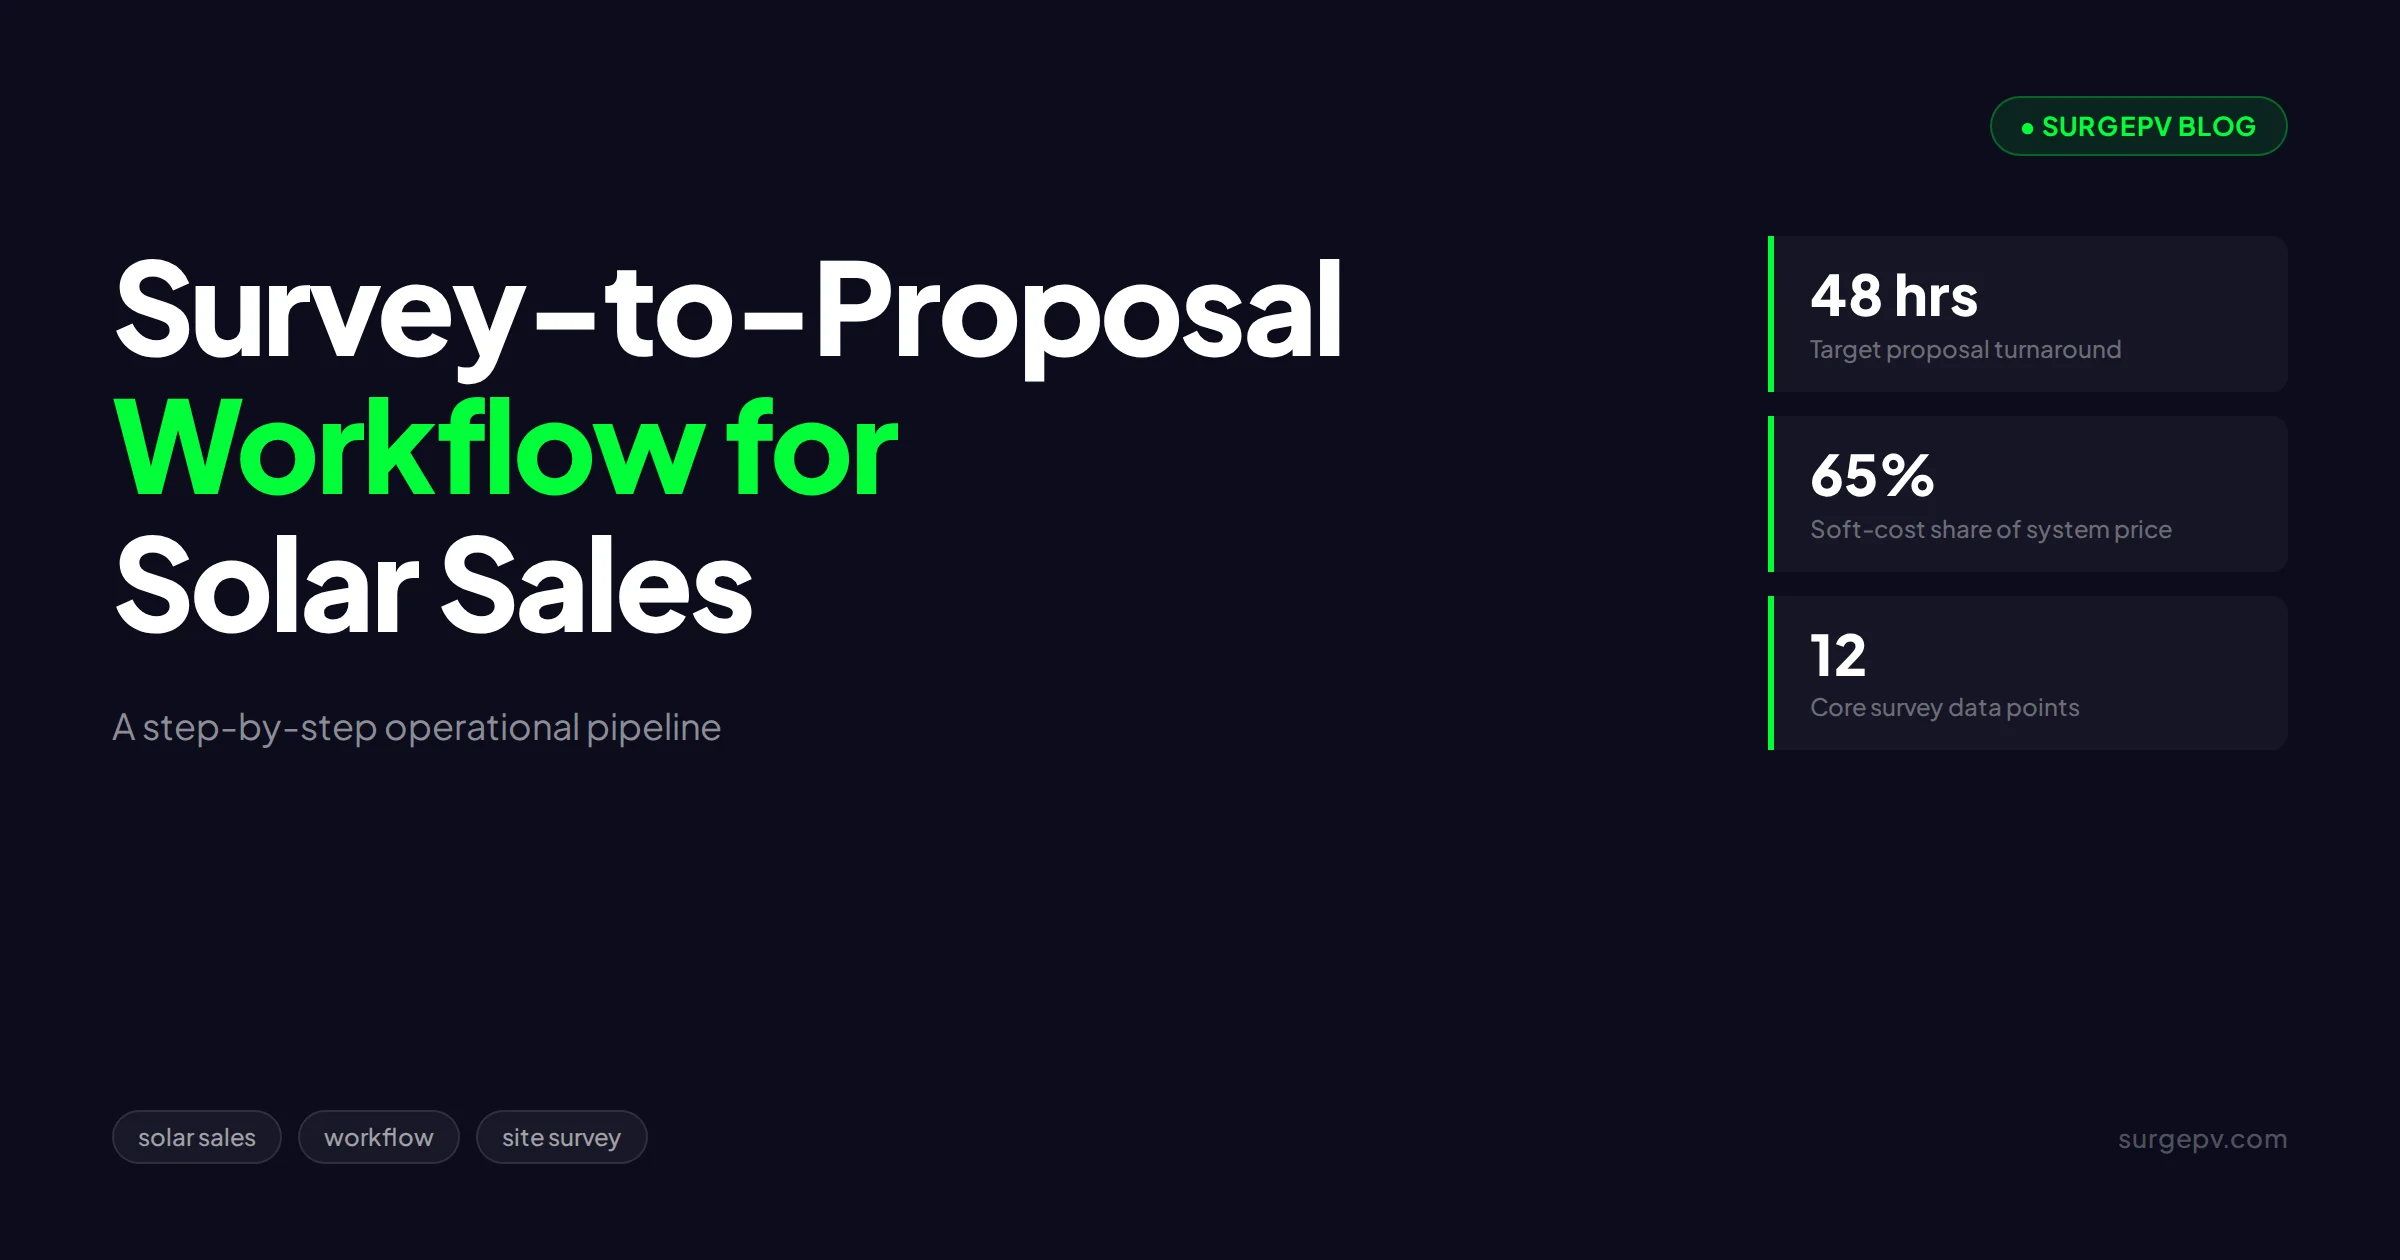
A survey-to-proposal workflow is the operational pipeline that turns site survey data into a delivered solar proposal. Capture 12 core data points on site (roof geometry, obstructions, electrical panel, consumption), hand off to a designer within 4 hours with a standardized packet, design and simulate in a cloud tool, and deliver the branded proposal within 24–48 hours of the site visit.
Most solar deals do not die at the kitchen table. They die in the 3–7 days between the site survey and the proposal, when the survey photos sit in a rep’s phone, the designer waits for missing measurements, and a competitor’s quote lands first. We have watched this pattern repeat across hundreds of installer teams: the company that delivers a clean, accurate proposal within 48 hours of the site visit wins a disproportionate share of deals, even at a higher price.
The survey-to-proposal workflow is the operational pipeline that decides how fast and how accurately you move from a rooftop to a signed quote. It has 5 distinct stages: on-site data capture, the surveyor-to-designer handoff, design and simulation, financial modeling, and proposal delivery. Each stage has a measurable time target, a named owner, and a short list of failure modes. Soft costs like customer acquisition, design, and permitting now account for roughly 65% of U.S. residential system prices, according to NREL’s solar cost benchmarking, so tightening this pipeline is one of the few levers that directly cuts cost per install. The stakes keep rising: solar PV is the fastest-growing power generation technology worldwide, according to the IEA’s solar PV analysis, which means more competitors bidding on every roof.
This guide lays out the full workflow step by step, with the specific data points to capture, handoff rules, turnaround targets, and the tools that hold it together.
Quick Answer
A survey-to-proposal workflow is the operational pipeline that turns site survey data into a delivered solar proposal. Capture 12 core data points on site (roof geometry, obstructions, electrical panel, consumption), hand off to a designer within 4 hours with a standardized packet, design and simulate in a cloud tool, and deliver the branded proposal within 24–48 hours of the site visit.
In this guide:
- Why the survey-to-proposal gap kills more deals than pricing does
- The 12 data points every site survey must capture
- How to structure the surveyor-to-designer handoff
- Turnaround targets for each workflow stage
- Why the all-in-one sales rep model breaks at scale
- The 6 failure points that cause redesigns and lost deals
Why the Survey-to-Proposal Gap Kills Deals
Speed to proposal is one of the strongest predictors of close rate in residential solar. Homeowners typically collect 2–3 quotes before deciding, and the first credible, professional proposal anchors the comparison. Homeowners who compare multiple quotes save meaningfully on system price, according to EnergySage marketplace data — which means every serious buyer is shopping, and the window between survey and decision is short.
The gap hurts in 3 ways. First, momentum decays: the enthusiasm from a good site visit fades within days. Second, competitors fill the silence with their own proposals. Third, slow delivery signals operational weakness, and buyers correctly infer that a slow proposal often means a slow install.
We see the same internal cause in most slow teams: the workflow has no owner. The rep assumes the designer is working on it. The designer is waiting for the consumption data the rep never sent. Nobody notices until the lead goes cold. The fix is not heroic effort — it is a defined pipeline with stage-level time targets, which the rest of this guide builds out. If your broader funnel also leaks, pair this with our breakdown of solar sales pipeline stages.
What to Capture During the Site Survey
The site survey exists to answer one question: can a designer produce a buildable, financeable system without coming back? Everything you capture serves that goal. Our solar site survey checklist covers the full field protocol; here is the workflow-level summary of the 12 data points that matter most.
Roof and structure:
- Roof dimensions per usable face, measured or captured via drone
- Roof pitch and azimuth per face
- Roof material, age, and condition — with photos of any damage
- Rafter size and spacing from the attic, when accessible
Shading and obstructions:
- Obstruction inventory — vents, chimneys, skylights, dormers — with locations and heights
- Shading photos from array height, facing each horizon direction
- Tree and neighboring-building heights that shade the roof between 9 AM and 3 PM
Electrical:
- Main service panel photos — cover, label, and breaker layout — plus panel amperage rating
- Meter type and location, plus available wall space for equipment
- Grounding path and conduit route options
Consumption and customer:
- 12 months of electricity bills or a utility data release — this drives system sizing
- Internet connectivity for monitoring, plus customer priorities (bill offset, backup, EV plans)
Two of these deserve emphasis. Consumption history is the single most-skipped item, and skipping it produces systems sized to the roof instead of the load. A 9 kW system on a household using 6,000 kWh a year oversells equipment and invites a discount renegotiation later. Where the utility supports it, pull interval data rather than annual totals — interval data also tells you whether a battery pencils out. And customer priorities belong in the survey, not the rep’s memory, because the designer needs them to choose between maximizing offset and reserving roof space for a future EV circuit. A rep who promises battery readiness without telling the designer creates a redesign by default.
Pro Tip — Photos Are the Handoff
Require a fixed photo set on every survey: 4 cardinal-direction shots from the roof, panel label close-up, panel interior, meter, attic rafters, and roof condition. A designer who can see the panel busbar rating from a photo never needs to call the surveyor back. Each avoided callback saves 1–2 days of pipeline time.
For companies weighing drones against ladder work, our drone site survey guide compares capture quality and time per roof. In our field experience, drone capture cuts on-site measurement time from over an hour to under 30 minutes per home on standard residential roofs. A growing share of teams also skip the truck roll entirely for simple roofs — see remote solar site assessment for where that works and where it does not.
The Surveyor-to-Designer Handoff
The handoff is where most workflows break, because it is usually informal: a text message, a shared photo album, and a verbal summary. Replace it with a standardized survey packet — a single digital bundle that a designer can work from without any follow-up conversation.
A complete survey packet contains 4 elements:
- The structured form — every field from the capture list above, with required entries so the survey cannot be submitted half-complete
- The photo set — named or auto-tagged by category, not a camera-roll dump
- The consumption file — bills scanned or utility interval data exported
- Customer context — budget signals, financing preference, decision timeline, and any promises the rep made
Set a hard rule: the packet reaches the design queue within 4 business hours of the survey. Same-day handoff keeps the project warm and gives the designer a full next morning to work.
A hypothetical example shows why this matters. A 12-person installer in a suburban market runs 15 surveys a week. Before packet discipline, their surveyors texted photos to whichever designer was free, and average survey-to-proposal time ran 5 days with a 25% redesign rate. After introducing a structured form, a fixed photo set, and a named queue manager, the same team delivered in under 2 days with redesigns down to about 8% — with zero new hires. The numbers are illustrative, but the pattern matches what we see whenever a team formalizes the handoff.
Assign one person as design-queue manager, even in a 5-person company. This person checks packet completeness before accepting it into the queue. Incomplete packets bounce back to the surveyor immediately — not to the designer’s desk, where they stall silently. This single gatekeeping step is the highest-impact process change most installers can make, and it costs nothing.
See the survey-to-proposal pipeline running live
Watch a rooftop model go from site data to simulated design to branded proposal in one SurgePV workspace.
Book a DemoNo commitment required · 20 minutes · Live project walkthrough
Design and Simulation: Turning Data into a System
With a complete packet, a designer’s job is mechanical and fast: build the 3D roof model, place modules, run shading, size strings, and simulate production. On a cloud platform this takes 30–60 minutes per residential project. On a desktop CAD stack it takes half a day, which is why design capacity is the first bottleneck to hit growing installers.
The design stage has 4 quality gates before a project moves to financials:
- Shading verified against survey photos, not just the software’s horizon data. Physics-based irradiance modeling on a 3D model, as in SurgePV’s solar shadow analysis software, catches the tree the satellite image missed — but only if the designer enters real obstruction heights from the survey.
- Layout respects setbacks — fire pathways and ridge clearances for the project’s jurisdiction.
- String design matches real equipment from the module and inverter database, not generic placeholders.
- Production estimate uses the customer’s actual tariff and consumption profile, because the financial model is only as honest as the simulation feeding it. As a sanity check, regional production benchmarks from tools like NREL’s PVWatts calculator flag any simulated yield that drifts far from the local norm before it reaches a customer.
Building the model inside a cloud solar PV design software workspace like SurgePV’s design tool matters for workflow reasons, not just design quality. The model, simulation, and proposal live in one project record. There is no file to export, no version confusion, and no re-entry of the same numbers into a separate quoting spreadsheet. Every re-entry step is a delay plus an error opportunity.
One discipline worth adopting: the designer never guesses. If the packet lacks a panel amperage, the project goes back to the queue manager with a specific question, and the clock is visible to everyone. Guessing produces a fast proposal and a slow, expensive redesign after contract — the worst trade in the pipeline.
Building the Proposal: Financials and Presentation
The proposal converts the technical design into a buying decision. It needs 3 things: accurate financials, a clear story, and the company’s brand — in that order of importance.
Financials first. Run payback, IRR, and monthly savings from the simulated production, the customer’s actual tariff, and the real installed price. SurgePV’s generation and financial tool keeps yield simulation and financial outputs in the same workspace, so the payback figure traces directly back to the design the customer sees. Never quote savings from a generic production estimate for the region; a shaded 6 kW system and an unshaded one differ by 10–25% in first-year output (industry-observed range), and the customer will find out.
Story second. Lead with the homeowner’s numbers — monthly bill before and after, payback year, 25-year savings — then the design visuals, then equipment and warranty details. Reps who open with panel datasheets bury the decision data. For what separates winning proposals from average ones, our solar proposal win rate benchmarks post breaks down the numbers by format and delivery speed.
Brand third. A branded, consistent PDF signals an organized company. A solar proposal tools workflow generates this from the project record in minutes instead of a rep reformatting a template at 9 PM. For teams selling in India, where proposal volume per rep runs higher and WhatsApp delivery is the norm, the same branding discipline applies — QuickEstimate’s guide to branded solar proposals covers that market’s specifics.
A final step many teams skip: a 10-minute internal review call before sending. The rep and designer walk the proposal together, confirm the numbers match what was promised on site, and decide who presents it. Catching one tariff error here is worth more than any design polish.
Turnaround Targets for Each Workflow Stage
You cannot improve what you do not time. These are the stage-level targets we recommend for residential work, based on what consistently fast installers achieve:
| Stage | Owner | Target | Hard Limit |
|---|---|---|---|
| Site survey | Surveyor / rep | 60–90 min on site | Same day as scheduled |
| Survey packet to design queue | Surveyor | 4 business hours | Same day |
| Design and simulation | Designer | 1 business day | 2 days |
| Financial model and proposal build | Designer / rep | 4 business hours | 1 day |
| Internal review | Rep + designer | Same day | Next morning |
| Survey to delivered proposal | — | 24–48 hours | 72 hours |
Commercial projects stretch the design and financial stages to 3–5 business days total because of interval-data load analysis and tariff modeling. Everything else holds.
The tools at each step matter less than the discipline, but the wrong stack adds hours:
| Stage | Minimum Tool | Better Option |
|---|---|---|
| Survey capture | Phone camera + paper checklist | Structured mobile form with required photo fields |
| Measurements | Tape, inclinometer, compass | Drone capture or LiDAR-derived roof data |
| Handoff | Shared drive folder | Project record in a cloud platform, one source of truth |
| Design and simulation | Desktop CAD + separate shading tool | Cloud 3D design with physics-based shading in the same workspace |
| Financials | Quoting spreadsheet | Financial model fed directly by the simulated yield |
| Proposal | Word or slide template | Branded PDF generated from the project record |
Notice the pattern: every “better option” removes a re-entry step. Re-entering the same roof dimensions into 3 different tools is where the extra hours and the transcription errors live.
Track 3 metrics weekly: average hours from survey to proposal, percentage of proposals delivered inside 48 hours, and redesign rate after contract. The first predicts close rate, the second measures process discipline, and the third exposes survey quality. Teams that measure these numbers improve them; teams that “feel fast” usually are not. The broader market context reinforces urgency — the U.S. installed over 30 GW of solar capacity in a single recent year, according to the SEIA/Wood Mackenzie U.S. Solar Market Insight, and every one of those projects passed through someone’s survey-to-proposal pipeline.
The Myth of the All-in-One Sales Rep
Here is the contrarian take: the heroic sales rep who surveys, designs, quotes, and closes every deal personally is not a strength. Past roughly 10–15 installs per month, that rep is the bottleneck, the single point of failure, and the reason proposals take a week.
The all-in-one model survives because it works at small volume and because founders built their early companies that way. But the math breaks quickly. A rep who spends 90 minutes per survey and 3 hours per design-plus-proposal can process at most 3–4 projects per week while still selling. Double the lead flow and the proposal stage quietly stretches from 2 days to 6, and close rates fall.
The counterargument deserves respect: handoffs lose context, and a dedicated designer never met the customer. That is true — and it is exactly why the standardized survey packet exists. The packet moves the context, not the person. What actually kills deals is not the loss of the rep’s memory; it is slow delivery and design errors. Division of labor with a disciplined handoff beats personal heroics at any volume above a couple of installs a week.
The honest tradeoff: very small teams under 10 installs a month can legitimately keep design with the rep, provided they use fixed templates and a cloud tool that keeps design time under an hour. The exception collapses the moment lead flow doubles, so build the packet discipline now — it transfers directly when you hire the first designer.
Common Failure Points and How to Fix Them
Across the installer teams we train and support, the same 6 failure points account for nearly every stalled or lost survey-to-proposal pipeline:
- Incomplete surveys. Missing pitch, obstruction heights, or panel photos force redesigns. Fix: required fields and a mandatory photo set before the form submits.
- The silent queue. Packets sit unassigned because nobody owns the design queue. Fix: a named queue manager who accepts or bounces every packet.
- Guessing at design time. Designers fill gaps with assumptions to keep turnaround fast. Fix: a visible bounce-back rule — incomplete means back to the surveyor, never a guess.
- Spreadsheet financials. Quoting from a generic production estimate misstates savings and erodes trust at close. Fix: financials generated from the actual simulated design.
- No delivery standard. “Soon” is not a deadline. Fix: a 48-hour hard target with weekly reporting on compliance.
- Proposal sent, then silence. The rep waits instead of presenting. Fix: every proposal is delivered live — a call or screen-share walkthrough booked when the proposal goes out.
What Most Installers Get Wrong
Most teams treat the site survey as a sales activity and the proposal as the deliverable. Invert it. The survey is a data-collection operation with engineering quality standards, and the proposal is a byproduct of a good pipeline. Companies that make this mental shift cut both turnaround time and redesign rates within a month.
Conclusion
The survey-to-proposal workflow is not glamorous, but it is where residential solar margins are won and lost. Soft costs dominate system prices, speed predicts close rate, and both are controlled by the same 5-stage pipeline: capture, handoff, design, financials, delivery. Define an owner and a time target for each stage, and the pipeline mostly runs itself.
Three actions to take this week:
- Write down your current stage times for the last 10 projects — survey to queue, queue to design, design to proposal. The slowest stage is your first fix.
- Adopt the standardized survey packet with required fields and a fixed photo set, and appoint a design-queue manager to gate it.
- Set a public 48-hour proposal target and review compliance weekly; deliver every proposal live, never as a bare email attachment.
If you want to see how a single cloud workspace compresses the design-to-proposal stages into under an hour, book a SurgePV demo and bring one of your recent projects.
Frequently Asked Questions
What is a survey-to-proposal workflow in solar sales?
It is the repeatable pipeline that moves a project from the site survey to a delivered proposal. It covers on-site data capture, the handoff between surveyor and designer, system design and simulation, financial modeling, and proposal delivery. Top installers run this pipeline in 24–48 hours per residential project.
What data should you capture during a solar site survey?
Capture roof dimensions and pitch, azimuth per roof face, obstruction locations and heights, shading photos, main service panel photos and rating, meter location, attic or rafter condition, roof material and age, internet connectivity for monitoring, and 12 months of electricity consumption. Record everything in a standardized digital form so nothing depends on memory.
How fast should a solar proposal be delivered after the site survey?
The target for residential projects is 24–48 hours from site visit to delivered proposal. Commercial projects run 3–5 business days because of load analysis and tariff modeling. Every day of delay beyond 72 hours measurably lowers close rates, because competing quotes arrive while the homeowner is still deciding.
Should the sales rep or a dedicated designer build the solar design?
For most companies above 20 installs per month, a dedicated designer wins. Sales reps who design their own systems create bottlenecks and inconsistent quality. A shared design desk with a standardized intake packet produces faster turnaround and fewer redesigns. Small teams under 10 installs per month can keep design with the rep if they use templates.
What causes most redesigns after a solar proposal is sent?
Incomplete survey data causes most redesigns. The usual culprits are missing roof pitch, unmeasured obstruction heights, unreadable panel photos, and missing consumption history. A mandatory photo checklist and required form fields at survey time cut redesign rates from an industry-observed 20–30% down to under 10%.
Can you do a solar proposal without a physical site survey?
Yes, for straightforward residential roofs. Remote assessment using satellite imagery, LiDAR-derived roof data, and a homeowner photo questionnaire works for an estimated 60–70% of standard residential jobs. Complex roofs, structural concerns, and commercial sites still need an on-site visit before contract signing.
Where this fits
This article is part of SurgePV's Solar Sales & Proposals hub, which works through the topic from first principles to the decisions a project team actually has to make.


