

The average solar installer sends dozens of proposals every month. Most still cannot answer one simple question: why did this deal close when that one did not?
Solar sales teams know their total wins. They know their monthly revenue. But most lack visibility into the middle of the funnel. They do not know how long each proposal sat before sending. They do not know if the customer opened it. They do not know which financing option drew attention, or which rep skips follow-up. That gap is expensive. A team closing 20% of proposals instead of 30% is leaving one-third of its potential revenue on the table.
Solar proposal analytics fixes this. It turns the proposal from a static PDF into a source of sales intelligence. The right metrics show you where prospects disengage, which reps need coaching, and how fast your team actually moves. In this guide, you will learn:
- What solar proposal analytics includes and what it does not
- The six metrics every sales team should track in 2026
- How to read proposal engagement signals such as re-opens and section views
- Why speed-to-proposal is the strongest lever most teams ignore
- A 10-minute weekly review routine you can start this Monday
- Common mistakes that make analytics misleading
- Which tools capture solar-specific proposal data and how they fit together
Quick Answer
Solar proposal analytics tracks every measurable event in your proposal workflow. That includes creation time, customer opens, section engagement, and close rate. It helps solar sales teams find leaks, coach reps, and close more deals on the same lead volume.
What Solar Proposal Analytics Actually Means
Solar proposal analytics is not just a win/loss report. It is the full data trail that connects your solar design output to your signature output.
A complete view includes upstream, downstream, and engagement metrics. Upstream covers time from site visit to proposal sent. Downstream covers contract conversion. Engagement covers opens, re-opens, time on each section, and financing option clicks. Each data point answers a different operational question.
Upstream metrics diagnose process efficiency. If your average proposal takes 3 days to build, the problem is usually workflow, not sales skill. Engagement metrics diagnose buyer interest. If a prospect opens your proposal four times but never replies, the price or financing terms are likely the blocker. Downstream metrics diagnose closing ability. If two reps send the same number of proposals but one closes 28% and the other closes 9%, the difference is coachable.
Generic document analytics tools such as PandaDoc or Proposify can track opens and signatures. But they miss the solar-specific context. They cannot tell you whether the customer lingered on the production estimate, compared cash versus loan options, or questioned the net metering assumptions. Solar-specific platforms tie proposal analytics back to design data, tariff modeling, and equipment choices.
SurgePV captures this by feeding solar proposal software directly from the system design. Production estimates, bill of materials, and financial outputs populate the proposal automatically. That removes manual re-entry errors and creates a clean data lineage from roof model to signed contract.
The Six Metrics That Matter Most in 2026
You can track dozens of numbers. Most teams see better results by focusing on six.
1. Time to Proposal
Time to proposal measures the hours or days between customer qualification and proposal delivery. EnergySage marketplace data shows that proposals delivered within 24 hours close at roughly 2 to 3 times the rate of slower proposals.
The cause is simple. Solar buyers rarely contact just one installer. The first detailed, credible proposal sets the comparison baseline. Every day you wait gives competitors time to set that baseline instead.
A healthy target for 2026 is same-day delivery for residential leads and within 48 hours for commercial leads requiring custom engineering.
2. Proposal Open Rate
Proposal open rate is the percentage of sent proposals that the customer opens at least once. Healthy solar installers see 70% to 85% open rates on WhatsApp-delivered proposals. Email-only delivery opens at 40% to 55%, according to QuickEstimate field data from Indian EPCs.
Low open rates usually mean a delivery problem, not a content problem. The proposal may be landing in spam, going to the wrong number, or arriving as an attachment customers distrust. Switching from email to WhatsApp or a branded web link often fixes this overnight.
3. Proposal Re-Open Rate
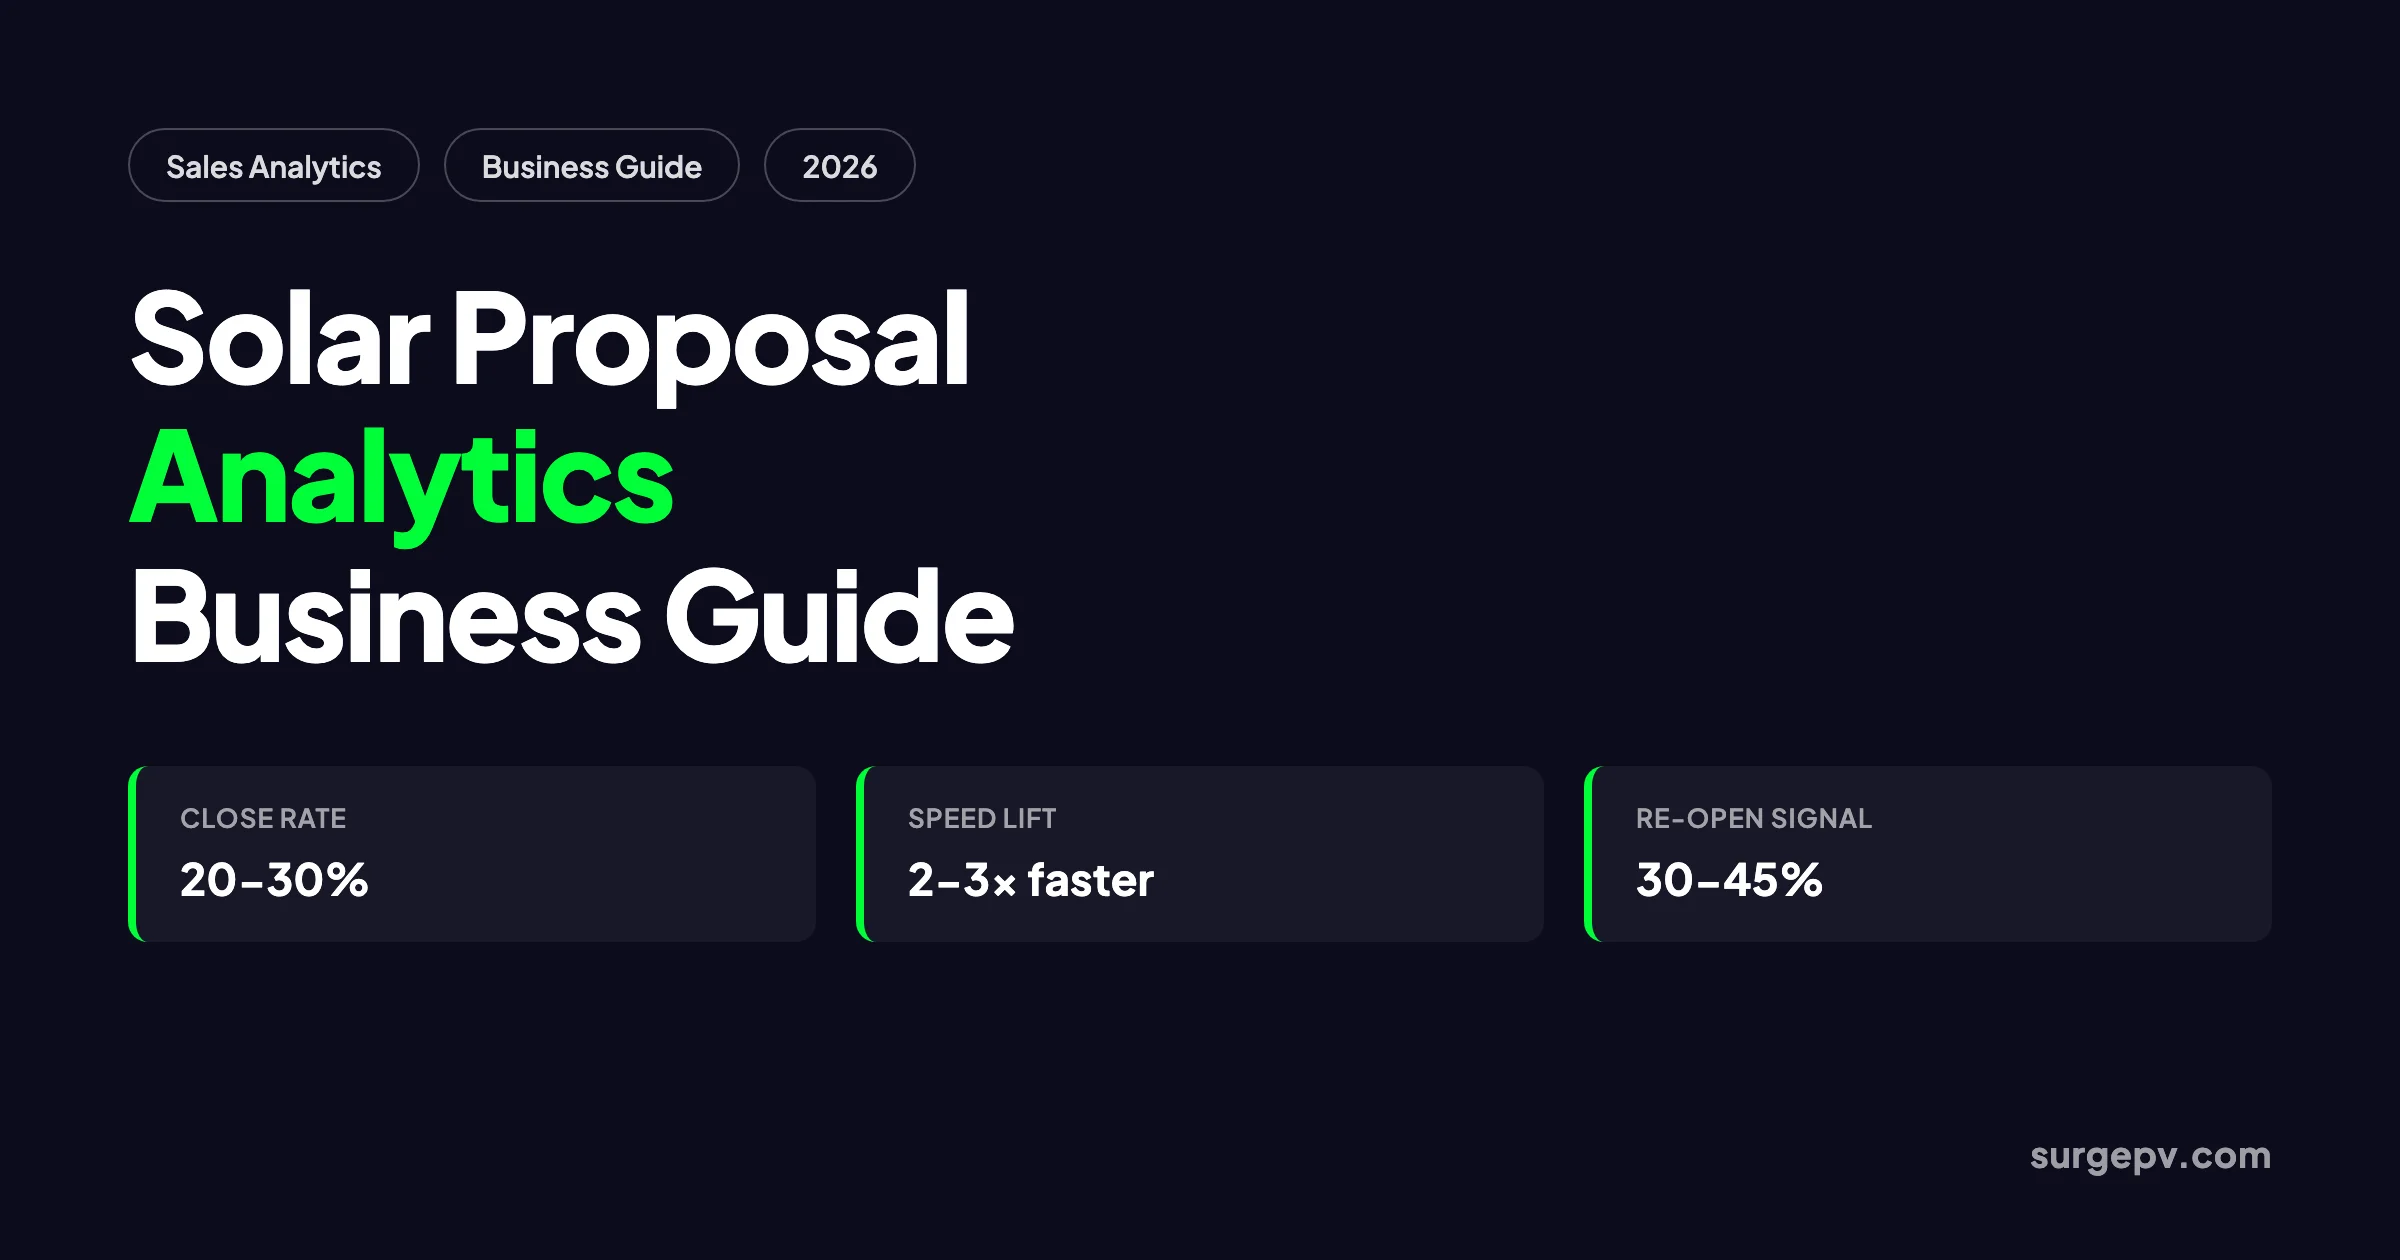
Re-open rate is the percentage of opened proposals that the customer opens two or more times. This is one of the most underused signals in solar sales. A re-open rate of 30% to 45% means the prospect is actively considering your offer, comparing it to competitors, or discussing it with family or partners.
Re-opens are buying signals. The best sales teams trigger an alert and follow up within 2 hours of a re-open. That call closes at roughly double the rate of a cold follow-up because it reaches the prospect at the moment of interest.
4. Proposal-to-Close Rate
Proposal-to-close rate, also called win rate, is the percentage of sent proposals that become signed contracts. For solar EPCs in 2026, a healthy range is 20% to 30%. Rates below 12% usually indicate a systemic problem such as poor proposal quality, weak follow-up, or unqualified leads entering the pipeline.
This metric is most useful at the rep level. Comparing win rates across reps reveals coaching opportunities. A rep with a high send volume but low close rate may be sending proposals too early. A rep with low send volume but high close rate may be overly selective and leaving pipeline unfilled.
5. Average Deal Size
Average deal size is total contract value divided by deals closed. It shows whether your team is moving upmarket, downsizing quotes to close faster, or shifting toward smaller residential systems.
In the United States, the average residential system price was $3.35 per watt in Q3 2025, according to SEIA and Wood Mackenzie data. In India, residential deals commonly range from ₹1.20 lakh for 2 kW systems to ₹2.50 lakh for 5 kW systems, according to QuickEstimate 2026 benchmarks. Track this monthly by segment, not just as a blended number.
6. Follow-Up Attempts Before Closed-Lost
Follow-up attempts measure how many times your team contacts a prospect after sending a proposal before marking the deal lost. The average solar deal requires 4 to 6 touches to close. Yet most reps give up after 2 attempts, according to JMK Research’s 2025 Indian solar EPC survey.
A structured cadence of call, WhatsApp, call, email, WhatsApp, and final call consistently outperforms ad-hoc follow-up. Teams that enforce 5 to 7 attempts typically close nearly double the rate of teams that stop at 2.
How to Read Proposal Engagement Signals
Engagement data becomes useful only when you connect it to buyer behavior. A single open tells you almost nothing. A pattern of opens, section views, and revisits tells you a lot.
Here is how to interpret common signals:
| Signal | What it usually means | Recommended action |
|---|---|---|
| Opens once, no return | Curiosity or polite acknowledgment | Follow up within 24 hours with a short clarification |
| Opens multiple times in one day | Active comparison or internal discussion | Call within 2 hours while interest is high |
| Spends time on financing section | Price or payment structure is the main concern | Prepare a financing comparison or incentive breakdown |
| Skips production section, reads warranty | Trust or equipment quality is the blocker | Share equipment datasheets, certifications, or local references |
| Forwards to another email | A second decision-maker is involved | Ask who else needs to see the proposal and offer a group call |
The most valuable pattern is the re-open cluster. If a prospect opens your proposal three times in two days, they are no longer browsing. They are deciding. The rep who calls at that moment catches the prospect in active evaluation. The rep who waits 48 hours often catches a voicemail.
This is where solar-specific analytics pulls ahead of generic document tracking. SurgePV proposals show which sections drew attention, whether the customer toggled between cash and loan options, and how long they spent on the savings projection. That context shapes the follow-up conversation.
The Speed-to-Proposal Effect
Speed is the most underrated variable in solar proposal analytics. It is also the easiest to improve.
Manual PDF workflows take 1 to 3 hours per proposal. Design data gets copied into Excel. Financials get formatted separately. The PDF gets attached to an email. By the time the customer receives it, the rep has already lost the momentum from the site visit or sales call.
Solar-specific platforms compress that timeline. SurgePV generates proposals in roughly 8 minutes from a completed design, as detailed in our solar sales proposal software comparison. SOLARTabs, an Australian installer, reported that its win rate rose from 22% to 41% after switching to SurgePV’s proposal workflow. SunWorks Australia cut proposal creation time from 3 hours to 20 minutes.
The math compounds quickly. A 5-person sales team that moves from 2 proposals per rep per week to 5 proposals per rep per week sends 60 more proposals per month. At a 25% close rate, that is 15 extra deals per month. At an average residential deal size of ₹1.60 lakh, the same headcount adds ₹2.4 crore in annual pipeline value.
Speed also improves quality. When proposals are fast to build, reps have time to customize them for each prospect. They can adjust panel layouts, compare financing options, and add local incentive details. When proposals are slow, reps reuse templates and skip personalization.
Building a Weekly Proposal Review Routine
Analytics only works if someone looks at it regularly. A 10-minute Monday review is enough to spot problems before they show up in revenue.
Cover these five items each week:
- Proposal volume — How many proposals did each rep send last week? Compare to the target of 12 to 20 per rep per month.
- Open and re-open rates — Are customers engaging? A sudden drop in open rate usually signals a delivery problem.
- Time to proposal — Is the team staying under 24 hours for residential and 48 hours for commercial?
- Close rate by rep — Who is converting and who needs coaching?
- Pipeline value — Is your open pipeline 3 to 4 times your monthly revenue target?
Keep the review short. The goal is not to produce a board report. It is to find one actionable problem each week and fix it. One week you might discover that proposals sent on Friday afternoon have lower open rates. The next week you might find that one rep’s follow-up attempts dropped from 6 to 2.
For daily execution, set alerts on hot signals. A re-open, a financing section view, or a proposal shared to a second email should trigger an immediate task for the assigned rep. Waiting until the weekly review wastes the moment of interest.
Benchmarking Your Current State
Before you optimize, you need an honest baseline. Most teams overestimate their speed and underestimate their leaks. A one-week audit gives you the truth.
Pull the last 30 sent proposals and record five numbers for each:
- Date and time the lead was qualified
- Date and time the proposal was sent
- Delivery channel used, such as WhatsApp, email, or web link
- Whether the customer opened it, and how many times
- Final outcome, such as won, lost, or still open
Calculate your averages. Compare them to the benchmarks in this guide. Do not judge the team yet. The goal is to see where you stand.
Most teams discover one of three patterns. They send proposals fast but customers rarely open them. They get opens but few re-opens. Or they get strong engagement but reps stop following up too early. Each pattern points to a different fix.
Document the baseline. In 90 days, run the same audit. The delta tells you whether your changes worked.
Common Mistakes That Distort Your Numbers
Bad data leads to bad decisions. These are the most common ways solar sales teams misread their proposal analytics.
Tracking sent proposals as success. A sent proposal is not a completed task. It is the start of a conversion sequence. Measure what happens after the send.
Blending residential and commercial metrics. A commercial proposal with a 6-week sales cycle should not be averaged with a residential proposal that closes in 3 days. Segment your metrics by project type.
Ignoring the source of the lead. Referral leads close at 30% to 37%. Google organic leads close closer to 15%, according to Ipsun Solar data and our solar sales commission guide. Comparing rep win rates without controlling for lead source confuses skill with lead quality.
Counting unqualified proposals. A rep who sends 30 proposals to cold leads will have a lower close rate than one who sends 10 to warm leads. Track proposal send rate alongside close rate to see the full picture.
Chasing vanity metrics. Total proposals sent and total revenue are easy to report but hard to act on. Focus on ratios and rates that reveal process health.
A/B Testing Proposals with Analytics
Once you have baseline numbers, you can test changes and measure their impact. A/B testing works for solar proposals when you keep the variables clean.
Test one element at a time. Split your next 40 proposals into two groups. Group A uses your current cover page and financing order. Group B leads with the 25-year savings chart and shows three financing options side by side. Track open rate, re-open rate, and close rate for each group.
Common tests that move the needle:
- Subject line or message. “Your solar savings proposal” often outperforms “Quote attached.”
- Financing presentation. Showing three options, cash, loan, and $0 down, usually beats a single recommendation.
- Lead image. A 3D roof render typically pulls more engagement than a generic panel photo.
- Savings framing. “Save ₹4.2 lakh over 25 years” often works better than “Reduce your bill by 72%.”
Run each test for at least 20 proposals per group. Smaller samples can produce misleading winners. Document the result and roll the winner into your standard template.
Analytics turns proposal creation from art into experiment. Reps stop arguing about which version is better. The data decides.
Tools That Capture Solar Proposal Analytics
Solar proposal analytics requires two layers. The proposal layer captures design-to-document data. The CRM layer tracks lead source, follow-up, and pipeline movement.
Proposal Layer
Solar-specific proposal platforms capture data that generic document tools cannot:
- SurgePV — Design-integrated proposals auto-populate from 3D models and production simulations. Tracks proposal creation time, section engagement, financing option views, and e-signature status. Includes generation and financial tool outputs for savings and payback calculations. Built for solar sales professionals who need speed and accuracy.
- Aurora Solar — Strong web proposal engagement tracking and Sales Mode for in-home presentations. Lacks built-in electrical documentation.
- Solargraf — Fast iPad-based proposals with Express Editor. Best for Enphase-exclusive residential dealers.
- OpenSolar — Free core tier with basic proposal tracking. Good for startups and international teams.
CRM Layer
The CRM connects proposal data to the rest of the sales funnel. For Indian solar EPCs, QuickEstimate tracks lead source, follow-up cadence, proposal open events, and rep win rates in one dashboard. It also automates WhatsApp follow-ups, which is critical in markets where WhatsApp delivers 85% to 92% proposal open rates.
For teams outside India, look for a CRM that integrates with your proposal tool and supports automated follow-up triggers based on engagement signals.
Connecting Analytics to Process Improvement
Analytics is a diagnostic tool, not a magic fix. The value comes from the changes you make after you see the numbers.
Start with one metric at a time. If your time to proposal is over 48 hours, fix the workflow before you worry about close rate. If your open rate is below 50%, switch delivery channels before you redesign the proposal. If your re-open rate is high but close rate is low, train reps to follow up within 2 hours of a re-open.
Use rep-level data for coaching, not punishment. A low win rate is a conversation starter. Ask whether the rep needs help with qualification, proposal customization, objection handling, or follow-up discipline.
Build feedback loops between sales and design. If proposals frequently stall on the production estimate section, check whether the design assumptions are too aggressive. If customers keep asking about inverter brands, add a comparison table to the proposal template.
For teams ready to systematize this, SurgePV’s design-to-proposal workflow captures the upstream data automatically. Pair it with a CRM that triggers follow-up based on engagement events, and you close the loop from first send to signed contract.
What Good Looks Like in 90 Days
A team that implements solar proposal analytics properly should see measurable changes within a quarter. Time to proposal drops below 24 hours for residential work. Open rates rise above 70%. Re-open alerts trigger same-day follow-up. Close rates improve by 5 to 10 percentage points.
The real change is cultural. Reps stop guessing. Managers coach with numbers. The weekly review becomes the most useful 10 minutes of the week. The pipeline becomes predictable enough to plan hiring, inventory, and installation capacity.
That predictability is the hidden ROI of proposal analytics. It is not just about closing the next deal. It is about building a sales operation that scales without relying on a single star performer.
Frequently Asked Questions
What is solar proposal analytics?
Solar proposal analytics is the practice of tracking data across every stage of your sales proposal workflow. It covers how long proposals take to create, how customers engage with them, which reps close best, and where deals stall before signature.
What is a good proposal-to-close rate for solar installers in 2026?
A healthy proposal-to-close rate for solar installers in 2026 is 20% to 30% for residential and light commercial EPCs. Rates below 12% usually point to proposal quality, follow-up, or qualification problems.
Which proposal metrics should solar sales teams track first?
Start with proposal send rate, open rate, re-open rate, time-to-proposal, proposal-to-close rate, and average deal size. These six metrics diagnose the biggest leaks without overwhelming your team.
How does proposal speed affect close rates?
Proposals delivered within 24 hours close at roughly 2 to 3 times the rate of slower proposals, according to EnergySage marketplace data. Speed signals responsiveness and keeps the customer from shopping competitors.
What does a high proposal re-open rate mean?
A re-open rate of 30% to 45% means prospects are returning to your proposal to compare options or discuss with decision-makers. It is one of the strongest buying signals and should trigger fast follow-up within 2 hours.
Can generic proposal tools track solar proposal analytics?
Generic tools like PandaDoc or Proposify track document opens and signatures. But they miss solar-specific signals such as production estimate accuracy, financing option selection, tariff modeling, and design-to-proposal data flow.
How often should solar sales teams review proposal analytics?
Run a weekly 10-minute review every Monday. Cover proposal volume, open and re-open rates, close rate, time-to-proposal, and rep-level win rates. Daily alerts work best for hot engagement signals like re-opens.
What tools connect solar proposal analytics to CRM data?
Solar-specific platforms such as SurgePV capture design-to-proposal data, while CRMs built for solar sales such as QuickEstimate track lead source, follow-up, and pipeline analytics. Integrating the two gives a complete picture.
Conclusion
Solar proposal analytics turns guesswork into a repeatable sales process. The teams that win in 2026 are not the ones with the best panels or the lowest prices. They are the ones that know exactly where their proposals leak and fix those leaks every week. SurgePV builds this into one cloud platform used by installers and EPCs worldwide.
Three actions will get you started:
- Pick your six metrics and start tracking them this week. Time to proposal, open rate, re-open rate, close rate, average deal size, and follow-up attempts cover 80% of what matters.
- Run a 10-minute Monday review with one actionable goal. Do not build a dashboard no one reads. Build a habit of acting on the data.
- Speed up your proposal workflow before you optimize anything else. A faster proposal does not just save time. It wins deals.
If your team is ready to connect design data, proposal analytics, and CRM follow-up in one workflow, book a SurgePV demo. A 20-minute walkthrough will show how the platform captures proposal metrics from the first design click to the final signature.
Where this fits
This article is part of SurgePV's Solar Sales & Proposals hub, which works through the topic from first principles to the decisions a project team actually has to make.


