

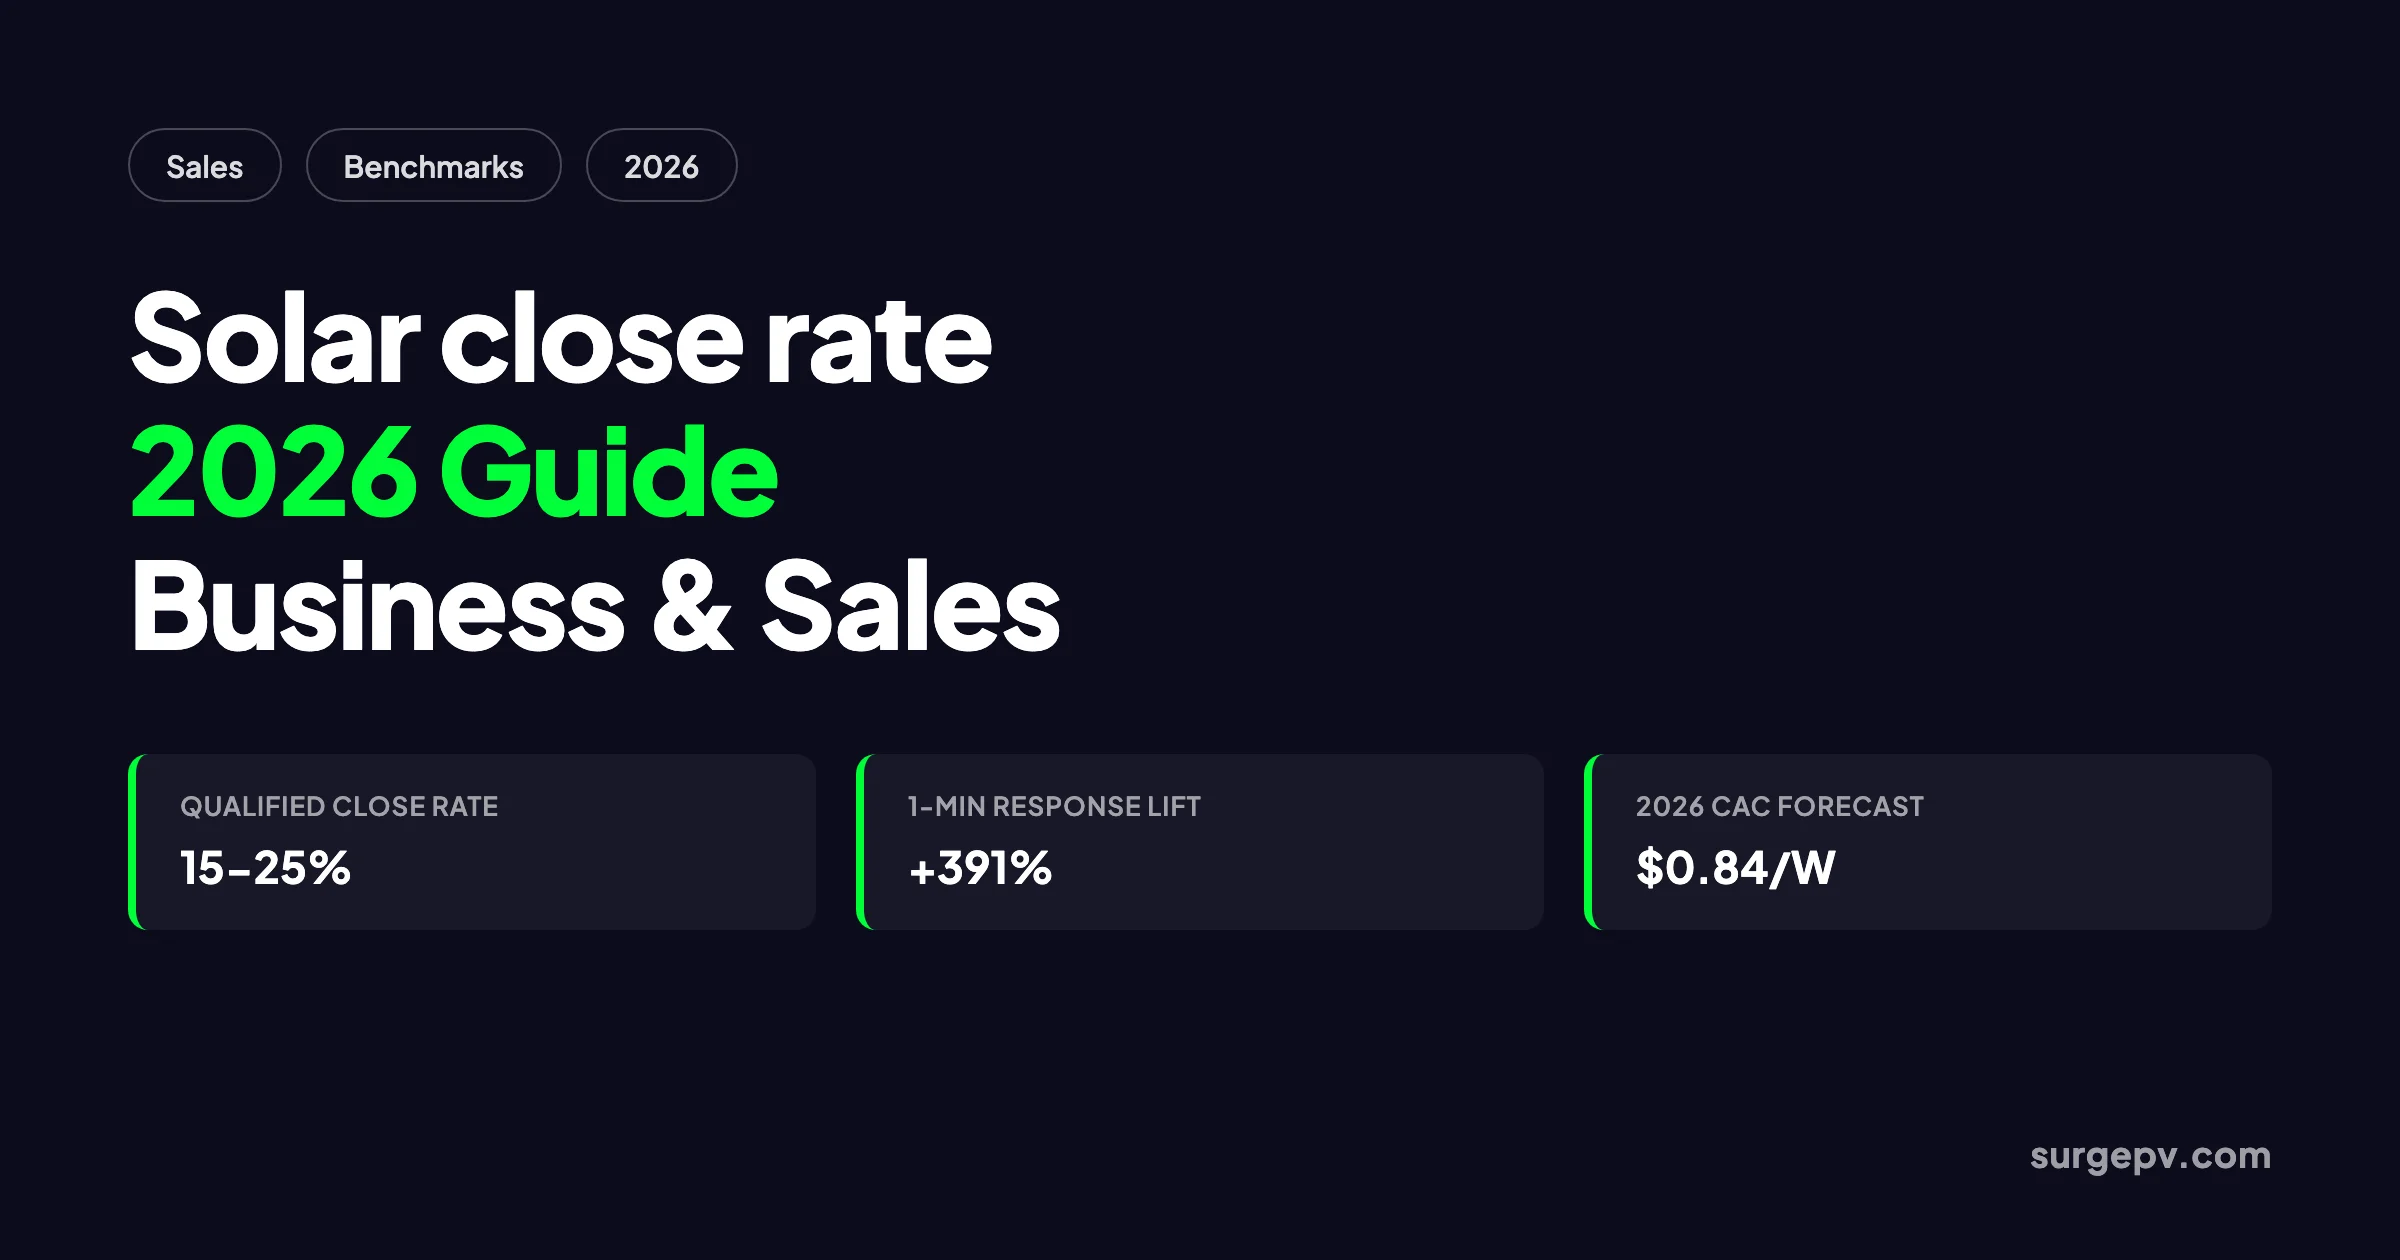
Customer acquisition costs in residential solar hit about $0.60 per watt in 2025. Wood Mackenzie projects they will jump 40% to roughly $0.84 per watt in 2026 as the market adjusts to the post-ITC environment. Soft costs already eat around half of every residential system price, according to NREL. In that context, buying more leads is an expensive way to grow. The cheaper, faster lever is converting more of the leads you already have.
That is what solar close rate measures. It is the share of leads or opportunities that become signed contracts. It is also one of the most mismeasured numbers in solar sales. Teams compare themselves to benchmarks that use different denominators, blame reps for lead-quality problems, and ignore the proposal-to-close stage where most deals actually die.
This guide gives you a clean definition, 2026 benchmarks, and a practical playbook for raising your close rate without increasing marketing spend. If you want a broader view of the full funnel, see our solar sales conversion guide.
Quick Answer
The average solar close rate is 3–5% of total leads and 15–25% of qualified leads. Top-performing installers reach 25–35% by responding fast, using site-specific 3D proposals, and following a structured 14-day cadence. The biggest gains usually come from fixing the proposal-to-close stage, not generating more leads.
In this guide:
- How to define and calculate solar close rate correctly
- 2026 benchmarks by funnel stage and lead source
- Why most close-rate numbers are misleading
- The five levers that move close rates
- A 90-day improvement playbook
- The most common mistake sales teams make
- How close-rate gains compress customer acquisition cost
- Tools and workflows that make the gains stick
What Is Solar Close Rate?
Solar close rate is the percentage of leads or prospects that become signed contracts. The formula is simple:
Close Rate = (Closed-Won Deals ÷ Total Leads) × 100
A team that signs 15 contracts from 300 leads has a 5% close rate. The same team that signs 15 contracts from 75 qualified opportunities has a 20% win rate. The math is identical. Only the denominator changes.
That distinction matters because solar teams use the word “close rate” to mean at least three different things:
- Lead-to-close rate: deals won divided by every lead that enters the CRM.
- Appointment-to-close rate: deals won divided by appointments run.
- Proposal-to-close rate: deals won divided by proposals sent.
A door-to-door team might quote a 30% close rate because they count only sit-down appointments. A digital-first installer might report 4% because they count every web form fill. Both can be true at the same company.
Close rate also differs from win rate. Win rate narrows the denominator to qualified opportunities only. It answers whether your reps can execute once a real opportunity exists. Close rate answers whether your entire funnel, from lead source to signed contract, is working.
If your win rate is strong but your close rate is weak, the problem is upstream: lead quality, qualification, or response speed. If both are weak, the problem spans the whole funnel. Fixing the wrong one wastes time and money.
Solar Close Rate Benchmarks for 2026
Benchmarks only help when you know what is being measured. The table below uses consistent definitions so you can compare your own numbers honestly.
| Funnel Stage | Low Performer | Industry Average | Top Quartile |
|---|---|---|---|
| Lead to first appointment | 15–20% | 25–35% | 45–55% |
| Appointment to proposal sent | 40–55% | 60–70% | 80–90% |
| Proposal sent to signed contract | 8–12% | 18–25% | 35–45% |
| Lead to close (all leads) | 1–2% | 3–5% | 20–30% |
| Qualified lead to close | 8–12% | 15–25% | 25–35% |
| Days from lead to close | 60–90 | 30–45 | 14–21 |
The widest spread is at the proposal-to-close stage. Top teams close more than one in three proposals. Low performers close fewer than one in ten. That gap is rarely about price. It is about what happens after the proposal leaves the rep’s hands.
Lead source changes the picture even more. Data published by Sunvoy, based on actual installer performance, shows how different channels convert:
| Lead Source | Appointment Booking Rate | Close Rate of Booked Appointments | Net Lead-to-Close Rate |
|---|---|---|---|
| Referrals | ~80% | ~37.5% | ~29% |
| Solarize / community campaigns | High | ~33% | ~33% |
| Radio | ~90% | ~35% | ~30% |
| Yelp / review platforms | Moderate | Moderate | ~23.5% |
| Organic web / search | Moderate | Lower | Below referrals |
| Paid social / shared leads | Lower | Lower | Often under 10% |
Referrals and community-driven leads convert highest because trust is already present. Shared paid leads convert lowest because the same prospect is talking to several installers at once. The lesson is not to abandon paid leads. It is to measure cost-per-close, not cost-per-lead, for every source.
Solar Close Rate by Sales Motion
The sales motion shapes the close rate as much as the lead source. Door-to-door, inside sales, and remote digital sales each operate with different timelines, trust levels, and decision pressures.
Door-to-door solar sales
Door-to-door teams usually quote the highest close rates because they control the denominator. A rep who counts only sit-down appointments may report 25–35% close rates. That is an appointment-to-close rate, not a lead-to-close rate. When you include all doors knocked or contacts made, the true lead-to-close rate is often 3–8%.
The advantage of D2D is immediacy. A good rep can qualify the roof, build rapport, and run a preliminary proposal on the spot. The disadvantage is saturation. In neighborhoods that have been knocked repeatedly, the word “solar” triggers an automatic rejection. The best D2D teams now pre-qualify territories with satellite data and focus on streets with recent installs for social proof.
Inside sales
Inside sales teams handle inbound phone and web leads. Their close rate depends heavily on speed. A rep who calls within one minute has a massive advantage over a rep who calls an hour later. Inside teams also benefit from CRM-driven follow-up because they manage a higher volume of leads per rep.
The typical inside sales close rate from raw leads is 4–8%, and from qualified leads it is 15–25%. The best inside teams pair fast response with a short discovery call that qualifies before scheduling a site visit.
Remote and digital sales
Remote solar sales grew quickly in the early 2020s and remain important for cost control. The close rate is usually lower than in-person sales because the rep cannot read the room or build physical rapport. However, remote teams can handle more volume and lower travel cost.
Remote teams that use screen-shared 3D proposals, live financing adjustments, and digital e-sign close at rates approaching in-person teams. The key is to make the remote meeting feel as interactive as a kitchen-table conversation. If the rep simply emails a PDF and waits, the close rate collapses.
For sales managers, the takeaway is to benchmark close rate within the same motion. Comparing a D2D appointment-to-close rate to an inside sales lead-to-close rate is comparing two different metrics.
Why Your Solar Close Rate Looks Lower Than It Is
Before you launch a sales training program, check whether the number you are chasing is real. Four measurement mistakes make close rates look worse than actual performance.
1. The denominator includes junk
Every form fill, chatbot click, and webinar attendee does not deserve equal weight. If your CRM counts all of them as leads, your close rate will look tiny even when your reps are doing fine. Define a lead as a contact with enough information to attempt outreach: name, phone or email, service area, and property type.
2. Stale opportunities never get closed out
Most CRMs keep opportunities open indefinitely. A deal that has not moved in 90 days still sits in the denominator until someone marks it lost. Cleaning stale opps often raises close rate immediately without changing anything else.
3. Lead-source mix shifts the average
Inbound leads from your website convert at roughly 2–5x the rate of cold outbound or shared leads. If you double paid social spend while organic stays flat, your blended close rate drops even if every channel performs exactly as before. Track close rate by source, not just in aggregate.
4. Disqualified leads are counted as losses
A lead that is not a homeowner, not in your service area, or not the decision-maker was never going to close. Counting these as closed-lost makes your close rate look artificially low and hides the real conversion problem. Track disqualified as its own bucket.
Fixing measurement is not exciting, but it is cheap. It also prevents you from coaching reps on a problem they did not create.
The Five Levers That Move Solar Close Rates
Once measurement is clean, four operational levers usually explain the gap between average and top-quartile teams. A fifth lever, financing clarity, has become more important as buyers face higher interest rates and incentive uncertainty in 2026.
1. Speed-to-lead
Leads decay fast. Velocify analyzed roughly 3.5 million leads and found that responding within one minute boosts conversion rates by 391% compared to waiting 30 minutes. Other studies put the first-responder advantage at roughly 78% of buyers choosing the company that contacts them first.
In solar, this is especially brutal. A homeowner requesting quotes online typically submits to 3–5 installers. The first company to call shapes the conversation. Everyone else chases.
Top teams solve this with structured routing, instant auto-replies, and AI voice or chat assistants for after-hours leads. The goal is not to close on the first call. It is to book the appointment before the prospect moves on.
2. Qualification before pitching
Not every lead deserves a full design and proposal. The fastest way to waste margin is to send a rep to a home with a shaded north-facing roof, a renter who cannot sign, or a buyer six months away from decision.
A short qualification checklist, applied consistently, lifts close rate because it keeps bad-fit prospects out of the denominator. Useful questions include:
- Are you the homeowner?
- What is your average monthly electric bill?
- Is your roof in good condition, or does it need replacement soon?
- Are you looking to purchase, finance, or lease?
- What is your timeline?
Teams that enforce BANT-style qualification before design begins see higher win rates because every proposal goes to a real opportunity. For a deeper look at objection handling once you are in the room, read our guide to solar sales objections.
3. Proposal quality and specificity
Generic proposals invite comparison. Site-specific proposals build trust. The data is consistent across markets: flat 2D layouts close around 19% of the time, while 3D roof renderings with shading analysis close at 31–35%.
Buyers in 2026 have seen more solar quotes than ever. They can spot a copy-paste PDF. A proposal that shows their actual roof, their utility rate, their incentives, and their 25-year savings answers objections before they are raised. SurgePV’s solar proposal software generates these proposals in minutes, not hours, so specificity does not require a slower process. Accurate production and savings numbers come from the same solar design tool the design team uses, which removes the revision loops that delay follow-up.
4. Follow-up discipline
Most solar deals do not close on the first call. The teams that win have a structured follow-up sequence that keeps the proposal alive without becoming annoying.
A proven 14-day cadence looks like this:
- Day 0: Send the proposal immediately after the appointment.
- Day 1: Text or call to confirm receipt and answer quick questions.
- Day 3: Share a relevant piece of value: an updated savings projection, a local incentive reminder, or a neighbor comparison.
- Day 7: Call to surface objections and offer a financing adjustment.
- Day 14: Send a direct decision prompt: “Are you moving forward, or should I close your file?”
After day 14, move non-responders to a low-frequency nurture sequence. The average solar buyer who does not decide in two weeks is unlikely to decide without a trigger event like a rate hike or incentive deadline. The reps who master the one-meeting close use many of the same tactics laid out in our solar proposal presentation tips.
5. Financing clarity
Confusing financing is one of the biggest silent killers of close rate. Buyers presented with too many options, unclear dealer fees, or mismatched loan terms stall. Reps who lead with the monthly bill comparison, not the total system price, remove sticker shock before it starts.
Present two or three clear options: cash, loan, and lease or PPA where available. Keep the system size constant so the decision is about payment structure, not scope. Show the monthly utility payment next to the projected solar payment. When the buyer sees a lower number from day one, the rest of the conversation is about details.
How to Improve Solar Close Rate: A 90-Day Playbook
Close rate is a process metric, so it improves through process changes. Here is a practical 90-day sequence that most teams can run without adding headcount.
Weeks 1–2: Fix the denominator
- Define what counts as a lead in your CRM.
- Close out all opportunities older than 90 days with no activity.
- Create a separate “disqualified” reason for bad-fit contacts.
- Build a dashboard that shows close rate by lead source and funnel stage.
Weeks 3–4: Compress response time
- Set a team target of first contact within 5 minutes during business hours.
- Add an auto-reply SMS or email that confirms the quote request and sets expectations.
- Route after-hours leads to an AI assistant or on-call rep.
- Track average response time by rep and by source.
Weeks 5–6: Upgrade proposals
- Move from text-based or flat PDF quotes to 3D roof renderings.
- Add shading analysis and production modeling to every proposal.
- Include a side-by-side financing comparison.
- Train reps to present the proposal live rather than emailing it and hoping.
Weeks 7–10: Build the follow-up machine
- Write a 14-day follow-up sequence with specific messages for each touch.
- Load the sequence into your CRM or sales platform.
- Require reps to log the outcome of every follow-up attempt.
- Hold a weekly pipeline review focused on proposals sent but not closed.
Weeks 11–12: Measure and iterate
- Compare close rate, win rate, and cost-per-close by source.
- Identify the top two leak points in the funnel.
- Run a small experiment: one new script, one new proposal template, or one follow-up channel.
- Lock in what works and cut what does not.
Teams that execute this sequence consistently often see a 10–15 point lift in proposal-to-close rate within one quarter. The gains compound because the same lead volume produces more signed contracts.
What Most Solar Sales Teams Get Wrong
The most common misconception in solar sales is that close rate measures how good your reps are at closing. It does not. It measures how well your entire funnel converts from first touch to signed contract.
A team with charismatic reps but slow response times, weak proposals, and no follow-up will lose to a team with average reps and a tight process. The data supports this. The spread between top-quartile and average installers is explained mostly by process variables, not talent variables.
This means training budgets are often misallocated. If your win rate on qualified opportunities is already healthy, sending reps to another objection-handling seminar will not move the needle. The fix is upstream: cleaner data, faster response, better proposals, and disciplined follow-up.
The exception is when both win rate and close rate are weak. Then you have a dual problem: poor lead quality and poor execution. Fix measurement and qualification first, then coach the deal skills.
Solar Close Rate and CAC: The Math Every Manager Should Know
Raising close rate is the fastest way to lower customer acquisition cost. Here is a simple example.
Assume an 8 kW residential system priced at $3.00 per watt. That is a $24,000 contract. Your all-in customer acquisition cost is $0.84 per watt, or $6,720 per deal, based on the Wood Mackenzie 2026 projection.
If you close 10% of qualified leads, your effective cost per qualified lead is $672. If you raise close rate to 20% without changing marketing spend, your cost per qualified lead drops to $336. The same marketing dollars produce twice as many customers.
On a single deal, a 10-point close-rate improvement on an 8 kW job recovers roughly $672 in acquisition cost. Across 100 deals per year, that is $67,200 in saved or redeployed marketing spend. The calculation does not require new hardware, new territories, or new incentives. It only requires a better conversion process.
That is why close rate deserves a seat next to revenue and gross margin on every sales dashboard.
Close rate and seasonality
Close rate is not static. It typically rises in Q1 and Q4 when buyers are motivated by tax deadlines or rate-lock fears. It dips in mid-summer when prospects are distracted and sales teams are stretched across peak installation volume. Compare your current close rate to the same period last year, not to a generic annual average.
A 30-day rolling close rate is too noisy for strategic decisions. A 90-day rolling rate smooths out random variance and shows real trends. Review it monthly, but judge performance quarterly.
Tools That Raise Solar Close Rates
Process improvements stick when the tooling supports them. The most useful platforms for solar sales in 2026 combine three functions in one workflow:
- Design and shading analysis so proposals are site-specific and accurate.
- Proposal generation so reps can build and present quotes quickly.
- CRM and follow-up automation so no lead goes cold between touches.
When these tools are separate, reps waste time re-entering data, proposals sit in inboxes, and follow-up falls through the cracks. When they are connected, the same rep can respond faster, present better, and follow up consistently.
SurgePV combines solar design, proposal generation, and CRM functions so sales and design teams work from the same project record. Proposals pull directly from the site model, financing options update automatically, and follow-up tasks sync to the rep’s pipeline. Sales managers get visibility into every stage without chasing spreadsheets. For sales teams, that means fewer handoffs and more signed contracts.
The energy and financial modeling tool is where the close-rate math becomes real. It models production, savings, payback, and financing scenarios using site-specific inputs. When a rep can show the buyer exactly how the system performs on their roof, price stops being an objection and becomes a line item in a financial analysis.
Installers focused on sales-team performance should also look at SurgePV for solar sales professionals. It includes workflows built around the exact stages this guide covers: fast response, accurate design, compelling proposals, and disciplined follow-up.
Mobile access is another factor that is easy to overlook. Reps in the field need to check lead status, update proposals, and log follow-up from their phones. A platform that forces them back to a desktop between appointments creates delays that directly lower close rate. The same applies to sales managers reviewing pipeline health during travel or after hours.
In India, where PM Surya Ghar subsidy calculations and WhatsApp follow-up are central to the sales process, QuickEstimate offers a mobile-first CRM and proposal generator built for local installer workflows. It is a relevant companion for Indian EPCs that want to connect subsidy-aware proposals with automated follow-up.
Close More of the Leads You Already Have
SurgePV connects design, proposal, and CRM workflows so sales teams respond faster, present site-specific proposals, and follow up without leads going cold.
Book a DemoNo commitment required · 20 minutes · Live project walkthrough
Frequently Asked Questions
What is a good solar close rate in 2026?
A good solar close rate is 15–25% of qualified leads for residential installers and 20–30% for door-to-door teams. Top-quartile teams hit 25–35% by combining fast response times, site-specific 3D proposals, and structured follow-up. The industry average from raw leads is much lower, usually 3–5%, because the denominator includes unqualified contacts.
How do you calculate solar close rate?
Solar close rate equals closed-won deals divided by total leads, multiplied by 100. The formula is simple, but the denominator matters. Count only leads that entered your pipeline, not website visitors. Track close rate separately for each lead source and funnel stage for useful comparisons.
What is the difference between solar close rate and solar win rate?
Solar close rate measures closed deals against all leads. Solar win rate measures closed deals against qualified opportunities only. A team with a 5% close rate and a 35% win rate does not have a closing problem; it has a lead-quality or qualification problem.
Which lead source has the highest solar close rate?
Referrals and partner-driven programs close highest. Industry data shows referrals close near 37.5% of booked appointments, local solarize campaigns near 33%, and radio-driven leads near 30%. Paid social and shared third-party leads usually close lower because intent is weaker and competition is higher.
How does proposal speed affect solar close rate?
Proposal speed is one of the strongest levers. Installers who respond to leads within 30 minutes convert up to 62% more often than those who take hours. Reps who deliver a tailored proposal during the first visit close 15–25 percentage points higher than reps who delay quoting.
How does proposal quality affect solar close rate?
Quality matters as much as speed. Flat 2D proposals close around 19% of the time, while 3D proposals with shading simulation close at 31–35%. Interactive proposals that let the buyer adjust financing terms and system size keep engagement high and reduce the need to think it over.
What is the fastest way to improve solar close rate?
Audit your proposal-to-close stage first. Most teams lose more deals after sending a proposal than at any other stage. Fix response time, standardize a 14-day follow-up cadence, and use site-specific 3D proposals. These three changes alone often raise close rates by 10–15 percentage points within one quarter.
Can solar CRM integrations improve close rates?
Yes. CRM integrations keep lead data, design files, proposals, and follow-up tasks in one place. That removes the version-control and re-entry errors that delay follow-up. Teams using connected design-to-CRM workflows respond faster and rarely let proposals go cold.
Conclusion: Three Actions to Take This Week
Solar close rate is not a mystery. It is a measure of how well your entire funnel converts, and it responds to deliberate process changes.
- Clean your measurement. Define what counts as a lead, close stale opportunities, and segment close rate by lead source and funnel stage. You cannot improve a number you do not trust.
- Audit the proposal-to-close stage. That is where most installers leak revenue. Check your average response time, proposal quality, and follow-up cadence against the benchmarks in this guide.
- Run a 90-day playbook. Fix the denominator in two weeks, compress response time in two weeks, upgrade proposals in two weeks, and build follow-up discipline for the remaining month. Measure the result and iterate.
The installers winning in 2026 are not spending more on leads. They are closing more of the leads they already have.
Where this fits
This article is part of SurgePV's Solar Sales & Proposals hub, which works through the topic from first principles to the decisions a project team actually has to make.


