Quick Answer
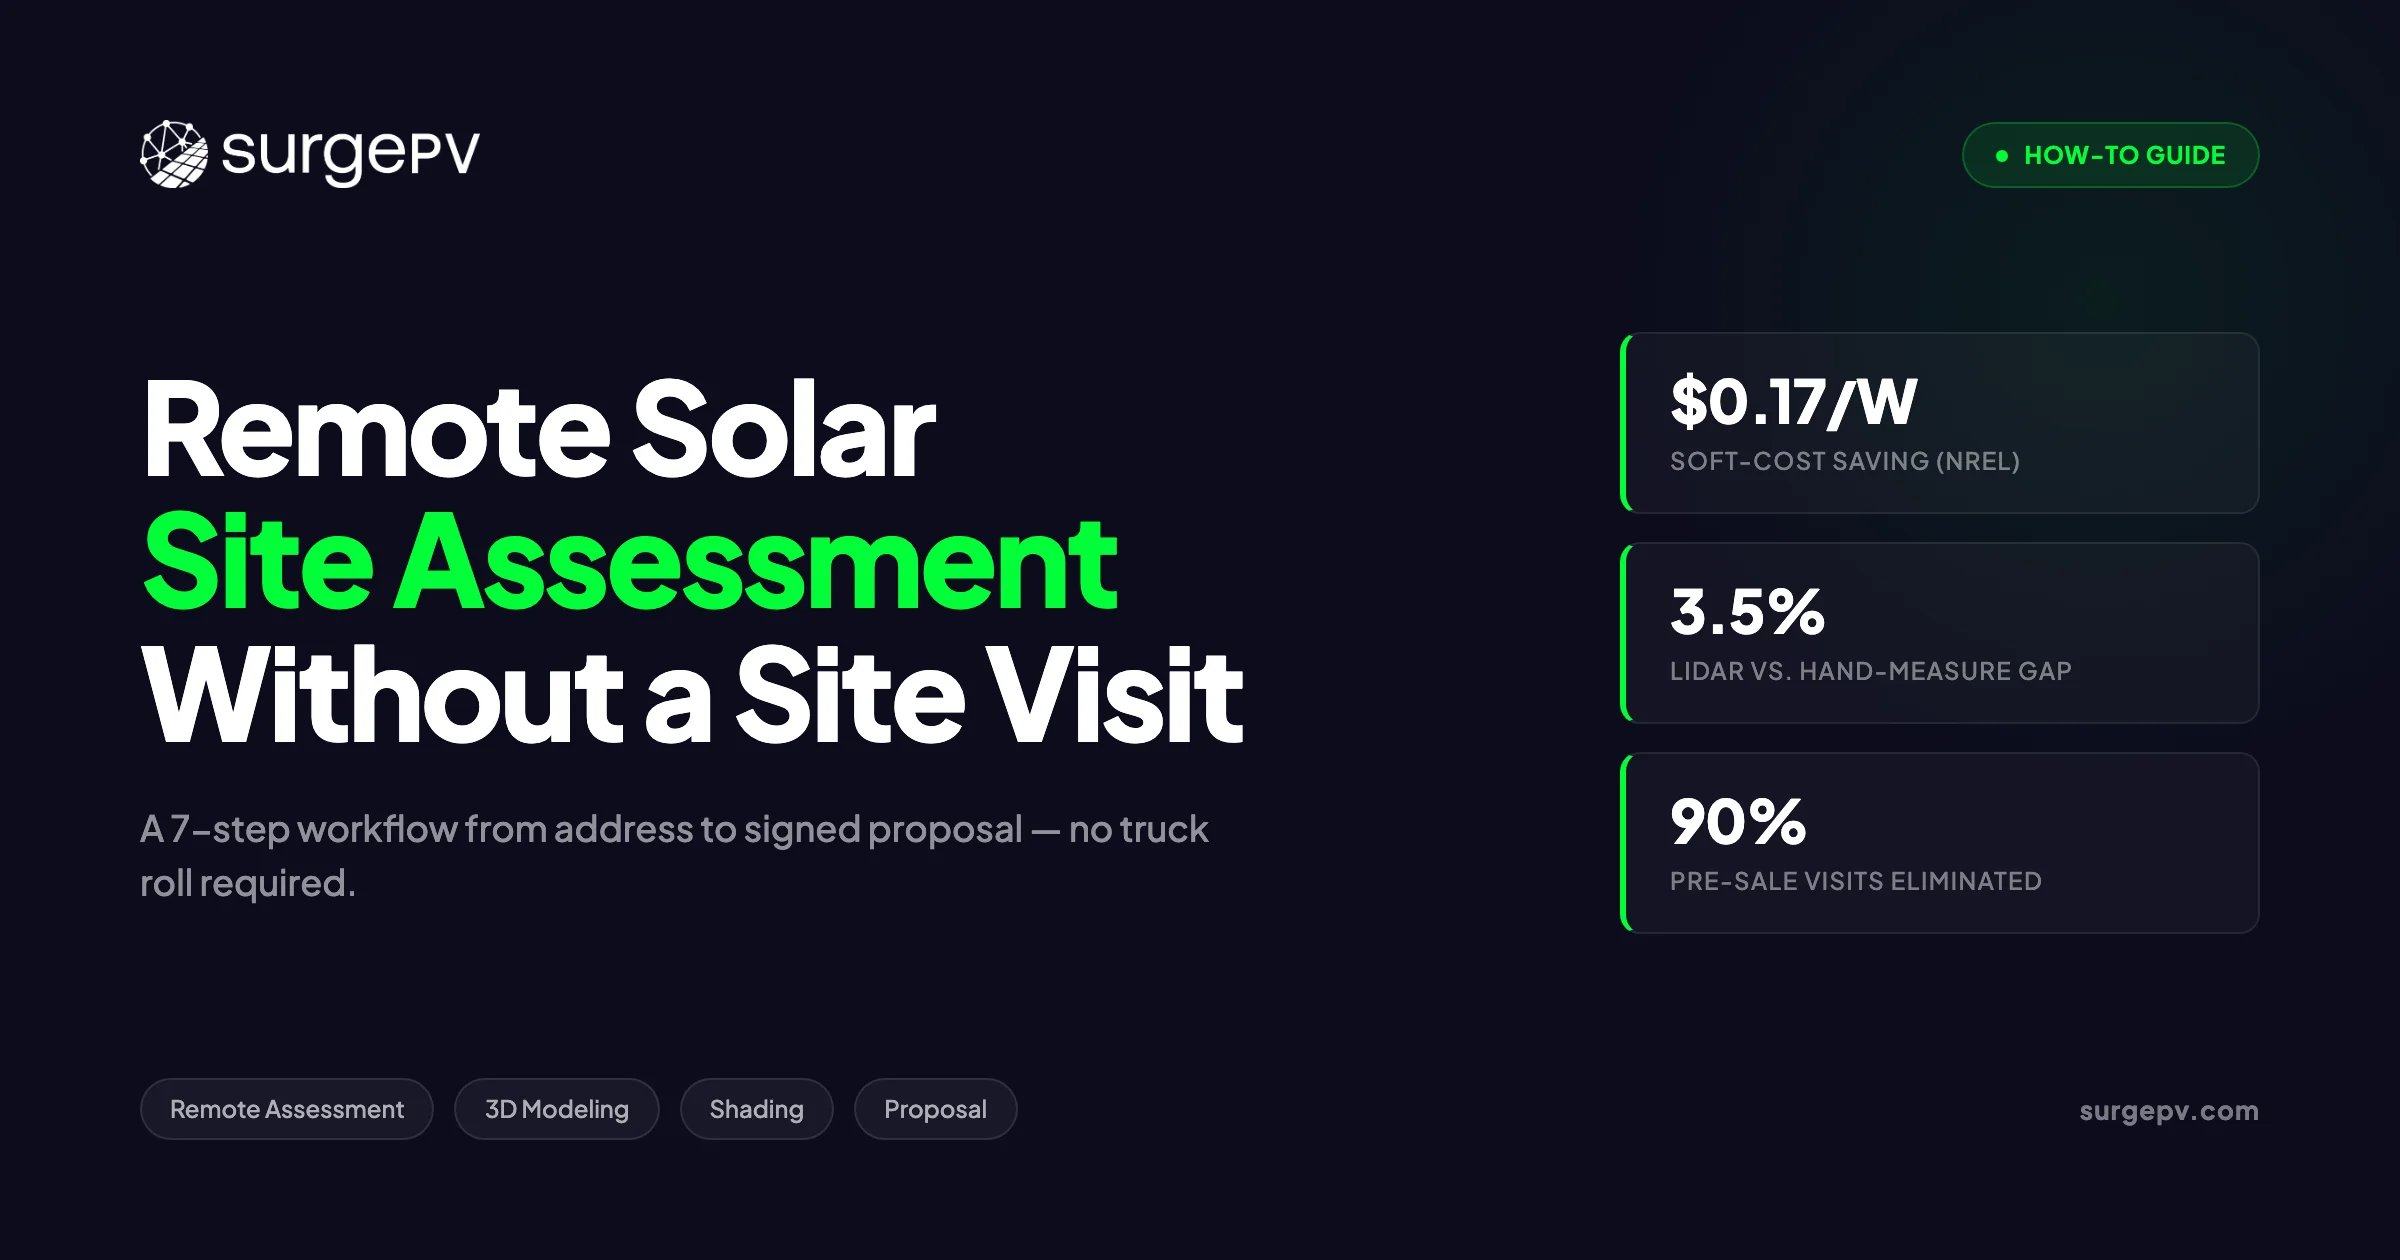
Remote solar site assessment has matured from a stopgap into a standard workflow. The accuracy gap with in-person measurement has closed to within 3.5% for most sites. NREL data puts the soft-cost saving near $0.17/W (NREL via Solar Builder). Industry-observed range: $150 to $400 per visit (labor + vehicle) Who runs it.
Every truck roll that doesn’t convert to a sale costs your company money. Site surveys represent one of the largest single line items in solar soft costs, which already account for roughly 55% of a typical US residential install price (US DOE via Solar.com). NREL data puts the savings from eliminating unnecessary physical visits at $0.17/W — that’s about $850 on a standard 5 kW residential project — and the number compounds fast when you’re running 10 to 20 leads a week.
Remote solar site assessment has matured from a stopgap into a standard workflow. The accuracy gap with in-person measurement has closed to within 3.5% for most sites. NREL data puts the soft-cost saving near $0.17/W (NREL via Solar Builder).
Remote solar site assessment has matured from a stopgap into a standard workflow. LIDAR coverage now reaches 98.6% of US buildings (Aurora Solar), Google’s Solar API indexes 320 million buildings across 40 countries, and physics-based shading engines can process a full rooftop in under 15 minutes (EnergySage). The accuracy gap with in-person measurement has closed to within 3.5% for most sites. The tools are there; the question is whether your workflow uses them end-to-end. For software options, see 7 Best Aurora Solar Alternatives in.
This guide gives you a step-by-step process — from the first address lookup to a signed proposal — without leaving the office. We cover data source accuracy, the exact scenarios where a site visit is still non-negotiable, and how to quantify the savings for management or clients.
TL;DR
A remote solar site assessment uses satellite imagery, LIDAR, and cloud design software to take a project from address to installer-grade proposal in under an hour. NREL data puts the soft-cost saving at $0.17/W — roughly $850 on a typical 5 kW residential install. This guide covers every step of that workflow.
In this guide you will find:
- The 7-step remote workflow from intake to signed proposal
- Which data sources are accurate enough for installer-grade design
- A decision matrix: when remote-only is sufficient vs. when a site visit is non-negotiable
- How residential and C&I remote workflows differ
- The exact soft-cost savings you can quantify for management or clients
- Which tools cover each stage of the workflow
- How to deliver a branded proposal without leaving the office
What Is a Remote Solar Site Assessment?
A remote solar site assessment uses satellite imagery, LIDAR data, and cloud design software to evaluate a property’s solar potential without an on-site visit. The workflow covers 7 steps — intake, imagery, 3D modeling, shading, irradiance, financial model, and proposal — and can deliver an installer-grade design in under an hour. NREL data puts the soft-cost saving near $0.17/W (NREL via Solar Builder).
The distinction from a traditional survey is not just speed. A remote assessment is done at a desk by a designer or sales engineer before any commitment is made. A traditional site visit requires a technician, a vehicle, travel time, and scheduling coordination with the homeowner — costs that accumulate whether the deal closes or not.
| Factor | Remote Assessment | Traditional Site Visit |
|---|---|---|
| Data collected | Roof geometry, LIDAR, shading, irradiance, imagery | Same + physical inspection, photos, panel condition |
| Time | 45 to 60 min (residential) | 90 to 180 min (travel + survey + travel) |
| Cost | Near zero marginal cost | Industry-observed range: $150 to $400 per visit (labor + vehicle) |
| Who runs it | Designer or sales engineer (remote) | Field technician or installer |
| Output | 3D model, shading report, financial model, proposal | Same + site photos, structural notes |
Soft costs — permitting, customer acquisition, inspection, and site assessment — represent approximately 55% of a US residential install price (US DOE via Solar.com). Cutting pre-sale truck rolls removes one of the most controllable cost drivers in that figure. The $0.17/W saving from NREL translates to $850 on a 5 kW install and scales linearly: a 50 kW C&I system saves roughly $8,500 under the same assumption.
Good solar design software makes the remote workflow practical by integrating the data sources, modeling, and proposal generation in one platform — so the designer never re-enters data between steps.
When Remote-Only Is Enough (and When It Isn’t)
Remote assessment is not a universal substitute for physical inspection. The decision depends on roof complexity, LIDAR coverage, building age, and obstruction density. The table below gives a direct answer for the most common scenarios.
| Scenario | Remote sufficient? | Risk if remote-only | Recommended action |
|---|---|---|---|
| Standard pitched residential roof | Yes | Low | Full remote workflow |
| Flat C&I rooftop under 1 MW | Yes, with caveats | Medium | Supplement with drone for parapets and rooftop equipment |
| Ground-mount utility-scale | Partial | Medium | Remote for irradiance; site visit for soils, grading, access |
| Complex multi-roof with abutting obstructions | No | High | Physical visit to verify obstruction heights |
| Heritage or listed building | No | High | Visit + permit consultation before any design |
| Unknown roof condition, older than 25 years | No | High | Structural inspection before design |
| Site outside LIDAR coverage | Yes, with caveats | Medium | Drone fill-in (~8 min capture per EnergySage) |
For most residential projects in the US, the data is good enough. LIDAR-derived measurements match hand measurements within 3.5% (NREL via EnergySage), and US LIDAR coverage has reached 98.6% of buildings at 9.2 to 12.8 points per square meter (Aurora Solar). That density is sufficient for accurate pitch, azimuth, and setback calculations.
4 Cases Where Remote-Only Fails
1. Sites outside LIDAR coverage with no drone alternative. 2. Roof age unknown or over 25 years — structural load capacity must be physically verified. 3. Heritage or listed structures where permits require physical inspection. 4. Dense obstructions partially occluded in aerial imagery, where shading models cannot calculate accurate height.
The solar shadow analysis software you use matters here. A physics-based shading engine running on a LIDAR-derived 3D model handles the vast majority of residential scenarios accurately. Where imagery gaps or obstruction ambiguity exist, a drone fill-in closes most remaining cases before committing to a physical visit.
The 7-Step Remote Solar Site Assessment Workflow
Step 1 — Intake and Address Validation
A clean intake eliminates the most common source of rework: missing or incorrect site data. Run through this checklist before opening any design tool.
Residential intake checklist:
- Full street address including unit number (if applicable)
- Utility provider and current monthly bill (for tariff mapping)
- Average monthly consumption in kWh
- Desired system size or monthly bill offset target
- Roof age and material (if known by owner)
- Any known obstructions: chimneys, skylights, dormer windows, trees
- HOA restrictions or aesthetic requirements
- Preferred financing type: cash, loan, or PPA
Additional items for C&I projects:
- Peak demand in kVA from the most recent 12 months of bills
- Load profile (hourly if available, or interval data from the utility)
- Grid connection voltage and available capacity
- Whether battery storage or EV charging is in scope
Pro Tip
A single standardised intake form — sent by SMS or email before the first call — cuts back-and-forth by several rounds and means Steps 1 and 2 take 10 minutes or less. The form data flows directly into the financial model without re-entry.
Step 2 — Satellite Imagery and Roof Geometry
With a validated address, pull the base imagery and roof geometry data. Two primary sources cover the majority of projects.
Google Solar API indexes 320 million buildings across 40 countries (Google Maps Platform Solar API docs) and provides roof segment orientation, pitch, and annual sun hours per segment at no per-query cost for qualifying volumes. It is the fastest starting point for residential feasibility.
LIDAR-derived geometry is more precise. Measurements derived from LIDAR point clouds match hand measurements within 3.5% (NREL via EnergySage), and at 9+ points per square meter, pitch and azimuth accuracy is sufficient for string sizing and production modeling. For sites outside existing LIDAR coverage, a drone capture takes approximately 8 minutes and produces a point cloud at comparable resolution (EnergySage). For a deeper look at drone-based capture, see our solar drone site survey guide.
For residential projects, the Google Solar API or LIDAR data alone is typically enough to proceed to Step 3. For C&I flat roofs, verify parapet heights and rooftop equipment placement — these are frequently misrepresented or absent in aerial imagery and create shading errors downstream.
Step 3 — 3D Roof Model and Module Layout
With geometry in hand, build the 3D model and run the module layout. This is where design decisions get made: setbacks, row spacing, string configuration, and BOM.
SurgePV’s solar design software handles this end-to-end. The workflow runs as follows:
- Enter the address to pull the roof geometry and generate the 3D model automatically
- Apply local setback rules (jurisdiction-specific or manual override)
- Place modules, respecting setbacks and roof obstructions
- Run string sizing against the inverter’s MPPT voltage window and short-circuit current limits
- Generate the preliminary BOM with panel count, inverter count, racking, and wiring lengths For more on this topic, see Solar Racking Design Guide.
For residential pitched roofs, this step typically takes 10 to 15 minutes. The model drives every downstream calculation — shading, irradiance, and financial modeling all reference the same geometry, so errors don’t propagate from one tool to another.
For C&I flat roofs, the step requires manual attention to azimuth (often east-west racking for flat surfaces), inter-row spacing to avoid self-shading, and whether string inverters or microinverters better suit the layout. The BOM on a flat commercial roof is more sensitive to row spacing decisions than a pitched residential roof, so this step takes longer — typically 30 to 45 minutes for a complex layout.
Step 4 — Shading Analysis
Shading is the step most often skipped or approximated in quick-turn assessments, and it is the one that creates the largest production errors. A single shaded cell in a string of 36 can cause greater than 75% power loss across the entire string (EnergySage).
SurgePV’s solar shadow analysis software runs physics-based irradiance and obstruction shading on the cloud-rendered 3D model. The shading report — covering every hour of the year — takes under 15 minutes to generate (EnergySage). The output is a per-module shading loss factor that feeds directly into the yield calculation in Step 5.
The analysis accounts for:
- Near-field obstructions (chimneys, dormers, parapets, rooftop HVAC)
- Far-field obstructions (trees, adjacent buildings) derived from LIDAR heights
- Self-shading between rows on flat and low-pitch roofs
- Horizon profile shading for sites in valleys or with tall adjacent structures
Pro Tip
Always run the winter solstice scenario (December 21 in the northern hemisphere) as your worst-case shading check. If the system still meets the client’s minimum offset target at peak shading, every other month will too. This single scenario catches most stringing errors before they reach the proposal.
For C&I projects, run shading analysis for both east-west and south-facing configurations if the roof pitch is under 5°. Inter-row shading on flat commercial roofs is frequently the largest production penalty, and it is invisible unless explicitly modeled.
Step 5 — Irradiance and Yield Estimation
Shading losses are applied on top of the base irradiance dataset. The irradiance dataset you choose affects production estimate accuracy — and the right choice depends on use case.
| Dataset | Grid Resolution | Period Covered | Best Use |
|---|---|---|---|
| PVGIS-NSRDB | 0.04° × 0.04° (~4 km) | 2005 to 2015 | EU projects, residential feasibility (EU JRC) |
| NSRDB | 4 × 4 km, hourly / half-hourly | 2005 to 2023 | US projects, most residential and C&I (NREL) |
| Solargis | 1 to 2 km, half-hourly | 2007 to 2021 | C&I and utility; bankable-grade P50/P90 (Solargis) |
The yield calculation produces 3 key outputs:
- Annual yield in kWh/year — the number that maps to the client’s bill offset
- Specific yield in kWh/kWp — a normalised performance indicator useful for comparing sites or benchmarking against regional averages
- Performance ratio — actual yield divided by theoretical maximum, typically 0.75 to 0.85 for a well-designed residential system
For residential projects, NSRDB or PVGIS is accurate enough for a final installer-grade estimate. For C&I projects above roughly 100 kW where project finance is involved, use Solargis P50 and P90 scenarios — lenders and equity investors require bankable irradiance data with stated exceedance probabilities.
Step 6 — Financial Model
With yield confirmed, the financial model turns kWh into a business case. The inputs are straightforward; the discipline is in using accurate local data rather than national averages.
Standard inputs:
- System cost in $/W (or total installed cost)
- Annual yield from Step 5
- Local utility tariff (time-of-use or flat, with escalation rate)
- State and local incentives (net metering, SREC markets, utility rebates — note: the federal residential ITC is no longer available for homeowners as of 2026)
- Annual degradation rate (typically 0.5%/year for monocrystalline)
Outputs:
- Simple payback period (years)
- Internal rate of return (IRR)
- Net present value (NPV) at a stated discount rate
- 25-year cumulative savings
SurgePV’s generation and financial tool handles all of these in one session, with the yield data from Step 5 flowing in directly. No spreadsheet export required.
Pro Tip
Run both P50 and P90 irradiance scenarios and present both payback figures. P50 is the expected case; P90 is the conservative case. Showing both demonstrates analytical rigor and pre-empts the client’s “but what if it underperforms?” objection before it surfaces.
For C&I clients, add a demand-charge savings line. Commercial customers on demand-tariff structures often recover a meaningful share of system value from demand reduction alone — leaving it out understates the business case.
Step 7 — Branded Proposal Delivery
The proposal is the output the client sees. Everything from Steps 1 through 6 exists to make this document credible, accurate, and fast to produce.
SurgePV’s solar proposal software generates a branded PDF proposal directly from the design and financial model data. No reformatting, no copy-paste from spreadsheets. Clara AI can draft the narrative sections — system description, performance summary, and next-steps copy — in the same session.
The business impact of speed here is real. Solarponics reduced pre-sale site visits by 90% after switching to a remote-first workflow and doubled installations in the same period (Solar Builder). A significant part of that gain comes from closing in the same conversation — sending a professional proposal while the client is still engaged, not 3 days later after a site visit that may or may not have happened.
Pro Tip
Send the proposal during the same call window where you walk the client through the shading and financial results. Close rates drop sharply when there is a multi-day gap between the conversation and the document — the client has time to shop competitors.
The proposal should include: system specs (kWp, panel count, inverter), annual yield and monthly offset, financial summary (payback, IRR, 25-year savings), shading loss summary, and a clear next-step call to action. Keep it under 10 pages for residential; C&I proposals may run longer with appendices for the financial model assumptions.
Residential vs. C&I Remote Assessments
The 7-step workflow applies to both residential and C&I projects, but the data sources, modeling complexity, and deliverable format differ in important ways.
| Factor | Residential | C&I |
|---|---|---|
| Typical system size | 5 to 15 kW | 50 kW to 5 MW |
| Roof type | Pitched, tile or shingle | Flat or low-pitch, membrane |
| LIDAR availability | High (98.6% US coverage) | High, but parapet gaps common |
| Shading complexity | Low-medium (trees, chimneys) | Medium-high (HVAC, parapets, self-shading) |
| Irradiance dataset | NSRDB / PVGIS sufficient | Solargis P50/P90 for bankable reports |
| Financial model | Payback + 25-year savings | IRR, NPV, demand savings, debt service |
| Proposal format | 5 to 8 page PDF | 10 to 25 page report + financial appendix |
| When site visit needed | Roof age unknown, heritage, dense obstructions | Always for mechanical/structural on rooftop; required for ground-mount |
Bankable Irradiance for Project Finance
C&I projects seeking debt or equity financing require a bankable energy yield assessment using Solargis P50 and P90 scenarios. P50 is the median expected yield; P90 means the system is expected to exceed that yield 90% of the time. Lenders typically size debt service coverage against the P90 figure.
The solar software stack for C&I projects also needs to handle multi-meter configurations, potential battery storage integration, and in some markets, export limitation agreements with the grid operator. These add scope to the financial model but do not fundamentally change the 7-step workflow — they are additional inputs at Steps 1, 5, and 6. See Adding Battery Storage Services for detailed guidance.
Tool Stack for a Remote Solar Assessment
No single category of tool covers every step. The table below maps the workflow stages to tool categories and their key limitations.
| Stage | Category | Examples | Key Data | Limitation |
|---|---|---|---|---|
| Step 1 — Intake | CRM / form | HubSpot, Zoho, custom form | Customer + site data | Only as good as what the client provides |
| Step 2 — Imagery | Satellite / LIDAR provider | Google Solar API, Nearmap, EagleView | Roof geometry, point cloud | Stale imagery; parapet gaps in aerial data |
| Step 3 — 3D Modeling | Solar design platform | SurgePV, Helioscope, Aurora | Module layout, string config, BOM | Manual effort on complex C&I roofs |
| Step 4 — Shading | Physics-based engine | SurgePV, Aurora, PVSyst | Per-module shading loss | Occluded obstructions in imagery; tree height errors |
| Step 5 — Irradiance | Weather dataset | NSRDB, PVGIS, Solargis | kWh/m²/year, TMY | Microclimate gaps; resolution limits in mountain terrain |
| Step 6 — Financial | Financial modeling | SurgePV, EnergyToolbase | Payback, IRR, NPV | Tariff accuracy depends on manual input |
| Step 7 — Proposal | Proposal platform | SurgePV, Pitch, custom PDF | Branded output | Template quality varies by platform |
Helioscope’s LIDAR coverage reaches 98.6% of US buildings at 9.2 to 12.8 points per square meter (Aurora Solar) — enough density for accurate pitch, azimuth, and ridge-line extraction. Lower-density datasets require more manual correction during the modeling step.
An integrated platform handles Steps 3 through 7 in a single session. SurgePV’s solar design software covers 3D modeling, module layout, and string sizing; shadow analysis runs the physics-based shading engine; the generation and financial tool produces the yield and financial outputs; and proposal generation delivers the branded PDF. Clara AI handles the narrative copy. The efficiency gain over a fragmented tool stack is real — no data re-entry, no format mismatches, and no version control issues between the design and the proposal.
How Much Does a Remote Assessment Save?
The savings are measurable and attributable. Here is the summary in one table, followed by the logic behind each figure.
| Metric | Value | Source |
|---|---|---|
| Soft-cost saving per watt | $0.17/W | NREL via Solar Builder |
| Saving on a 5 kW residential install | ~$850 | NREL (direct calculation) |
| Saving on a 50 kW C&I install | ~$8,500 | Extrapolation from NREL $0.17/W figure |
| Pre-sale site visit reduction | 90% | Solarponics via Solar Builder |
| Soft costs as share of total install | ~55% | US DOE via Solar.com |
The saving comes from 3 places. First, the eliminated truck roll itself — fuel, labor time, and vehicle wear on a visit that may not convert. Second, faster proposal turnaround tends to improve close rates because the client never has time to shop competitors. Third, the remote workflow lets one designer handle 3 to 4 times as many leads per day as a field-first model, so overhead per deal drops even if the per-unit saving looks modest.
Pro Tip
Pass part of the saving to the client as a price advantage. If you save $850 per install and share $200 of that with the customer as a discount, you win on price without cutting margin — and the remaining $650 goes straight to profit per job.
Run Your First Remote Assessment in Under an Hour
SurgePV covers 3D modeling, shading analysis, financial modeling, and branded proposals — one platform, no truck roll.
Book a DemoNo commitment required · 20 minutes · Live project walkthrough
Common Mistakes That Kill Remote Assessment Accuracy
Even with good tools, these 5 errors show up repeatedly and degrade output quality.
1. Trusting stale satellite imagery. Imagery older than 2 years may not reflect a roof replacement, a new HVAC unit, or a tree that has grown 5 meters. Always check the capture date in the imagery metadata before accepting the geometry. If the date is over 24 months old, flag it in the proposal or request a drone update.
2. Skipping the winter solstice shading run. The standard annual shading simulation averages out the worst months. The December 21 scenario reveals stringing problems — shaded cells that drag down an entire string — that are invisible in the annual average. Run it on every project before finalising string configuration.
3. Trusting a single irradiance source. Weather datasets disagree in complex terrain, coastal microclimates, and high-altitude sites. Cross-check at least 2 datasets (e.g., NSRDB and PVGIS for US projects) and flag any discrepancy over 5% in the proposal. For C&I projects, the irradiance source should be stated explicitly in the deliverable.
4. Forgetting roof material and age. The financial model assumes the roof can carry the system for 25 years. A 20-year-old asphalt shingle roof may need replacement in year 5, which means the client pays to remove and reinstall the system — a cost that changes the payback significantly. Ask for roof age and material in the intake form (Step 1) and note it in the proposal assumptions.
5. Skipping the electrical panel check on retrofits. For a retrofit on an existing building, the incoming service capacity and available breaker space determine whether a panel upgrade is needed. A panel upgrade can add several thousand dollars to the project cost — enough to materially change the payback. This should be in the intake form and noted as a site-verified item before final proposal. Also see: Us Residential Solar Market Trends 2026. For United States-specific compliance details, see United States arizona/phoenix. For United States-specific compliance details, see United States california/los-angeles.
Conclusion: 3 Action Items This Week
Remote solar site assessment is not a future capability. The tools, the data coverage, and the proven installer results are all in place now. Here are 3 specific actions to take before the end of the week.
1. Pick one upcoming project and run it remotely end-to-end. Choose a standard pitched residential roof in your pipeline — the kind that would normally require a site visit before design. Run all 7 steps and compare the output to what a field visit would have produced. The accuracy will likely surprise you, and the time saving will be immediate and measurable.
2. Standardise an intake form so Steps 1 and 2 take 10 minutes or less. Map out every data point you currently collect on site visits and build a pre-call form that captures it in advance. Send it by SMS or email as soon as a lead books a consultation. When the call starts, the geometry, consumption, and utility data are already in the system.
3. Calculate your average truck-roll cost, then pass part of the saving to the client. Track fuel, labor hours, and vehicle overhead for your next 10 site visits that don’t close. Average that number. Then consider pricing the remote-first assessment as a discount line item in your proposal — it wins on price without reducing your net margin.
Book a 20-minute platform walkthrough to see the full 7-step workflow run live against a real address.
Ready to Cut Truck Rolls?
Book a 20-minute walkthrough and see the full remote assessment workflow live — from address lookup to signed proposal.
Frequently Asked Questions
What is a remote solar site assessment?
A remote solar site assessment evaluates a property’s solar potential using satellite imagery, LIDAR, and cloud design software — without an on-site visit. The output includes roof geometry, shading losses, system yield, financial projections, and a client proposal, typically completed in under an hour.
How accurate is a remote solar site survey compared to an in-person one?
LIDAR-derived measurements match hand measurements within 3.5% (NREL via EnergySage) for most sites. Physics-based shading analysis on a 3D model is accurate enough for installer-grade design on the majority of residential and C&I rooftop projects.
Can a solar installer design a system without visiting the site?
Yes, for most projects. Solarponics eliminated 90% of pre-sale site visits after switching to remote tools and doubled installations in the same period (Solar Builder). A physical visit is still needed for unknown roof conditions, dense obstructions, or sites outside LIDAR coverage.
What software do you need for a remote solar assessment?
The core stack covers satellite imagery, LIDAR data, a weather dataset (PVGIS, NSRDB, or Solargis), a 3D design and shading tool, and a financial-plus-proposal platform. An integrated platform covers all stages in one session without data exports between tools.
How long does a remote solar site assessment take?
A standard residential project takes 45 to 60 minutes. C&I projects with multi-roof layouts typically take 90 to 180 minutes.
When is an on-site visit still required?
4 scenarios warrant a physical visit: sites outside LIDAR coverage, unknown roof age or condition, heritage structures requiring physical inspection, and dense obstructions that are partially occluded in aerial imagery.
Is the Google Solar API accurate enough for installer-grade design?
For early-stage feasibility and sales proposals, yes — it covers 320 million buildings across 40 countries. For final system design with precise string sizing and shading loss calculations, a physics-based 3D model from LIDAR at 9+ pts/m² is more reliable.