

Quick Answer
A profitable solar EPC runs on 4 disciplines: gross margin above 20% on every job, design-to-proposal turnaround under 48 hours, subcontractor and procurement cost control, and weekly cash-flow tracking. Most EPCs fail on pricing discipline and rework, not on sales volume.
The solar EPC business has a cruel asymmetry: revenue is easy to grow and profit is easy to lose. The US installed a record volume of solar in 2024 — over 30 GWdc according to the SEIA/Wood Mackenzie Solar Market Insight report (2025) — yet installer bankruptcies kept pace. Demand was never the problem. Unit economics were.
We have run EPC operations across residential and C&I segments, through module price crashes, incentive cliffs, and interest-rate shocks. The firms that stay profitable share 4 disciplines, and none of them is “sell more.” This guide covers the full operating model: where margin is made and lost, the cost structure benchmarks to manage against, the operations systems that prevent rework, and the growth sequence that does not bankrupt you.
Quick Answer
A profitable solar EPC runs on 4 disciplines: gross margin above 20% on every job, design-to-proposal turnaround under 48 hours, subcontractor and procurement cost control, and weekly cash-flow tracking. Most EPCs fail on pricing discipline and rework, not on sales volume.
TL;DR — Profitable Solar EPC Benchmarks
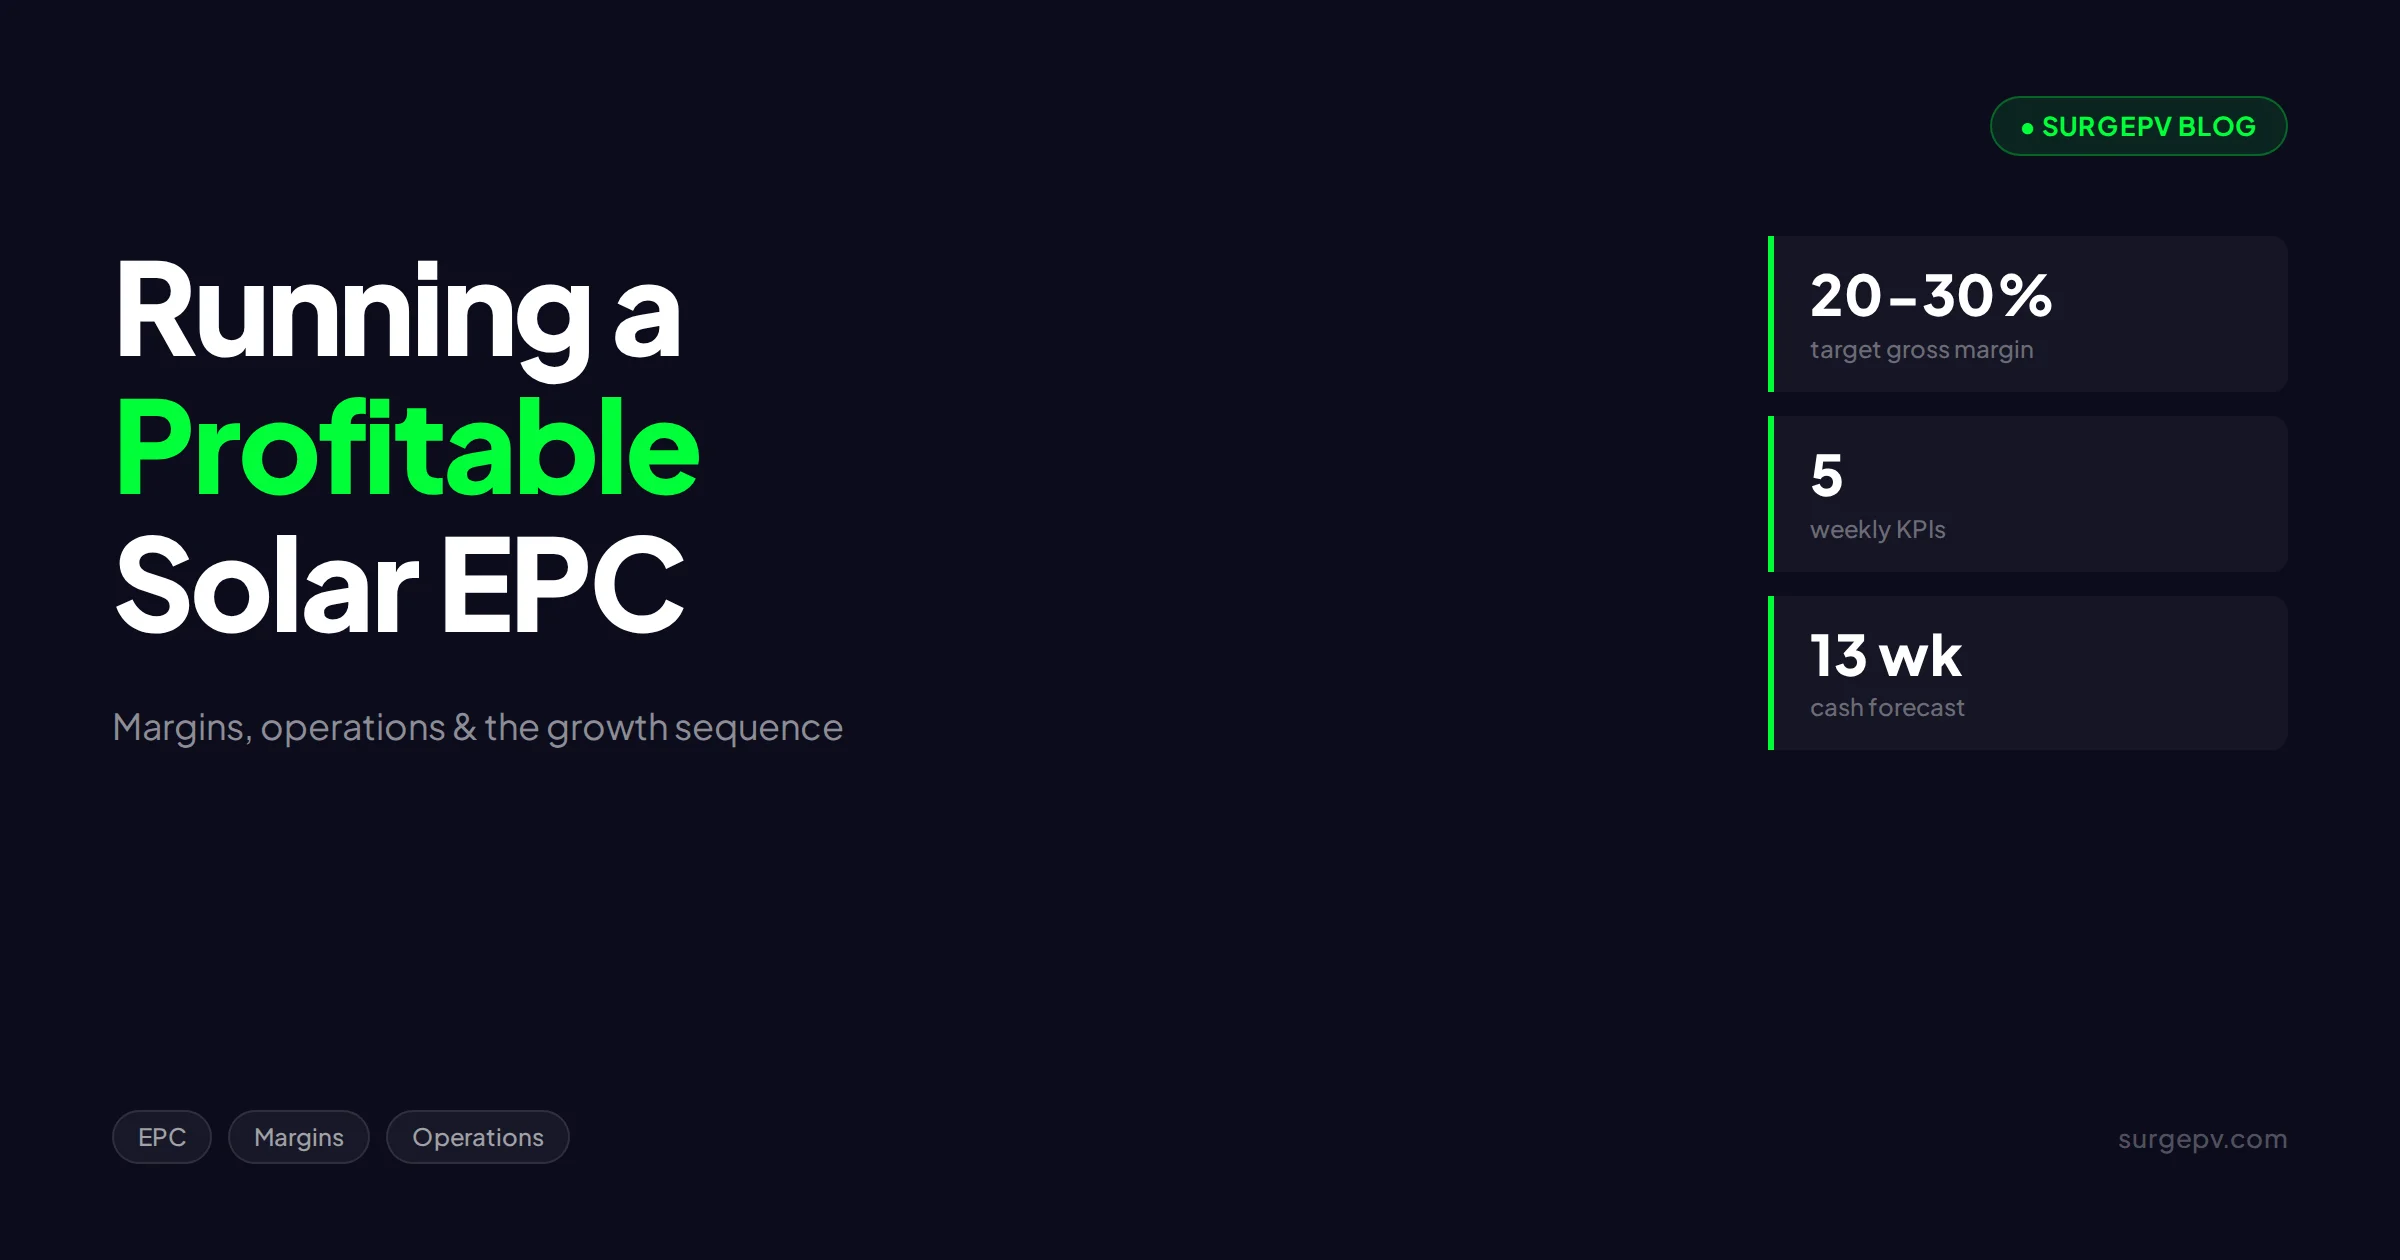
Target 20–30% gross margin (residential), 12–20% (C&I), and 5–10% net. Equipment is 45–60% of project cost; soft costs dominate in mature markets per NREL. Track 5 numbers weekly: gross margin per job, design turnaround, install days per kW, rework rate, and cash conversion cycle.
In this guide:
- The EPC profit model: where money is actually made
- Cost structure benchmarks (equipment, labor, soft costs)
- Pricing discipline and job costing
- The operations stack: design, procurement, install, closeout
- The 5 numbers to track weekly
- Cash flow management for EPCs
- Scaling sequence: what to systematize before you grow
The EPC Profit Model
An EPC earns the spread between the installed price and the total delivered cost of the project. That sounds obvious. The failure mode is that most EPCs know their price precisely and their delivered cost only approximately — and the approximation is always optimistic.
Total delivered cost has 5 layers:
- Equipment — modules, inverters, racking, BOS (balance of system: wiring, disconnects, monitoring hardware).
- Direct labor — install crew hours, electrician time, site supervision.
- Indirect project costs — permits, interconnection fees, engineering stamps, inspections, equipment rental.
- Allocated overhead — sales commissions, design hours, office, insurance, vehicles.
- Risk costs — rework, warranty callbacks, liquidated damages on C&I jobs, price-escalation exposure on long-cycle projects.
Profit is what remains after all 5. EPCs that track only layers 1–2 report phantom margins of 30% and wonder why the bank account disagrees. Job costing must capture all 5 layers per project, or the P&L is fiction.
Cost Structure Benchmarks
Use these industry-observed ranges as a management baseline, then build your own from actual job data. US residential benchmark data from NREL’s installed cost benchmarks (2025) shows the same pattern: hardware share keeps falling, soft costs dominate.
| Cost layer | Residential share | C&I share | Management lever |
|---|---|---|---|
| Equipment | 45–55% | 55–65% | Procurement volume, standardized BOM |
| Direct labor | 10–18% | 8–14% | Crew productivity, design quality |
| Indirect project costs | 8–12% | 5–10% | Permit standardization, AHJ relationships |
| Overhead allocation | 10–15% | 8–12% | Design software, sales efficiency |
| Risk/rework | 2–8% | 3–10% | QA checklists, commissioning rigor |
Two observations matter more than the table. First, soft costs — everything that is not hardware — decide competitiveness in mature markets. Second, rework is the silent margin killer: a 5% rework rate on a 20% gross margin job consumes a quarter of the profit.
Pricing Discipline and Job Costing
The most profitable EPCs we work with share one habit: they walk away from jobs below their margin floor. A floor is a number, not a feeling. Set it from your cost data — for most residential EPCs that is 20% gross margin minimum; for competitive C&I bids, 12–15% with strict scope control.
Job costing needs 3 timestamps: estimate (sold price and expected cost), in-progress (committed POs and logged hours), and closeout (actuals within 30 days of PTO). The estimate-to-actual variance, averaged over the last 20 jobs, is your true pricing accuracy. Healthy firms run within ±3%. If your variance is ±8%, every bid is a coin flip.
Discounting deserves special discipline. A 5% price discount on a 20% margin job cuts profit by 25%. Train sales teams to trade value — faster install dates, better monitoring, extended workmanship warranty — before touching price. Our guide on solar pricing psychology covers the framing side of this.
The Operations Stack
Profit is made in operations, not in the sales meeting. The stack has 4 stages, and each has one metric that predicts margin.
Design. Metric: turnaround time. Designs that take 3+ days stall deals and consume expensive engineering hours. A cloud solar design platform with automated string sizing and shadow analysis cuts residential design time from hours to minutes, which is why design tooling has the fastest payback of any software an EPC buys. Proposal generation belongs in the same workspace — a solar proposal tool that pulls design and financials directly eliminates the re-typing errors that create change orders later.
Procurement. Metric: equipment cost per watt, tracked monthly per SKU. Standardize on 2–3 module SKUs and 2 inverter families. Every additional SKU adds inventory risk, design exceptions, and install-crew confusion. Negotiate on committed quarterly volume, not per-order spot buys.
Installation. Metric: install days per kW. A benchmark residential crew completes a 8–10 kW roof mount in 1–2 days. Deviations almost always trace back to design quality — wrong BOM, missed attic obstruction, unclear layout plan. Fix the design, not the crew.
Closeout. Metric: days from install-complete to PTO (permission to operate). Slow closeout delays final payment and traps working capital. Standardize the inspection packet and the utility application as checklists, and assign one person to own every open PTO.
For teams running Indian projects, the operational loop also includes DISCOM approvals and subsidy documentation — QuickEstimate’s solar CRM guide for Indian EPCs covers that workflow in detail.
The 5 Numbers to Track Weekly
Run the business on a 1-page weekly scorecard:
- Gross margin per closed job (actuals, not estimates).
- Design-to-proposal turnaround (hours, median).
- Install days per kW (per crew).
- Rework rate (jobs needing a return visit ÷ total jobs).
- Cash conversion cycle (days from equipment payment to final customer collection).
Review these every Monday. When one drifts for 2 consecutive weeks, it gets an owner and a countermeasure. This cadence — not annual budgeting — is what separates EPCs that catch margin leaks in April from those that find them in December.
Cut Design Time Across Your Whole Pipeline
SurgePV combines 3D design, shading, financials, and proposals in one workspace — the fastest margin lever an EPC can pull.
Book a DemoNo commitment required · 20 minutes · Live project walkthrough
Cash Flow: The Actual Killer
EPCs die of cash-flow timing, not unprofitability. The mechanics: you pay equipment suppliers in 15–30 days, pay crews weekly, and collect from customers or lenders in stages over 45–120 days. Every growing month, you fund the gap out of pocket.
Four controls keep this survivable:
- Deposit discipline. Collect 10–20% at contract signing, always. A customer who will not pay a deposit will not pay the final invoice either.
- Milestone billing. Bill at equipment delivery, install complete, and PTO — never 100% at the end.
- Supplier terms. Push module suppliers to 45–60 days as volume grows. Terms are negotiable at 500 kW+ per quarter.
- A 13-week cash forecast. One spreadsheet, updated weekly, showing receipts and payments by week. Growth decisions come from this sheet, not from the sales pipeline’s optimism.
The exception that proves the rule: lease/PPA-funded residential work, where a third-party financier pays on install completion. Cash conversion improves dramatically, but margin drops 3–8 points to the financing partner. Trade, not free lunch.
What Most EPCs Get Wrong About Growth
The standard failure sequence: sales double, crews triple, rework quadruples, margin halves, cash runs out. Growth multiplied a broken process.
The correct sequence is systematize first, then grow. Concretely: hold gross margin above 20% for 2 consecutive quarters with documented SOPs for design, install, and closeout — and only then add crews or territories. It feels slow. It is 3 times faster than growing broken and clawing back.
The second misconception is that diversification saves margin. Adding batteries, EV chargers, and roofing to a struggling solar core usually adds 3 immature businesses to 1 struggling one. Attach batteries when battery attach margin exceeds solar margin on a per-crew-day basis — not as a distraction from a broken core.
Scaling Checklist: Systematize Before You Grow
Before adding your next crew or sales rep, confirm these exist in writing and in use:
- Standard design templates and a documented BOM per system type
- A pricing floor with a named approver for exceptions
- Weekly job-cost review with estimate-to-actual variance
- Install QA checklist signed per job (see our solar design QA checklist)
- Milestone billing terms in every contract
- 13-week cash forecast, updated every week
- A single dashboard for the 5 weekly numbers
Missing 2 or more? Fix those first. They are cheaper to build at 20 jobs a month than at 60.
Sales Pipeline and Lead Economics
Operations deliver the margin, but the pipeline decides whether there is margin to deliver. Manage 3 numbers: cost per lead, close rate, and cost per acquired customer.
Industry-observed cost per lead ranges from $25–$75 for digital residential leads in the US and considerably less in India and emerging markets. At a 20% close rate, that is $125–$375 in lead cost per sold job — before sales labor. If your average job carries $3,600 of gross profit (20% on $18,000), lead economics work. At a 10% close rate with $75 leads, you are spending $750 to acquire the same job and the math tightens fast.
The highest-leverage fix is not cheaper leads. It is speed. Responding to a lead within 5 minutes versus 30 minutes changes contact rates dramatically — see the data in our solar lead response time analysis. Same-day proposals, powered by a design tool that does not bottleneck on one engineer, are the operational expression of that speed.
Referrals deserve a system, not good intentions. Ask at PTO, not at install. Pay a concrete referral reward ($200–$500 per signed job is the industry-observed range) and pay it fast. Referral leads close at 2–3 times the rate of purchased leads and carry near-zero acquisition cost.
Segment Economics: Residential vs. C&I
The same EPC discipline produces different economics by segment. Know which game you are playing.
| Dimension | Residential | Commercial & Industrial |
|---|---|---|
| Typical size | 6–12 kW | 100 kW–5 MW |
| Gross margin | 20–30% | 12–20% |
| Sales cycle | 2–8 weeks | 3–9 months |
| Cash profile | Deposits + financing payouts | Milestone billing, retainage |
| Margin risk | Volume of small errors | One bad bid on a big job |
| Skill that wins | Sales speed, install throughput | Engineering quality, bid discipline |
Residential is a throughput business: profit comes from doing many small jobs with near-zero variance. C&I is a selection business: profit comes from bidding only the jobs your engineering team has genuinely de-risked. EPCs that apply residential habits to C&I (fast bids, thin diligence) or C&I habits to residential (slow, over-engineered quotes) lose money in both.
Many firms run both segments. That works only with separate job-cost tracking and separate margin floors per segment. Blended P&Ls hide which segment is subsidizing the other — and it is usually residential subsidizing C&I losses.
The Procurement Playbook
Equipment is half your cost base, so procurement deserves a written playbook, not a series of phone calls.
Standardize the BOM. Two or 3 module SKUs, 2 inverter families, 1–2 racking systems. Standardization cuts design exceptions, speeds crews, and concentrates volume for pricing.
Buy on committed volume. Quarterly commitments of 500 kW+ unlock distributor pricing tiers that spot buys never see. The tradeoff is inventory risk — cap stock at 4–6 weeks of install volume.
Track cost per watt monthly, per SKU. Module prices can move 10–20% in a quarter. If your sold prices assume last quarter’s equipment cost, a falling market gives you windfall margin and a rising market quietly erases it. Reprice quotes older than 30 days before signing.
Dual-source critical items. Inverters and rapid-shutdown devices have the longest lead times and the most project-stopping power. One approved alternative per critical SKU has saved more schedules than any expediting fee.
Global module supply remains in structural oversupply, keeping prices near record lows — a trend documented in IEA’s Renewables 2024 analysis. Low equipment costs help EPC margins, but only firms with disciplined procurement capture the benefit instead of passing it all to customers in price wars.
Hiring and Crew Structure
Labor is the constraint most EPCs hit between 20 and 50 installs a month. The math: a productive 3-person residential crew completes roughly 8–12 installs a month depending on system size and roof mix. Every crew you add needs a licensed electrician ratio that your state or country mandates, plus a lead who can run QA without supervision.
Hire for the bottleneck role, not the cheap role. In most markets the scarce seat is the crew lead, not the installer. Promoting your best installer to lead without QA training is the classic mistake — you lose your best installer and gain a mediocre supervisor. Our hiring guide for solar EPCs covers role definitions and pay benchmarks in detail.
Subcontractors are a valid capacity valve for seasonal peaks, but cap sub work at 30–40% of install volume. Above that, you are a sales company with a quality-control problem, and your warranty exposure belongs to someone whose incentives end at final payment.
Conclusion
Profitable solar EPCs are not smarter about solar. They are more disciplined about 5 numbers: margin per job, design turnaround, install productivity, rework, and cash conversion. Three actions for this week:
- Build your job-cost baseline: estimate vs. actual variance on the last 20 closed jobs.
- Set a written margin floor and a named exception approver.
- Start the 13-week cash forecast — 1 spreadsheet, 30 minutes a week.
The fastest single lever for most EPCs is design-to-proposal speed, because it touches labor cost, close rate, and rework at once. Book a SurgePV demo and we will show you the workflow on one of your real projects. For the margin benchmarks behind this guide, read our solar installer profit margins analysis next.
Frequently Asked Questions
What is a solar EPC company?
A solar EPC company handles Engineering, Procurement, and Construction of solar projects. It designs the system, buys the equipment, and builds the installation, usually carrying single-point responsibility for performance, timeline, and warranty.
What is a good gross margin for a solar EPC?
Healthy solar EPCs target 20–30% gross margin on residential work and 12–20% on competitive C&I projects. Below 15% gross margin, a single callback or price spike wipes out project profit. Industry-observed net margins run 5–10% for well-run firms.
How do solar EPCs make money?
Solar EPCs earn the spread between installed price and total delivered cost. Profit levers are procurement discounts, design standardization, fast installation cycles, low rework, and attach revenue like batteries, monitoring, and O&M contracts.
What are the biggest costs for a solar EPC?
Equipment (modules, inverters, racking) is typically 45–60% of project cost. Labor runs 10–20%. Overhead — sales, design, permits, insurance, office — consumes another 10–15%. Soft costs dominate in mature markets like the US, per NREL cost benchmarks.
Why do solar EPC companies fail?
The common failure pattern is underpricing to win volume, then bleeding cash on rework, change orders, and slow collections. Poor job costing means they discover the losses months later. Cash flow, not demand, kills most solar EPCs.
How can a solar EPC scale profitably?
Scale on standardized designs, documented SOPs, and a repeatable sales pipeline before adding crews. Growing headcount faster than process maturity multiplies errors. The EPCs that scale well add volume only after gross margin holds above 20% for 2 consecutive quarters.
Where this fits
This article is part of SurgePV's Solar Business & Operations hub, which works through the topic from first principles to the decisions a project team actually has to make.

