Quick Answer
Customer acquisition alone runs to $0.67 per watt. Yet the average sales close rate sits at just 29%. You will learn how to use anchoring, decoy effects, loss-aversion framing, and proposal structure to close more deals. Yet the average close rate sits at just 29%. Solar pricing psychology is the study of how presentation, context, and cognitive bias shape buying decisions.
Most solar prospects do not reject solar. They reject the way the price is shown.
Customer acquisition alone runs to $0.67 per watt. Yet the average sales close rate sits at just 29%. You will learn how to use anchoring, decoy effects, loss-aversion framing, and proposal structure to close more deals.
US residential solar averages $3.39 per watt. Soft costs eat 65% of that total. Customer acquisition alone runs to $0.67 per watt.
Yet the average sales close rate sits at just 29%. The gap is not in the product. It is in the presentation.
This guide covers the behavioral economics of solar pricing. You will learn how to use anchoring, decoy effects, loss-aversion framing, and proposal structure to close more deals. Every tactic is backed by NREL research, LBNL data, and behavioral science.
TL;DR — Solar Pricing Psychology
Behavioral research shows that how you present a solar price changes whether a prospect buys. Installers using structured anchoring, three-tier decoy proposals, and loss-aversion framing can improve close rates beyond the 29% industry average.
In this guide:
- How anchoring shapes what a solar quote feels like
- Why three-tier proposals trigger the decoy effect
- How loss-aversion framing beats gain-based pitches
- Proposal breakdown tactics that kill sticker shock
- How to build pricing psychology into your software workflow
Solar Pricing Psychology: The Current Market Reality
US residential solar costs about $3.39 per watt. Soft costs eat 65% of that total. Customer acquisition runs to $0.67 per watt.
Yet the average close rate sits at just 29%. Most prospects do not reject solar. They reject how the price is shown.
Clear quotes and smart framing address the top buyer hesitations.
Solar pricing psychology is the study of how presentation, context, and cognitive bias shape buying decisions. NREL-backed research shows that reframing financial benefits alone rarely changes minds.
Smart pricing presentation, social proof, and clear proposal structure help. They directly address the top three buyer hesitations: unclear quotes, poor communication, and lack of expertise.
| Cost Component | US Residential Benchmark | Source |
|---|---|---|
| Average system price | $3.39/Wdc | SEIA/Wood Mackenzie Q4 2025 |
| Soft costs share | ~65% of total | SEIA/RMI |
| Customer acquisition cost | ~$0.67/W | NREL 2013 |
| Average sales close rate | 29% | HubSpot 2025 |
| Home-value premium with solar | ~$15,000 | LBNL 2015 |
The US residential solar market is expensive to sell. Soft costs make up roughly 65% of a system’s total price. These include permits, marketing, sales labor, and overhead. For more on this topic, see Solar Permitting Guide.
In Australia and Germany, soft costs run closer to 15–25%. That gap explains why US customer acquisition costs hover near $0.67 per watt. Australian installers spend a fraction of that. Also see: Germany solar subsidies. See our guide on Community Solar Projects Germany for more. For Australia-specific compliance details, see Australia comparisons/lgc-vs-stc.
High acquisition costs mean every lost deal hurts. HubSpot data puts the average solar sales close rate at 29%.
44% of deals die because objections go unanswered. 61% of lost B2B deals trace back to buyer indecision.
In solar, indecision often starts when a prospect sees one big, unexplained number.
The Modernize Home Services Survey found something important. Unclear quotes rank among the top three homeowner hesitations.
32.6% of homeowners flag unclear quotes as a core concern.
This is not about the dollar amount. It is about how the number is framed, broken down, and presented.
NREL’s SEEDS study surveyed 904 homeowners. It found that most prospects had no real idea what solar costs. Many assumed it was unaffordable before hearing a quote.
Low awareness means the first number a prospect sees becomes the entire story. That first number is the anchor.
If it is unprepared, the sale is over before it starts.
Behavioral economists Daniel Kahneman and Amos Tversky proved something. People rely on the first piece of information they receive. That piece becomes the reference point for every judgment that follows.
In solar, the reference point might be a neighbor’s system. It might be a Google search.
Or it might be your first quote. Smart installers control that reference point deliberately.
Research from Scientific Reports (2023) shows machine learning can cut customer acquisition costs by 15%. That is $0.07 per watt saved through better lead targeting.
But even perfect leads need a well-designed price presentation. Pricing psychology and predictive scoring work best together.
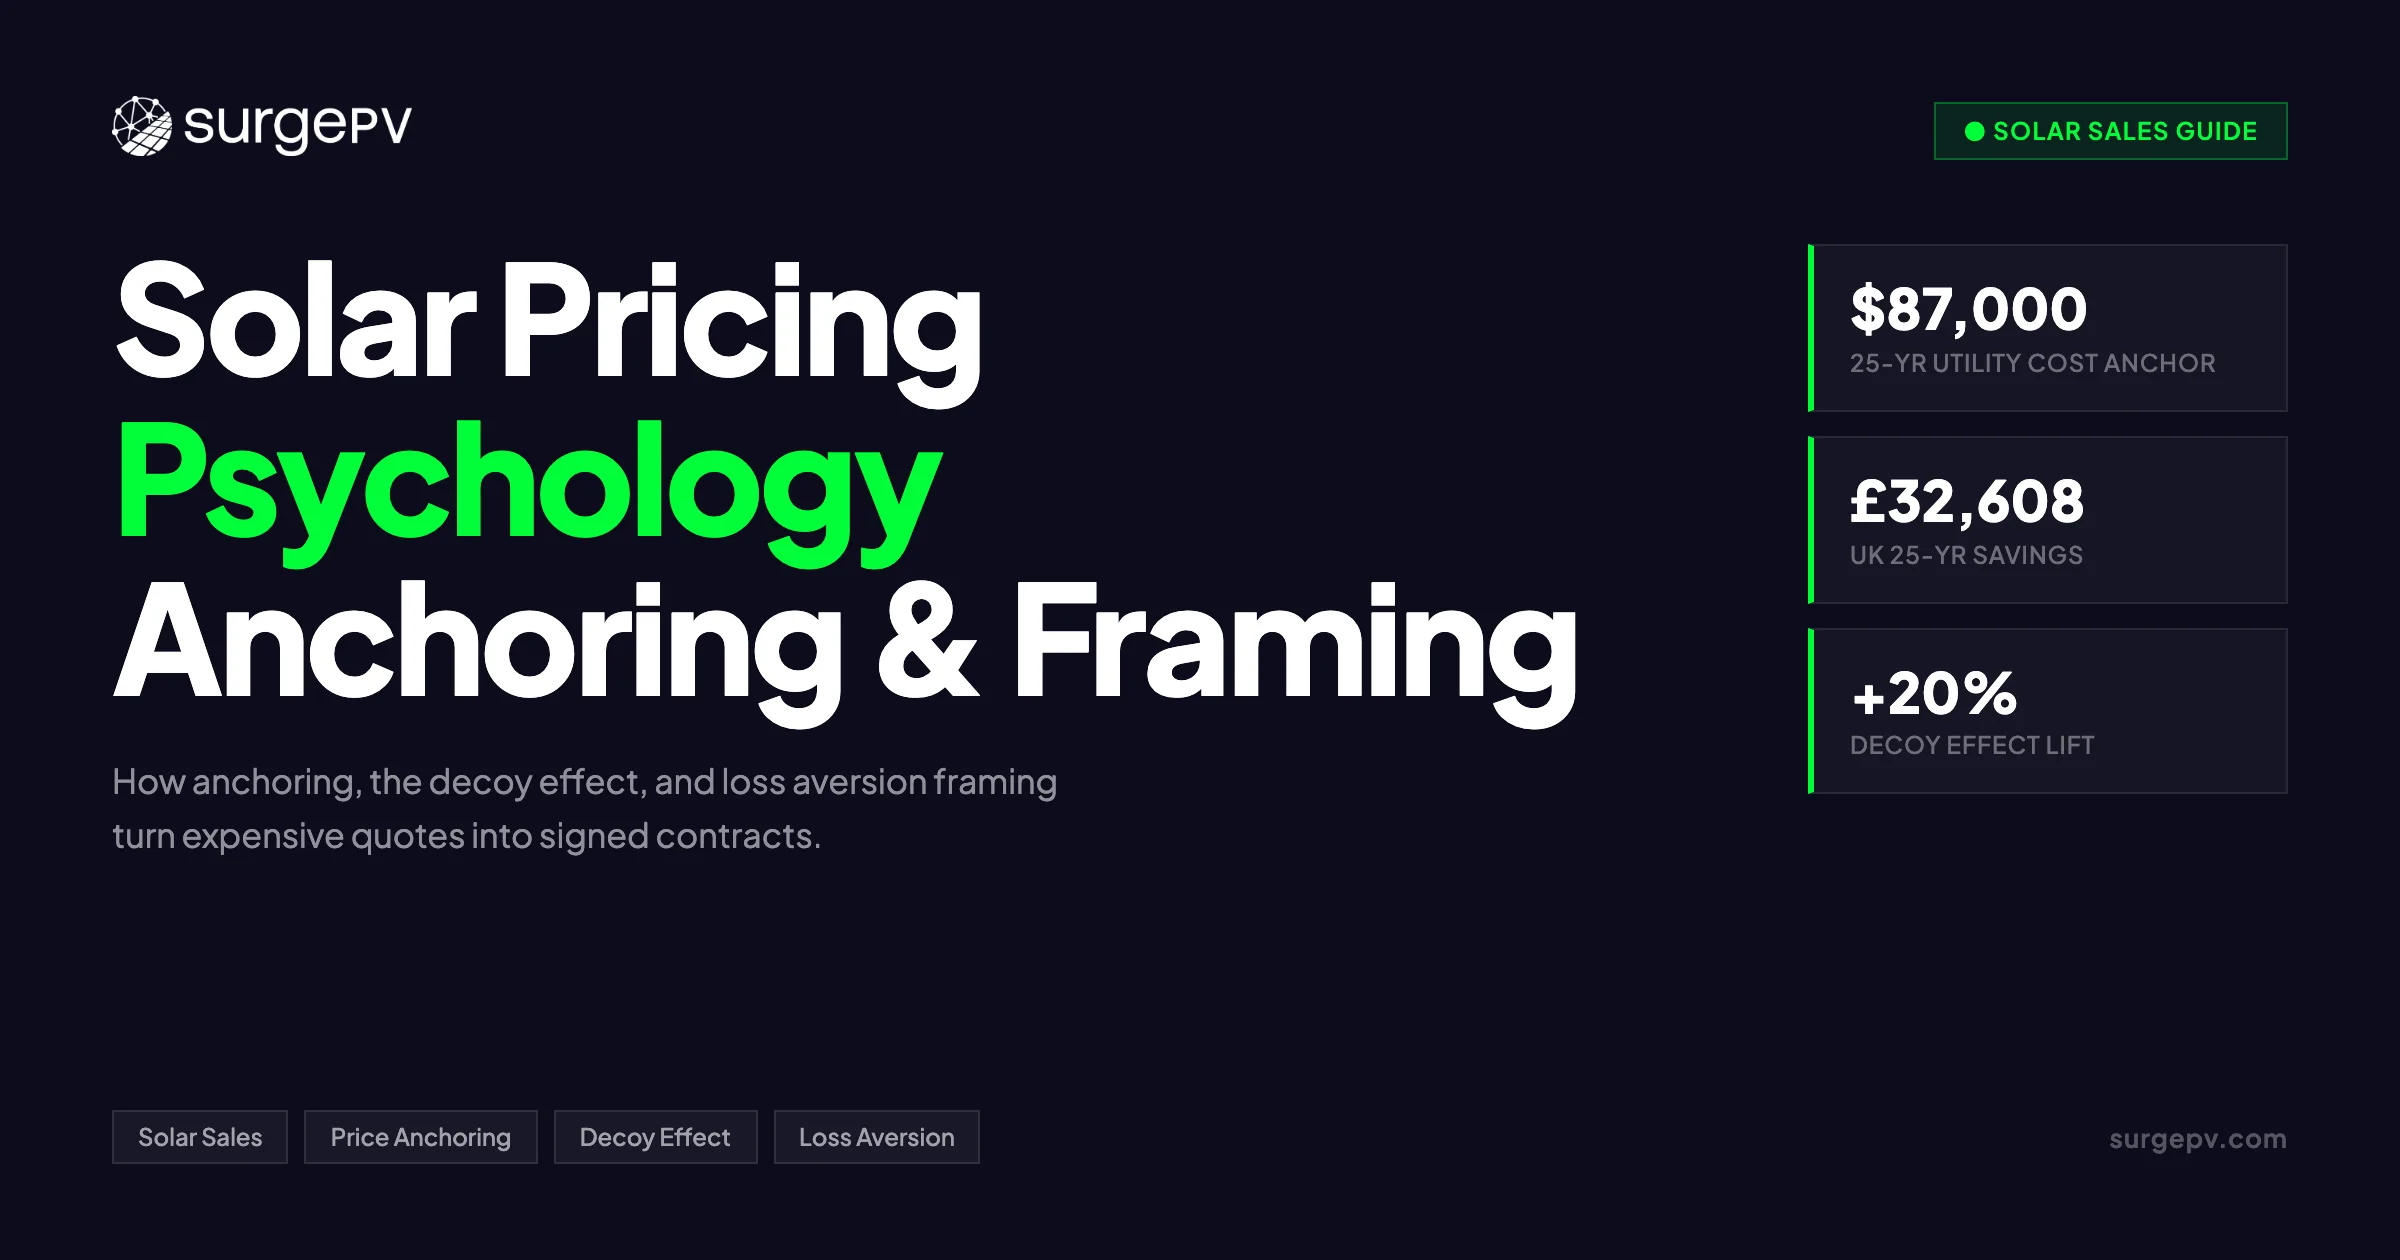
Lawrence Berkeley National Lab analyzed ~22,000 home sales. Homes with solar sold for a premium of about $15,000. That data point is a powerful anchor.
It reframes solar from an expense to an asset. Yet most proposals never mention it.
SEIA data shows the residential market contracted 12% in the first half of 2025. High interest rates and policy uncertainty made buyers more cautious.
Cautious buyers need more structure, not less. A sloppy price presentation kills deals faster in a down market.
Anchoring Effect in Solar Sales: Setting the Reference Point
The anchoring effect is a cognitive bias. The first number a prospect sees becomes their mental reference point.
In solar sales, showing a high-priced package first makes your preferred package feel affordable. Showing the national average before your quote frames your price as competitive.
The anchoring effect is a cognitive bias where the first number seen becomes the mental reference point for all later numbers. In solar sales, showing a high-priced package first makes your preferred package feel affordable. Showing the national average cost per watt before your quote frames your price as competitive.
Kahneman and Tversky first documented anchoring in the 1970s. They found that arbitrary numbers, even random ones, skew later estimates.
In solar, the effect is not arbitrary. It is intentional. The first price a prospect sees sets the stage.
There are three practical anchors every solar rep should use.
First, the market anchor. SEIA data puts the national residential average near $3.39 per watt. Show this number early.
When your quote comes in at $3.10 per watt, it feels like a win. When your quote comes in higher, you have already set the stage.
You can now explain premium equipment or financing.
Second, the contrast anchor. Present your largest, most feature-rich package first. Let the prospect absorb the $45,000 figure.
Then present your preferred $28,000 package. The second number feels smaller by comparison. For the latest details on France, see Agricultural Solar Case Study. See our guide on Floating Solar Farms France for more.
This is the power of contrast. Mark Hunter of The Sales Hunter calls this one of the most underused tactics. It works in B2B sales.
It works in living rooms too.
Third, the asset anchor. Lawrence Berkeley National Lab found that homes with solar sell for roughly $15,000 more. That is compared to similar homes without it.
Use this when a prospect says they might move. Solar is not a sunk cost.
It is a home improvement that pays back at resale. The $15,000 figure anchors the discussion away from sticker shock and toward property value.
Never deliver your anchor via email. HubSpot research shows that reps who present price face-to-face close at higher rates.
Email gives the prospect time to fixate on one number without context. A live presentation lets you control the sequence. You can read the room.
You can adjust the frame in real time.
Your solar proposal software should make anchoring automatic. Pre-load the NREL average into every proposal. Start with the premium tier.
Let the software handle the math while you handle the conversation.
The Decoy Effect and Good-Better-Best Solar Packages
The decoy effect happens when a third option changes a choice. It makes one of two original options look more attractive.
A three-tier Good-Better-Best proposal uses a high-priced decoy to push buyers toward the middle tier. This also triggers the compromise effect.
Buyers avoid extremes and pick the safe middle option.
The decoy effect happens when a third option makes one of two original options look more attractive. In solar, a three-tier Good-Better-Best proposal uses a high-priced decoy to push buyers toward the middle tier. This also triggers the compromise effect, where buyers avoid extremes and pick the safe middle option.
Dan Ariely demonstrated the decoy effect with subscription pricing. When given two options, people struggle.
Add a third option that is clearly worse than one but similar in price. Preference shifts dramatically. Solar proposals follow the same logic.
A Good-Better-Best structure gives prospects three choices. Good covers standard panels and basic inverter setup. Better adds higher-efficiency modules and monitoring.
Best includes premium panels, storage, and extended warranties. The Best tier is not there to sell.
It is there to make Better look like a smart, balanced choice.
Behavioral research shows that customers given three options report higher satisfaction post-purchase. They feel they made an active choice.
They also show fewer regrets. This matters in solar. A solar system is a long-term commitment.
Buyers who feel confident in their choice refer more neighbors and write better reviews.
Price spacing matters. If Good is $20,000 and Better is $21,000, the decoy is too weak.
If Best is $80,000, it looks absurd. The rule of thumb: Best should cost roughly 40–60% more than Better.
Good should sit about 15–25% below Better. This range makes Better feel like the obvious compromise.
NREL-backed research by Sigrin et al. (2018) found something clear. Broad financial framing alone does not drive solar adoption.
But segment-tailored messaging does. Apply this to your tiers.
A cost-focused prospect sees payback periods. A green-minded prospect sees CO2 offsets.
A risk-averse prospect sees warranty coverage. Same three tiers. Three different frames.
Your solar design software can support this. Build tier templates with pre-set equipment bundles. Let the 3D model show the full system first.
Then toggle to the recommended tier. The visual drop from “full coverage” to “recommended” creates contrast.
The recommended tier feels like a balanced, sensible choice.
Loss Aversion Framing: Making Inaction Feel Expensive
Loss aversion means people feel losses about twice as strongly as equivalent gains. In solar sales, framing a proposal around avoiding future utility hikes often works better.
It beats promising savings. Showing what waiting costs pushes prospects to act.
The same math feels different when framed as a loss.
Loss aversion means people feel losses roughly twice as strongly as equivalent gains. In solar sales, framing a proposal around avoiding future utility hikes often works better than promising savings. Showing what waiting costs — lost incentives, missed net metering, higher rates — pushes prospects to act.
Kahneman and Tversky’s prospect theory changed economics. They proved that a $100 loss hurts more than a $100 gain feels good.
The ratio is roughly 2:1. This bias is hard-wired. It does not respond to logic.
It responds to framing.
Most solar reps frame solar as a gain. “You will save $47,000 over 25 years.” That is true.
But it is weak. The prospect has not lost that money yet. The savings feel abstract.
A loss frame hits differently.
“Your utility has raised rates 4% per year for the last decade. If that continues, you will pay an extra $38,000 in electricity. Solar locks your cost now.”
The same math. A different feeling.
Temporal framing adds pressure. Utility rate hikes happen in the future. That makes them easy to ignore.
Bring them into the present. “Every month you wait costs you $140 in avoidable utility spend.” Now the loss is real and immediate.
Incentive step-downs are another loss trigger. When local incentives or net metering caps approach, frame them as windows closing.
“Net metering grandfathering ends when the cap hits. Projects installed after that date switch to lower export credits.”
This is not fear-mongering. It is accurate policy framing. The prospect sees inaction as a direct financial loss.
Be careful with expired federal incentives. The federal residential ITC expired at the end of 2025. Do not present it as available.
Instead, use state or utility-level incentives with clear expiration dates. Loss framing only works with verifiable facts.
Your generation and financial tool should auto-build these loss frames. Instead of static “total savings” charts, show “cost of waiting” month by month.
Let the prospect see the dollars leaving their account. Solar software that visualizes loss in real time makes the abstract feel concrete.
Close More Deals With Proposals That Sell Themselves
Stop sending plain PDF quotes. Use three-tier templates, automatic anchors, and loss-aversion charts built into your workflow.
Book a DemoNo commitment required · 20 minutes · Live project walkthrough
Solar Proposal Pricing Strategies That Reduce Sticker Shock
The best proposal strategies break one large total into small, relatable numbers. Show total cost, then incentives, then net cost, then monthly payment, then monthly savings, then lifetime savings.
Never lead with the gross number. Sequence matters more than the final price.
Sticker shock is about surprise, not price.
The best solar proposal pricing strategies break one large total into small, relatable numbers. Show total cost, then incentives, then net cost, then monthly payment, then monthly savings, then lifetime savings.
Never lead with the gross number. Sequence matters more than the final price.
Sticker shock is not about price. It is about surprise.
A prospect who sees $32,000 without warning feels ambushed. The same prospect who sees $32,000 after understanding incentives, financing, and payback feels informed.
The Modernize Home Services Survey found that unclear quotes are a top-three hesitation.
32.6% of homeowners flag unclear quotes as a core concern.
The fix is structural. Break the investment into six stages:
- Total system cost — the raw number, no filters.
- Incentives and rebates — everything the customer gets back.
- Net investment — total minus incentives.
- Financing monthly — net cost spread over the loan term.
- Monthly savings — current bill minus new solar bill.
- 25-year lifetime savings — the full picture.
This ladder works because each step shrinks the perceived cost. $32,000 becomes $22,400 after incentives. $22,400 becomes $187 per month on a loan.
$187 per month becomes $43 per month. You subtract the $144 utility bill that disappears.
$43 per month becomes $15,800 in lifetime savings. The psychology is relentless. Each step reframes the same money into a smaller mental box.
Never deliver this via email. HubSpot research is clear. Reps who present price live close more often.
Email strips away your ability to guide the ladder. The prospect jumps to stage one and stays there.
Use a screen share or an in-person meeting. Walk them down the ladder one rung at a time.
Visuals beat tables. A horizontal bar showing “old bill vs. new bill” is faster to read than a spreadsheet.
A line chart showing cumulative savings over 25 years makes the long-term feel real. Your solar proposal software should generate these visuals automatically.
The rep should never build a chart by hand.
Time pressure helps when it is real. If a state rebate has a fixed budget, show the remaining pool.
If utility rates just increased, show the announcement. Do not invent urgency. Use facts.
Facts feel honest. Honest urgency converts better than fake scarcity.
How to Engineer Pricing Psychology Into Your Proposal Workflow
Proposal engineering means building pricing psychology into templates, training, and software. It is not an ad-lib sales trick.
Sales managers who systematize anchoring, three-tier decoys, and loss-aversion frames create consistency. Their solar proposal software drives high-converting rep behavior across the entire team.
Proposal engineering means building pricing psychology into templates, training, and software rather than treating it as an ad-lib sales trick. Sales managers who systematize anchoring, three-tier decoys, and loss-aversion frames create consistency. Their solar proposal tool drives high-converting rep behavior across the entire team.
Individual reps should not be expected to reinvent behavioral economics on every call. Pricing psychology should live in the proposal template.
The sales manager’s job is to engineer the bias into the workflow.
Start with tier templates. Build Good-Better-Best bundles with pre-loaded equipment, pre-calculated price spacing, and pre-written feature descriptions.
Each tier should map to a customer segment. Cost-focused buyers see payback. Green buyers see carbon impact.
Risk-averse buyers see warranty depth. NREL research by Sigrin et al. confirms this approach.
Broad financial framing fails. Segment-tailored messaging wins.
Use your solar design tool to create visual anchors. Show the “ultimate system” first.
Let the prospect see full roof coverage, premium panels, and battery backup. Then toggle to the “recommended system.”
The visual drop creates contrast. The recommended system feels like a sensible compromise. This is anchoring and decoy working together in 3D.
Automate loss frames in your generation and financial tool. Replace generic “lifetime savings” headlines with “cost of waiting” counters.
Show month-by-month losses from delayed action. Make the numbers update in real time as you change the start date.
Real-time personalization beats static PDFs.
Train reps on sequence, not scripts. Do not give them a word-for-word pitch. Give them the six-stage investment ladder.
Teach them to present the premium tier first. Drill the face-to-face rule. Role-play the “$15,000 home premium” response to the moving objection.
HubSpot found that only 27% of reps overcome objections well. Training fixes this.
Use Clara AI as a real-time coach. During a live proposal walkthrough, AI can prompt the rep when a decoy tier is ignored.
It can suggest loss-aversion reframes when a prospect stalls. It can flag when a quote is sent via email without a scheduled follow-up.
Software does not replace the rep. It makes the rep consistent.
NREL’s SEEDS study found that perceived social support was the second most powerful adoption driver. Build social proof into the proposal.
Add a map of nearby installations. Show local reviews. Pair pricing psychology with peer validation.
The combination is stronger than either tactic alone.
Conclusion
Start with three concrete moves. Audit your current proposals. Restructure them using the six-stage investment ladder.
Build three-tier templates into your solar proposal generator. Set decoy spacing at 40–60% above the middle tier.
Schedule team training on anchoring and loss framing. Record the session. Turn it into a playbook.
Frequently Asked Questions
What is charm pricing in solar sales?
Charm pricing means ending a solar quote with .97 or .99 instead of a round number. A quote of $24,997 feels materially lower than $25,000.
This effect is called left-digit bias. It works because buyers focus on the first digit they see.
How does price anchoring work in solar sales?
Anchoring sets a reference point that shapes how every later number feels. Show the national average cost per watt first. Then your quote feels reasonable.
Show a premium package first. Then your standard package feels like a bargain.
What is the good-better-best approach for solar proposals?
It is a three-tier proposal structure. The Good option covers basic needs. The Better option adds value.
The Best option includes premium panels or storage. This activates the decoy effect and the compromise effect. Buyers often pick the middle tier.
How do you handle solar price objections using psychology?
Break the total into small, relatable numbers. Show monthly payments next to current utility bills. Use loss framing.
Show what waiting costs. Never email a price. Present it face-to-face or on a live call.
What is loss aversion in solar financing?
Loss aversion means people feel losses about twice as strongly as equivalent gains. Frame solar as avoiding future utility hikes.
Show the cost of waiting. This is often more motivating than promising future savings.