

Quick Answer
No PVsyst report is automatically bankable. A financing stakeholder may consider it decision-ready when the agreed assessor and scope provide traceable resource data, supported loss assumptions, controlled component and project files, reproducible variants, transparent uncertainty and probability methods, and independent review. Confirm required outputs and permitted reliance with the intended user before modelling.
Most solar projects do not fail financing because the site is bad. They fail because the yield report cannot survive an independent engineer’s review. The developer submits a PVsyst run with default losses, an undocumented meteo file, and a single P50 number. Six weeks later, the lender’s advisor cuts the P90 by 8%, the debt sizing collapses, and the deal reprices or dies.
We have seen this pattern across 1+ GW of delivered projects. The simulation itself is rarely the problem. The problem is what the report leaves undocumented.
PVsyst is widely used for utility-scale and C&I performance modelling, but software choice does not establish financing acceptance. Its editable assumptions can support audit and reproduction when the complete files are supplied. That transparency cuts both ways: unsupported inputs and inconsistent files are visible to a diligent reviewer.
This guide covers what lenders and investors actually require: how P50 and P90 drive debt sizing, which loss assumptions get challenged first, how to document meteo data and component files, what the independent engineer review looks for, and the specific red flags that stall or kill financing.
Quick Answer
No PVsyst report is automatically bankable. A financing stakeholder may require reproducible project files, traceable resource data, supported loss assumptions, controlled components, uncertainty and probability analysis, sensitivities, and independent review. Confirm the intended user’s scope and reliance requirements before modelling.
In this guide:
- What “bankable” means in practice for a PVsyst yield report
- How P50, P75, and P90 drive debt sizing and equity returns
- The loss assumptions lenders scrutinize line by line
- Meteo data, PAN/OND files, and site measurement requirements
- What the independent engineer review actually checks
- The 10 red flags that trigger re-runs, haircuts, or rejection
- A step-by-step checklist for a first-pass bankable report
What “Bankable” Means for a PVsyst Report
Bankability is not a software setting or a universal technical threshold. Reproducibility is one important test: a competent third party should be able to inspect the supplied project files, understand the inputs, rerun the defined variant, and investigate material differences. The intended financing party decides whether the assessor, evidence, uncertainty, review, and reliance terms are acceptable.
The concept of bankability extends beyond the simulation. It covers the module and inverter manufacturers (are they on the lender’s approved vendor list?), the EPC and O&M counterparties, and the offtake contract. But the yield report is the piece the developer controls directly, and it is where most reviews start.
Three properties commonly make a report easier to review:
- Reproducibility. The full PVsyst project file is shared, not just the PDF output. Every variant, shading scene, and batch of settings is intact.
- Traceability. Every input has a documented source: a named meteo dataset, a manufacturer datasheet, a measured value, or a cited study. No “engineering judgment” without a basis.
- Conservatism where it matters. Assumptions that drive revenue — soiling, availability, degradation — sit at or slightly below industry norms, and the report explains why.
PVsyst itself is accepted by lenders worldwide as the reference simulation tool, with the company reporting tens of thousands of licensed users across more than 100 countries, according to PVsyst SA (2025). That acceptance is earned: the software forces explicit loss modeling rather than black-box derate factors. For a broader introduction to the tool, see our guide on what PVsyst software is and how it works.
The distinction that matters: a technically checked simulation and a financing-reliance package are different deliverables. The latter may additionally require an accepted assessor, independent review, uncertainty work, reliance language, and stakeholder-specific evidence.
P50 and P90: The Numbers That Size the Debt
The P90 yield is the annual energy production the project will exceed with 90% probability. Lenders size debt on P90 — or occasionally P75 for investment-grade offtakes — because they get paid in bad years too. Equity investors model their returns on P50, the median expectation.
The spread between P50 and P90 determines how much debt the project can carry. A typical utility-scale project shows a P50-to-P90 gap of 5–12%, driven mainly by irradiance uncertainty and interannual variability. For a detailed breakdown of how these exceedance probabilities work, see our guides on P50 vs P90 in solar and solar probability of exceedance.
Here is how the numbers flow into financing, using a hypothetical 50 MWdc project:
| Metric | Value | Who uses it |
|---|---|---|
| P50 yield (Year 1) | 1,750 kWh/kWp | Equity IRR model, PPA pricing |
| P75 yield (Year 1) | 1,690 kWh/kWp | Strong-offtake debt cases |
| P90 yield (Year 1) | 1,620 kWh/kWp | Base debt sizing |
| P90/P50 ratio | 92.6% | Debt headroom |
| 10-year P90 | 1,550 kWh/kWp | Debt tenor coverage |
Where probability-of-exceedance values are required, the report should explain the requested cases and the uncertainty inputs and combination method behind them. Default values should not be accepted without project-specific justification, and a reviewer should be able to distinguish uncertainty from operating scenarios.
The math is unforgiving. On that hypothetical 50 MWdc project selling at $50/MWh, a 7.4% P90 haircut removes roughly $540,000 of annual revenue from the debt case. At a 1.20 DSCR covenant, that translates to several million dollars less debt.
Pro Tip
Report P50, P75, P90, and P95 for Year 1 and for the debt tenor average. Reviewers who see a full exceedance table — with the uncertainty inputs behind it — clear this section in days instead of weeks.
Loss Assumptions Lenders Scrutinize Line by Line
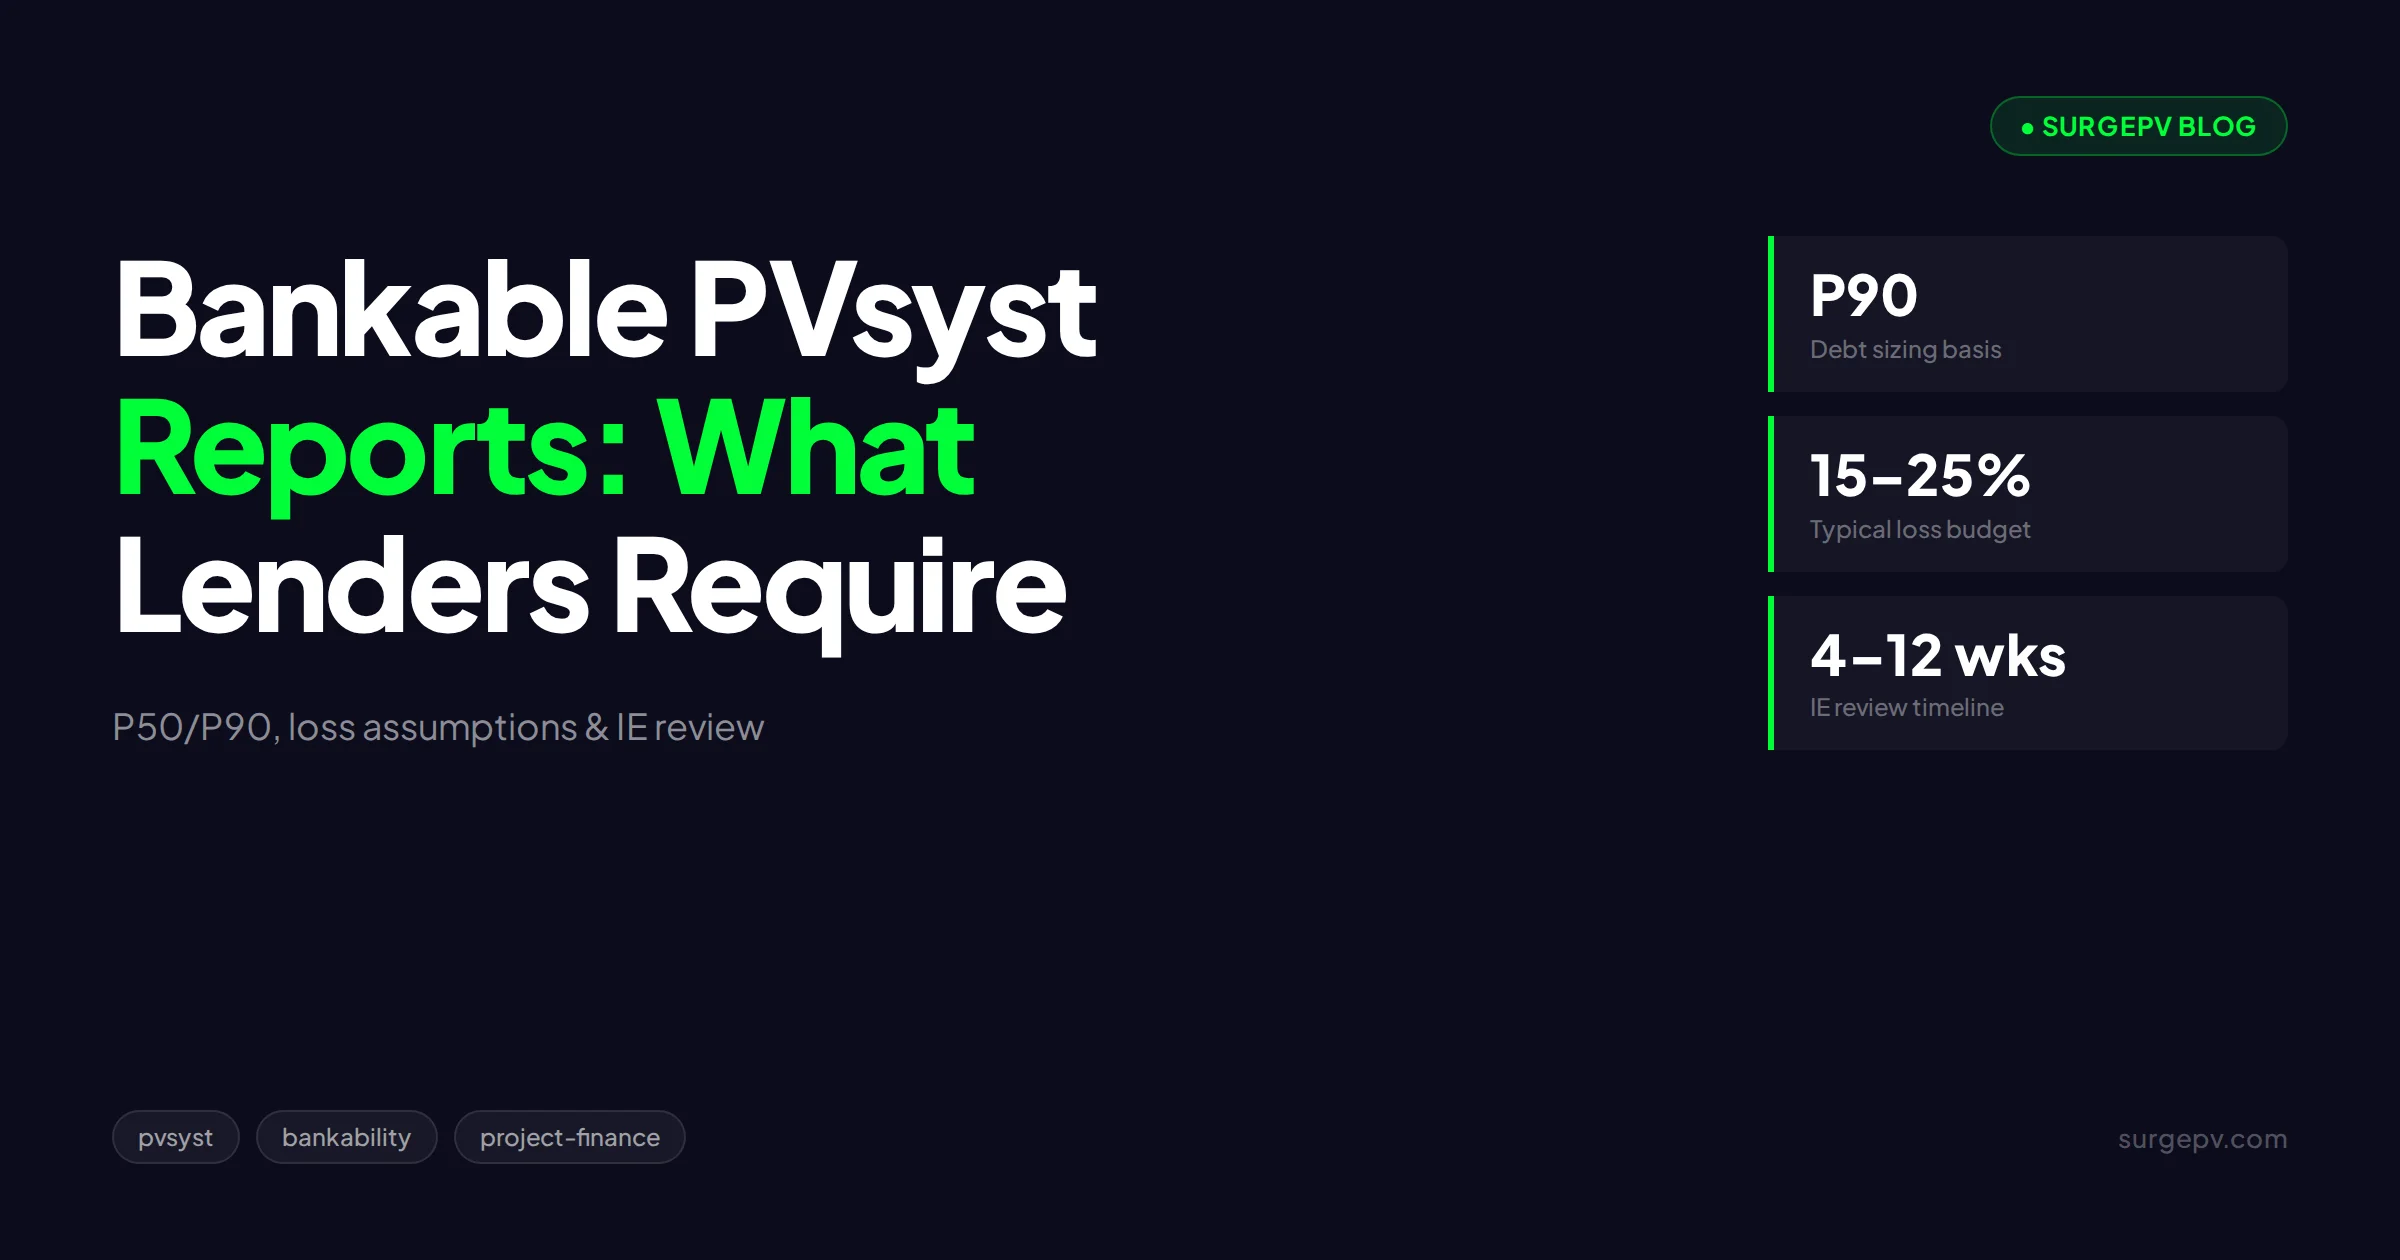
The loss waterfall is where bankability reviews spend the most time. Lenders compare every line of your PVsyst loss diagram against industry norms, and any line that sits materially below the norm needs documented justification. The typical pre-injection loss budget for a utility-scale project totals 15–25% from nominal to meter.
The lines that get challenged first:
| Loss line | Typical accepted range | What triggers a challenge |
|---|---|---|
| Soiling | 1–4% (climate-dependent) | Under 1% without a cleaning contract |
| Shading (near + electrical) | 1–3% | Flat 0% or missing 3D scene |
| DC ohmic wiring | 0.5–1.5% | Below 0.5% at design stage |
| Module quality / mismatch | 1–2.5% | Zero or negative values |
| Inverter + AC losses | 1.5–3% | Efficiency above datasheet at operating temps |
| Availability | 1–3% | Zero, or under 1% without O&M contract |
| Grid curtailment | Project-specific | Missing when PPA has caps |
| Degradation (Year 1 + annual) | LID 1–2%, then 0.4–0.55%/yr | Under 0.4%/yr without manufacturer data |
Soiling deserves special attention because it is the most site-dependent loss. Dust-heavy markets like India, the Middle East, and North Africa routinely justify 3–6% with cleaning schedules, per project data compiled by the Global Solar Atlas (World Bank ESMAP) (2024). A 0.5% soiling assumption in Rajasthan will get flagged in the first read.
Degradation is the second battleground. Module degradation assumptions have tightened as TOPCon and HJT displaced PERC; first-year light-induced degradation plus annual rates now typically total 2–2.5% in Year 1 then 0.4–0.45%/year for n-type modules, according to IEA PVPS reporting (2025). Anything better than the manufacturer’s warranted curve needs a cited third-party study.
Our own practice on EPC projects: we itemize every loss with a basis column — “measured,” “contract,” “datasheet,” or “study [citation].” Lines marked “assumed” get pre-negotiated with the IE before submission. That one habit has cut our review cycles roughly in half.
Input Documentation: Meteo Data, PAN Files, and Site Measurements
A report is only as strong as its inputs. Resource sources have different spatial, temporal, calibration, coverage, and uncertainty characteristics; no fixed hierarchy is correct for every site. The assessor should justify the selected dataset, treatment of measurements, site adaptation, validation, and effect on uncertainty.
Meteo data. Acceptable sources for most lenders include Solargis, Meteonorm, and NASA POWER for early-stage work, with a strong preference for site-specific satellite time series of 15+ years. Interannual variability of solar irradiance runs roughly ±3–6% at most sites, which is why single-year TMY files draw scrutiny, per Solargis methodology documentation (2024). For projects above 20 MW, expect a requirement for 12+ months of on-site measured global horizontal irradiance to bias-correct the satellite series.
Component files. The PAN file (module) and OND file (inverter) must match the exact equipment in the supply contract, with versions traceable to manufacturer datasheets or third-party lab measurements. Reviewers check:
- PAN file source: manufacturer-provided, or built from a certified datasheet (IEC 61215/61853).
- Inverter efficiency curve at your actual operating voltage and temperature, not the European-efficiency headline number.
- Bifacial parameters, if claimed, backed by the manufacturer’s bifaciality coefficient.
Site and layout documentation. The 3D shading scene must reflect the as-designed layout: row pitch, tracker or fixed tilt, terrain, and near obstructions. A shading scene that differs from the layout drawing is an instant credibility hit. Physics-based shading models — the same class of analysis behind solar shadow analysis software — are what reviewers expect to see reproduced.
NREL’s free PVWatts tool applies a default 14.08% system loss, which is useful for sanity checks but far too coarse for financing, as documented by NREL PVWatts (2024). If your itemized PVsyst losses total well under that benchmark, expect to defend every line.
The Independent Engineer Review
The independent engineer (IE) — also called the lender’s engineer or owner’s technical advisor — is the reviewer who stands between your report and financial close. The IE does not audit your PDF. The IE rebuilds your yield estimate from raw inputs and issues its own P50/P90. Financing closes on the IE’s numbers.
The review follows a predictable sequence:
- Data room intake. PVsyst project file, meteo files, PAN/OND files, layout drawings, shading scene, offtake term sheet, O&M and cleaning contracts.
- Independent model build. The IE constructs its own PVsyst variant using its preferred meteo data and its own loss benchmarks.
- Variance analysis. Line-by-line comparison of the developer’s and IE’s loss diagrams. Any gap over roughly 0.5% per line gets queried.
- Sensitivity runs. Soiling ±1%, availability ±1%, meteo uncertainty, and degradation rate variations to bound the P90.
- Report issuance. The IE’s P50/P90/P95, plus conditions precedent for close.
Timeline reality: 4–12 weeks for utility-scale, and the schedule slips mostly because of missing inputs, not modeling disputes. The role and selection of this advisor is covered in our post on the solar independent engineer.
One nuance: the IE is not your adversary. IEs benchmark against public datasets — global cumulative PV capacity passed 2.2 TW in 2024, according to IEA PVPS Trends in Photovoltaic Applications (2025) — and against hundreds of reviewed projects. If your assumptions sit inside the observed distribution with documentation, review is fast. Outliers without evidence are what stall deals.
Model yield and financials in one workspace
SurgePV’s cloud platform combines 3D design, shading simulation, and P50-based financial outputs — so your yield model and proposal never drift apart.
Book a DemoNo commitment required · 20 minutes · Live project walkthrough
The 10 Lender Red Flags That Kill or Reprice Deals
Most rejected or repriced reports fail on a short list of recurring problems. If you fix nothing else, fix these:
- P50-only reporting. No exceedance table means no debt case. Instant re-run request.
- Undocumented meteo file. “Meteonorm TMY, default” with no station list, no time period, no bias correction.
- Round-number losses. Soiling exactly 2.0%, availability exactly 2.0%, wiring exactly 1.0%. Round numbers signal untouched defaults.
- Missing 3D shading scene or a scene that does not match the layout drawing.
- PAN/OND files that do not match contracted equipment, or generic library files for a Tier-2 module.
- Optimistic degradation below the manufacturer warranty curve without a cited study.
- Zero curtailment in a market with known grid constraints or PPA caps.
- No uncertainty inputs behind P90 — the number exists but cannot be defended.
- Version ambiguity. Report generated in an old PVsyst version with different bifacial or shading models, not disclosed.
- Inconsistent horizons. Year-1 P90 quoted for debt sizing but degradation applied inconsistently across the tenor.
For teams working across India and similar markets, ask any detailed-engineering specialist to show how its lender checklist addresses source-data traceability, assumption control, sensitivity testing, and independent review. Treat a provider-authored checklist as evidence of its stated process, not proof that a specific report is bankable.
Myth: A Higher P50 Wins the Deal
The most persistent misconception in solar development is that squeezing the yield model — lower soiling, hotter bifacial gain, aggressive availability — improves financing outcomes. It does the opposite.
Aggressive P50 numbers trigger deeper IE scrutiny, wider uncertainty bands, and a lower P90. The lender prices the deal off P90, so an inflated P50 often reduces the debt you can raise. We have watched a developer’s optimistic 1,820 kWh/kWp P50 come back from the IE at 1,710 with a fatter uncertainty band — a double hit that a conservative, well-documented 1,750 would have avoided.
The tradeoff is real: conservative inputs lower your equity case on paper. But equity investors apply their own haircuts to developer models anyway. The optimal strategy is a P50 that sits at the center of the defensible range, with tight, documented uncertainty. Tight uncertainty is worth more than a high median.
There is one legitimate exception: measured performance data. If you operate a sister plant 50 km away with 3 years of metered production, that evidence can justify assumptions better than industry norms — and IEs accept it. Evidence beats optimism every time.
Building a Bankable Report: Step-by-Step Checklist
Here is the sequence we run before any report leaves the building:
- Lock the design first. Layout, row pitch, tilt or tracker configuration, DC/AC ratio, and equipment selection frozen before simulation. Yield reports on unfrozen designs waste review cycles.
- Source 15+ years of site-specific satellite meteo data. Add on-site measurements where the project scale justifies a met station.
- Build the 3D shading scene from the actual layout drawing. Export the drawing, import the scene, cross-check module counts.
- Use contract-exact PAN and OND files. Verify against datasheets; document the source of every parameter.
- Itemize losses with a basis for each line. Measurement, contract, datasheet, or cited study. Nothing “assumed” without a number behind it.
- Fill in uncertainty inputs deliberately. Meteo, model, and loss uncertainties documented, then P50/P75/P90/P95 computed and tabulated.
- Apply degradation consistently across Year 1 and the full debt tenor.
- Self-review against the 10 red flags above before submission.
- Package the data room. Project file, meteo files, component files, drawings, contracts, and a one-page assumptions memo.
For early-stage screening and C&I projects below utility-finance scale, a cloud solar design software workflow is faster than a full PVsyst data room. SurgePV’s solar designing module handles 3D layout and string sizing, while the solar financial modeling produces yield simulation and payback, IRR, and NPV in the same workspace — enough for most commercial offtake conversations. When the project graduates to project finance, the PVsyst discipline above takes over, and the two outputs should agree within a few percent.
Once financing closes, the same yield model feeds the offtake-facing documents. Teams using solar proposal generation can carry the production estimates straight into branded proposals without re-keying numbers between tools.
How to Buy PVsyst Report and Simulation Services
Start with the decision the model must support. A preliminary production estimate, design comparison, tender model, owner forecast, and financing review do not require the same inputs or assurance. State the project stage, reporting period, required probability cases, applicable technical-adviser requirements, and who owns final acceptance.
The input package should identify the site and coordinate system, meteorological source and period, horizon and near-shading scene, layout and capacity, module and inverter files, electrical architecture, availability and curtailment assumptions, degradation treatment, and every loss factor. Ask for the PVsyst project and variant files—not only a PDF—plus the version used, input register, loss diagram, hourly or monthly outputs when required, assumptions log, sensitivity cases, and revision record.
QA should include independent checks of capacity and equipment, weather provenance, geometry and shading, DC/AC configuration, clipping, thermal and ohmic losses, availability, grid limits, and consistency between the report and source files. Compare results with another defensible method or measured operating data where available. A PVsyst report is not automatically “bankable”: lenders, investors, technical advisers, and contracts define their own evidence and review requirements, and an independent engineer may require additional analysis.
Heaven Designs lists PVsyst forecasts and shading analysis within its solar pre-design service. Buyers should confirm the precise modelling scope, data sources, uncertainty method, deliverable files, reviewer qualifications, intended reliance, and current schedule in writing. A preliminary forecast does not replace detailed engineering, site diligence, an independent energy-yield assessment, or lender acceptance.
Disclosure: SurgePV is promoting Heaven Designs through a commercial relationship. Apply the same source-data review, reproducibility test, sensitivity review, and independent QA process to every provider.
Review the Heaven Designs solar pre-design service, visit the Heaven Designs website, and request a project-matched PVsyst sample before seeking a quote.
For a broader overview of the tool and its limits, read what PVsyst software is. For provider selection and commercial controls, use the solar design services buyer’s guide.
Conclusion
A financing-oriented PVsyst package is a documentation exercise as much as a modelling exercise. A defensible report makes inputs, assumptions, files, uncertainty, limitations, and review history transparent. Financing timing and acceptance still depend on the stakeholder and the project’s wider technical, legal, commercial, and risk profile.
Three actions to take before your next submission:
- Audit your loss waterfall against the ranges in this guide. Flag any line without a measurement, contract, or citation behind it, and fix it before the IE finds it.
- Build the full exceedance table. P50, P75, P90, and P95 for Year 1 and the debt tenor, with documented uncertainty inputs. If your P90 cannot be defended, your debt sizing is fiction.
- Package the data room with the report. Project file, meteo data, PAN/OND files, layout drawings, and an assumptions memo in one submission. First-pass completeness is the single biggest schedule lever you control.
If you are building yield and financial models for C&I projects, book a demo to see how SurgePV connects design, shading simulation, and financial outputs in one cloud workspace.
Frequently Asked Questions
What is a bankable PVsyst report?
There is no universal bankable-report specification. A lender or investor may require reproducible model files, traceable weather data, supported loss assumptions, uncertainty and probability analysis, sensitivities, independent review, and defined reliance. Obtain that stakeholder’s requirements before commissioning the report instead of assuming software output will be accepted.
Do lenders use P50 or P90 for solar project finance?
Most lenders size debt service on the P90 annual energy yield, sometimes P75 for strong offtakes. Equity investors model returns on P50. The gap between the two — typically 5–12% depending on resource uncertainty — determines how much debt a project can carry. A report that only shows P50 will not pass credit review.
Which meteo data sources do lenders accept in PVsyst?
Lenders generally accept satellite-derived datasets with 15+ years of data, such as Solargis, Meteonorm, and NASA POWER, with preference for site-specific satellite data validated against nearby ground stations. For utility-scale projects, at least 12 months of on-site measured irradiance is often required to calibrate the satellite data and reduce uncertainty.
What loss assumptions raise red flags in a PVsyst report?
Red flags include soiling losses under 1% without a cleaning plan, DC/AC mismatch losses below 1%, zero availability loss, combined degradation under 0.4%/year without manufacturer backing, and round-number defaults copied from PVsyst presets. Every loss line needs a documented basis: measurement, contract, or cited study.
What is the role of the independent engineer in solar financing?
The independent engineer (IE), also called the lender’s engineer or technical advisor, reviews the yield assessment on behalf of the debt provider. The IE reruns the PVsyst simulation, checks meteo data and losses, verifies component datasheets, and issues its own P50/P90 estimates. Financing closes on the IE’s numbers, not the developer’s.
How long does bankability review of a PVsyst report take?
Expect 4–12 weeks from submission to IE report issuance for a utility-scale project. Missing documentation — invalid PAN files, undisclosed shading scenes, missing uncertainty tables — is the main cause of delay. Developers who submit a complete data room with the PVsyst project file typically clear review in the first pass.
Where this fits
This article is part of SurgePV's Solar Design hub, which works through the topic from first principles to the decisions a project team actually has to make.


