

A 2 MW rooftop project in Arizona models a P50 yield of 3,850 MWh per year and a P90 yield of 3,460 MWh. The 390 MWh gap between the two numbers is not a safety margin added by the engineer. It is the measured uncertainty of the design, expressed as a probability. Every design choice the team made — satellite dataset, string layout, DC/AC ratio, inverter selection, and degradation assumption — left a fingerprint in that gap.
Solar probability of exceedance is how designers turn weather uncertainty into a design input. P50, P75, P90, and P99 are not finance-only labels. They are engineering tools that tell you how much confidence the design deserves and where to spend effort to improve it.
In this guide:
- What probability of exceedance means for system designers
- The P-values used in solar design and their z-score math
- How uncertainty flows from irradiance data through loss assumptions
- Design choices that tighten the P90/P50 spread
- Common mistakes that widen uncertainty without improving production
- A worked example for a commercial rooftop project
- How modern solar design software automates exceedance analysis
- When P90 matters and when it does not
Quick Answer
Solar probability of exceedance is the statistical chance that a solar plant will produce at least a specific annual energy value. P50 is the median estimate (50% chance of exceedance). P90 is the conservative design floor exceeded in 9 out of 10 years. Designers use these values to size systems, set production expectations, and prove bankability.
What Probability of Exceedance Means in Solar Design
Probability of exceedance answers a simple question: how often will actual production beat a specific number? A P50 forecast means the system has a 50% chance of producing at least that much energy in any given year. A P90 forecast means the system has a 90% chance of producing at least that much.
The “P” stands for probability. The number is the percentage of years expected to exceed the stated value. Higher P-values mean more conservative, lower estimates because the target must be easier to beat.
For designers, this matters because every system has two realities:
- P50 reality. The most likely annual output. This is what sales teams usually quote and what production guarantees often reference.
- P90 reality. The output that shows up even when the weather underperforms. This is what lenders use to size debt and what cautious owners use to stress-test returns.
A design that looks excellent at P50 but fragile at P90 is not a good design. It is a design that depends on average weather to pay for itself. The goal of a bankable design is to make the P90 number as strong as possible while keeping the P50 number honest.
This distinction changes how engineers size equipment. A string inverter sized for P50 peak output may clip more often than expected in high-irradiance years. A battery sized for P50 self-consumption may fall short during cloudy weeks. A guarantee written at P50 will be breached roughly half the time. Probability of exceedance forces the design team to decide which risk level the project can actually afford.
Rating agencies and lenders formalize this logic. MARC Ratings (2026) uses P90 for its rating case and P99 for sensitivity analysis, expecting consultants to validate satellite data with at least one year of ground-based measurements.
The P-Values Designers Actually Use
Solar design reports typically include four probability of exceedance values. Each maps to a specific z-score on a normal distribution of expected annual yields.
| P-value | Probability of exceedance | Z-score | Typical design use |
|---|---|---|---|
| P50 | 50% | 0.000 | Expected production, ROI base case, asset management target |
| P75 | 75% | 0.674 | Mid-case planning, some European project finance |
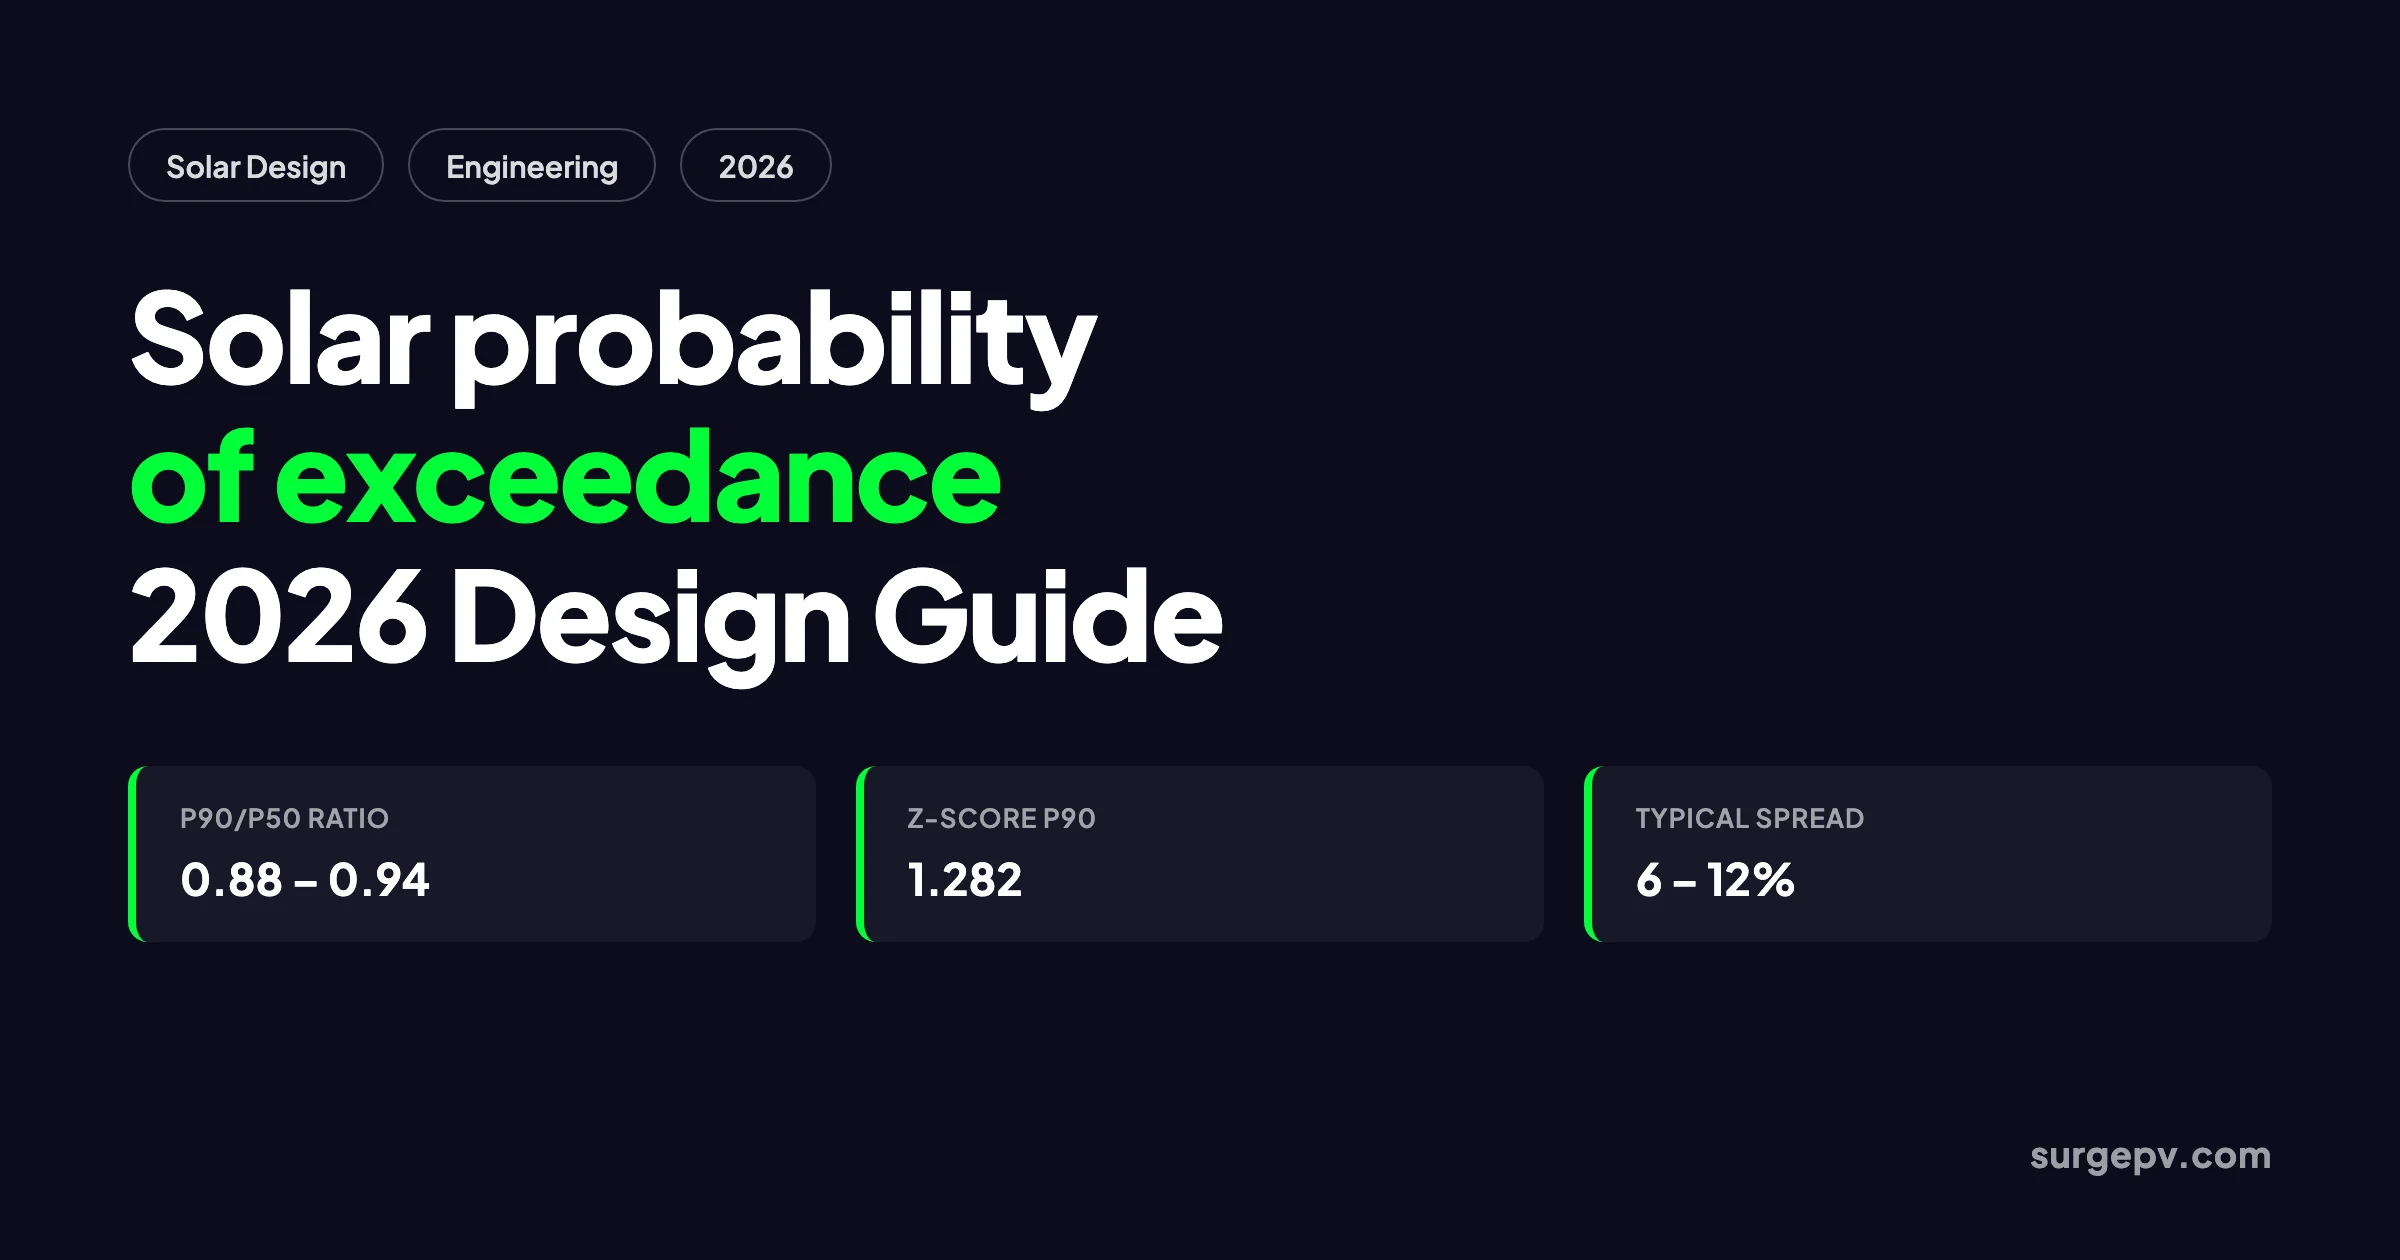
| P90 | 90% | 1.282 | Debt sizing, production guarantees, downside stress tests |
| P99 | 99% | 2.326 | Insurance pricing, extreme stress tests, critical off-grid systems |
The relationship between any P-value and P50 is:
P_xx = P50 − (z-score × σ_total)
Where σ_total is the total combined uncertainty expressed in the same units as energy yield. This single equation drives every bankable yield estimate in the industry.
A designer does not need to memorize z-scores. But a designer does need to understand that the P90/P50 spread is not arbitrary. It is a direct readout of how well the site, model, and equipment are understood.
How Probability of Exceedance Is Calculated
A probability of exceedance calculation converts raw weather data into a distribution of possible annual outputs. The workflow has five steps.
Step 1 — Gather long-term irradiance data
The foundation is 15 to 25 years of hourly irradiance for the project location. Designers work with:
- GHI (Global Horizontal Irradiance) — total solar energy on a horizontal surface
- DNI (Direct Normal Irradiance) — beam radiation from the sun’s direct path
- DHI (Diffuse Horizontal Irradiance) — radiation scattered by the atmosphere
Trusted sources include Solargis, NREL NSRDB, Meteonorm, and SolarAnywhere. Solargis reports typical GHI model uncertainty of around ±3.5% at the annual level, while DNI uncertainty is higher at ±6 to 8% because beam radiation is harder for satellites to resolve.
Step 2 — Run the system simulation
The PV model combines weather data with system definition: module type, tilt, azimuth, inverter efficiency, DC/AC ratio, soiling, shading, wiring losses, transformer losses, and degradation. The output is a year-by-year energy series. The mean of that series is P50.
Modern solar design platforms run 8,760-hour simulations and let designers compare multiple layout iterations without rebuilding spreadsheets.
Step 3 — Quantify each uncertainty source
Total uncertainty is the root-sum-square of independent uncertainty contributions:
σ_total = √(σ_irradiance² + σ_model² + σ_interannual² + σ_equipment² + σ_soiling² + σ_degradation²)
Typical ranges for a well-modeled commercial project are:
| Uncertainty source | Typical sigma (% of P50) |
|---|---|
| Long-term irradiance dataset | 2.5 – 4.0% |
| Simulation model | 3.0 – 5.0% |
| Inter-annual weather variability | 2.0 – 4.0% |
| Soiling and local losses | 0.5 – 2.0% |
| Module performance tolerance | 0.5 – 1.5% |
These values are not guesses. They come from validation studies, manufacturer datasheets, and independent engineering standards. Solargis publishes satellite-derived GHI uncertainty around ±3.5% at the annual level, according to Solargis technical documentation (2025). DNI uncertainty is typically higher because beam radiation is more sensitive to aerosols and cloud microphysics.
Step 4 — Build the distribution
With P50 as the mean and σ_total as the standard deviation, the model builds a normal distribution. Any P-value can be extracted using the inverse cumulative distribution function. PVsyst, Solargis pvPlanner, SAM, and SurgePV automate this step.
Step 5 — Report and act on the results
The final report shows P50, P75, P90, and sometimes P99. A strong design team treats P90 as a design constraint, not a financial footnote.
Design Choices That Tighten Your P90/P50 Spread
The P90/P50 ratio is not fixed by climate alone. Design decisions can materially improve it. A tighter spread means lower financing cost, stronger production guarantees, and happier customers.
Use site-measured irradiance data
Satellite datasets are good. Ground measurements are better. A 12-month on-site pyranometer campaign used to bias-correct satellite data can reduce GHI uncertainty from ±3.5% to ±2.0–2.5%. A 24-month campaign reduces it further. For utility-scale projects, most lenders require at least 12 months of measured data before financial close.
Minimize shading and inter-row losses
Shading is one of the largest controllable uncertainty sources. Poorly spaced rows, nearby structures, and vegetation create losses that are hard to estimate precisely. Use shadow analysis to validate assumptions. Tighter spacing may save land cost but widen the P50/P90 spread if row-to-row shading is not well-characterized.
Validate bifacial albedo and rear-side gain
Bifacial modules can add 5 to 20% energy gain, but only if ground albedo is realistic. Default albedo assumptions from software libraries are often too high for real sites. Measure albedo seasonally or use conservative values. Unvalidated bifacial gain is a common reason P90 estimates fall short after commissioning.
Select proven equipment with tight tolerances
Modules with tight power binning and low temperature coefficients reduce equipment uncertainty. Inverters from established manufacturers with validated efficiency curves reduce model uncertainty. Avoid new or unproven components for projects where P90 is critical.
Optimize DC/AC ratio and clipping
A higher DC/AC ratio increases annual energy but also increases clipping losses. The optimal ratio depends on local irradiance distribution, not a universal rule. In cloudy climates, aggressive clipping can hurt P90 more than P50 because cloudy hours already produce less energy. Model the full loss cascade before finalizing the ratio.
Use trackers with validated backtracking
Single-axis trackers increase production but add mechanical availability and backtracking uncertainty. Ensure the tracker algorithm accounts for terrain slope and diffuse light conditions. Trackers that fail to backtrack correctly during low-sun angles can cause unexpected shading and widen the P50/P90 gap.
Common Design Mistakes That Widen Uncertainty
Some design practices increase the gap between P50 and P90 without improving actual production. These mistakes are expensive because they make the project look riskier to lenders.
Over-relying on TMY data alone
A Typical Meteorological Year (TMY) is a synthetic 8,760-hour year built from typical months. It is fast to simulate but underestimates inter-annual variability. Running only TMY can produce a P90 estimate that is 3 to 4% too optimistic compared with a full multi-year time-series simulation.
Using aggressive soiling assumptions
Default soiling losses from software libraries rarely match local conditions. A site near agricultural dust or coastal salt may see soiling losses twice as high as the default. If the design uses an optimistic soiling value, actual production falls below P90 in the first year.
Ignoring inverter degradation and availability
Inverters fail. Transformer oil ages. Auxiliary loads change. A design that assumes 99.5% availability without modeling replacement cycles or scheduled maintenance understates uncertainty. Use manufacturer data and O&M records to set realistic availability assumptions.
Combining optimistic and pessimistic assumptions inconsistently
Some designers use conservative irradiance but optimistic losses, or vice versa. This produces a P50 number that looks conservative but a P90 number that is not. Every assumption should be documented and internally consistent.
Failing to update the model after commissioning
Once the plant operates, actual production data should refine the model. Updating measured performance ratios, soiling coefficients, and availability can narrow uncertainty and raise P90 without changing hardware.
A Worked Example for a 2 MW Rooftop Project
Consider a 2 MWp commercial rooftop in Texas with the following design inputs:
- P50 annual yield: 3,200 MWh/year
- Irradiance dataset uncertainty: ±3.0%
- Model uncertainty: ±3.5%
- Inter-annual variability: ±3.0%
- Equipment uncertainty: ±1.0%
- Soiling uncertainty: ±1.5%
First, combine uncertainties with root-sum-square:
σ_total = √(3.0² + 3.5² + 3.0² + 1.0² + 1.5²) = √(9 + 12.25 + 9 + 1 + 2.25) = √33.5 = 5.79%
Convert to energy units:
σ_total = 5.79% × 3,200 MWh = 185 MWh
Now calculate P90:
P90 = 3,200 − (1.282 × 185) = 3,200 − 237 = 2,963 MWh
The P90/P50 ratio is 2,963 / 3,200 = 0.926, or 92.6%. This is a strong, bankable result.
If the designer skips a site measurement campaign and relies only on satellite data, irradiance uncertainty might rise to ±4.5%. Total uncertainty becomes:
σ_total = √(4.5² + 3.5² + 3.0² + 1.0² + 1.5²) = √39.5 = 6.28%
P90 drops to:
P90 = 3,200 − (1.282 × 201) = 3,200 − 258 = 2,942 MWh
That small change in data quality costs 21 MWh per year at P90. Over a 25-year project with energy valued at $80/MWh, that is roughly $42,000 in lost bankable revenue. The pyranometer campaign pays for itself.
Probability of Exceedance in 2026 Design Workflows
In 2026, solar design is more probabilistic than ever. Three trends are changing how designers use exceedance analysis.
Higher DC/AC ratios and clipping-aware P90
DC/AC ratios above 1.3 are common. Designers now run clipped-loss-aware P90 calculations rather than assuming flat inverter efficiency. This matters because clipping changes the shape of the annual distribution. A design with heavy clipping may have a lower P90 than a design with a lower DC/AC ratio, even if P50 is higher.
Bifacial and tracker uncertainty dominates
Bifacial gain and tracker production now make up a larger share of total energy. These gains are also more uncertain. Leading design teams validate albedo, tracking accuracy, and backtracking angles with site-specific data before locking the P90 estimate.
Storage coupling changes the question
Battery energy storage systems (BESS) shift the focus from annual MWh to dispatchable capacity. Probability of exceedance is starting to apply to revenue and arbitrage value, not just energy yield. Designers working on solar-plus-storage projects should model probability distributions for both energy and value.
The relationship between P50 and P90 also shapes investor confidence. As POWER Magazine (2026) notes, investors do not invest in a single production figure. They invest in a range of possible outcomes. A project with a wide P50/P90 spread looks riskier even if the central forecast is attractive.
For teams that want to automate this workflow, solar design software with built-in P50/P90/P99 reporting removes the spreadsheet risk. SurgePV generates probabilistic yield forecasts from hourly simulations, using validated irradiance datasets and documented loss assumptions.
When P90 Matters and When It Does Not
Not every project needs a formal P90 analysis. The table below shows when probability of exceedance is essential and when it is optional.
| Project type | P90 needed? | Why |
|---|---|---|
| Residential rooftop | Usually no | P50 is sufficient for homeowner proposals; P90 is optional for setting expectations |
| Small commercial (under 500 kWp) | Sometimes | Needed if financed through a commercial lender or PPA |
| Large commercial / C&I | Yes | Lenders and investors require P90 for debt sizing and guarantees |
| Utility-scale solar | Yes | P90 is mandatory in independent engineering reports and project finance |
| Off-grid / critical power | Yes, often P99 | Energy shortfall has immediate operational consequences |
| Solar-plus-storage | Yes | Apply exceedance to both energy and revenue/value distributions |
For residential and small commercial projects, designers should still understand probability of exceedance. A homeowner who sees only P50 savings will be disappointed in a cloudy year. Showing a conservative scenario in solar proposals builds trust and reduces support tickets.
How to Read a Yield Report as a Designer
A bankable yield report is more than a P50/P90 summary. Designers should review four sections before signing off on a layout.
1. Irradiance dataset and period
Check which dataset was used and how many years it covers. NSRDB covers most of the United States with satellite-derived data from 1998 onward. Solargis and SolarAnywhere offer global coverage. A report based on fewer than 10 years of data deserves extra scrutiny.
2. Loss assumption table
Every loss factor should be listed with its source. Soiling should reference local conditions or a measurement campaign. Degradation should reference the module datasheet. Availability should reference manufacturer MTBF (mean time between failures) data. Vague labels like “standard losses” are a red flag.
3. Uncertainty breakdown
The report should show the individual uncertainty components and the combined total. If the combined uncertainty is above 10%, identify the largest contributors. Often the fix is a design change, not a modeling change.
4. Sensitivity cases
Good reports include sensitivity analysis for key assumptions: soiling, degradation, availability, and DC/AC ratio. These cases show how much P90 moves if an assumption is wrong. A design that survives sensitivity cases is a design that survives the first year of operation.
For teams that need bankable yield reports without exporting to external consultants, SurgePV’s generation and financial tool produces documented P50/P90 outputs directly from the design model.
Frequently Asked Questions
What is probability of exceedance in solar design?
Probability of exceedance in solar design is a statistical statement about how likely a solar system is to produce at least a specific amount of energy in a given year. P50 means there is a 50% chance annual production will be higher than the stated value and a 50% chance it will be lower. P90 means there is a 90% chance production will meet or exceed the value, making it a conservative, bankable estimate.
How do you calculate P90 from P50 in solar?
P90 is calculated by subtracting 1.282 times the total combined uncertainty from the P50 value. The formula is P90 = P50 − (1.282 × σ_total), where σ_total combines weather variability, irradiance dataset uncertainty, simulation model uncertainty, equipment tolerance, soiling estimates, and degradation assumptions using root-sum-square.
What is a good P90 to P50 ratio for solar projects?
A well-modeled commercial or utility-scale solar project typically has a P90/P50 ratio between 0.88 and 0.94, meaning P90 is 6 to 12% below P50. Ratios above 0.92 indicate low weather variability and high-quality irradiance data. Ratios below 0.88 suggest high uncertainty from limited measurements, variable climates, or aggressive loss assumptions.
Why do solar lenders use P90 instead of P50?
Lenders use P90 because it represents the production level the project is expected to meet or exceed in 9 out of 10 years. Debt service must be covered even in below-average sun years, so P90 provides a safer floor for debt sizing than P50, which leaves a 50% chance of underperformance in any single year.
How can design choices improve a project’s P90?
Designers improve P90 by reducing uncertainty. Effective tactics include running a 12-month on-site pyranometer campaign, choosing validated satellite datasets like Solargis or NSRDB, minimizing shading through layout optimization, selecting proven modules and inverters, validating bifacial albedo assumptions, and using accurate DC/AC ratios and tracker backtracking angles.
Should residential solar proposals include P90?
Formal P90 analysis is usually not required for residential systems. Most homeowner proposals use P50 as the expected production case. However, showing a conservative P90 scenario can set realistic expectations and reduce complaints when an unusually cloudy year occurs.
What is the difference between P90 and P99 in solar?
P90 is the production level exceeded in 90% of years and is used for bank financing and production guarantees. P99 is the production level exceeded in 99% of years and is used for stress testing, insurance pricing, and critical off-grid systems where even a 10% chance of shortfall is unacceptable.
Do bifacial modules and trackers change probability of exceedance?
Yes. Bifacial gain and tracker production depend on variables that are harder to predict than fixed-tilt monofacial systems, including ground albedo, rear-side shading, and backtracking accuracy. If these inputs are not validated with site measurements, they can widen the P50/P90 spread rather than improve bankable yield.
Bottom Line
Solar probability of exceedance is not a finance-only concept. It is a design quality metric. The P90/P50 spread tells you how well the site is understood, how conservative the loss assumptions are, and how much confidence the design deserves.
Three actions will improve your next design:
- Start with the best data you can afford. A 12-month pyranometer campaign often pays for itself through higher P90 and lower financing cost.
- Validate every assumption that adds uncertainty. Bifacial albedo, soiling, shading, and availability are the usual suspects.
- Use software that reports P50/P90 natively. Manual spreadsheet calculations are error-prone and hard to audit. SurgePV’s generation and financial tool produces probabilistic yield forecasts directly from hourly simulations, so your P90 number is traceable from irradiance data to the final report.
Want to see how your current design stacks up at P50, P75, and P90? Book a SurgePV demo and run a probabilistic yield assessment on your next project.
Where this fits
This article is part of SurgePV's Solar Design hub, which works through the topic from first principles to the decisions a project team actually has to make.


