

Quick Answer
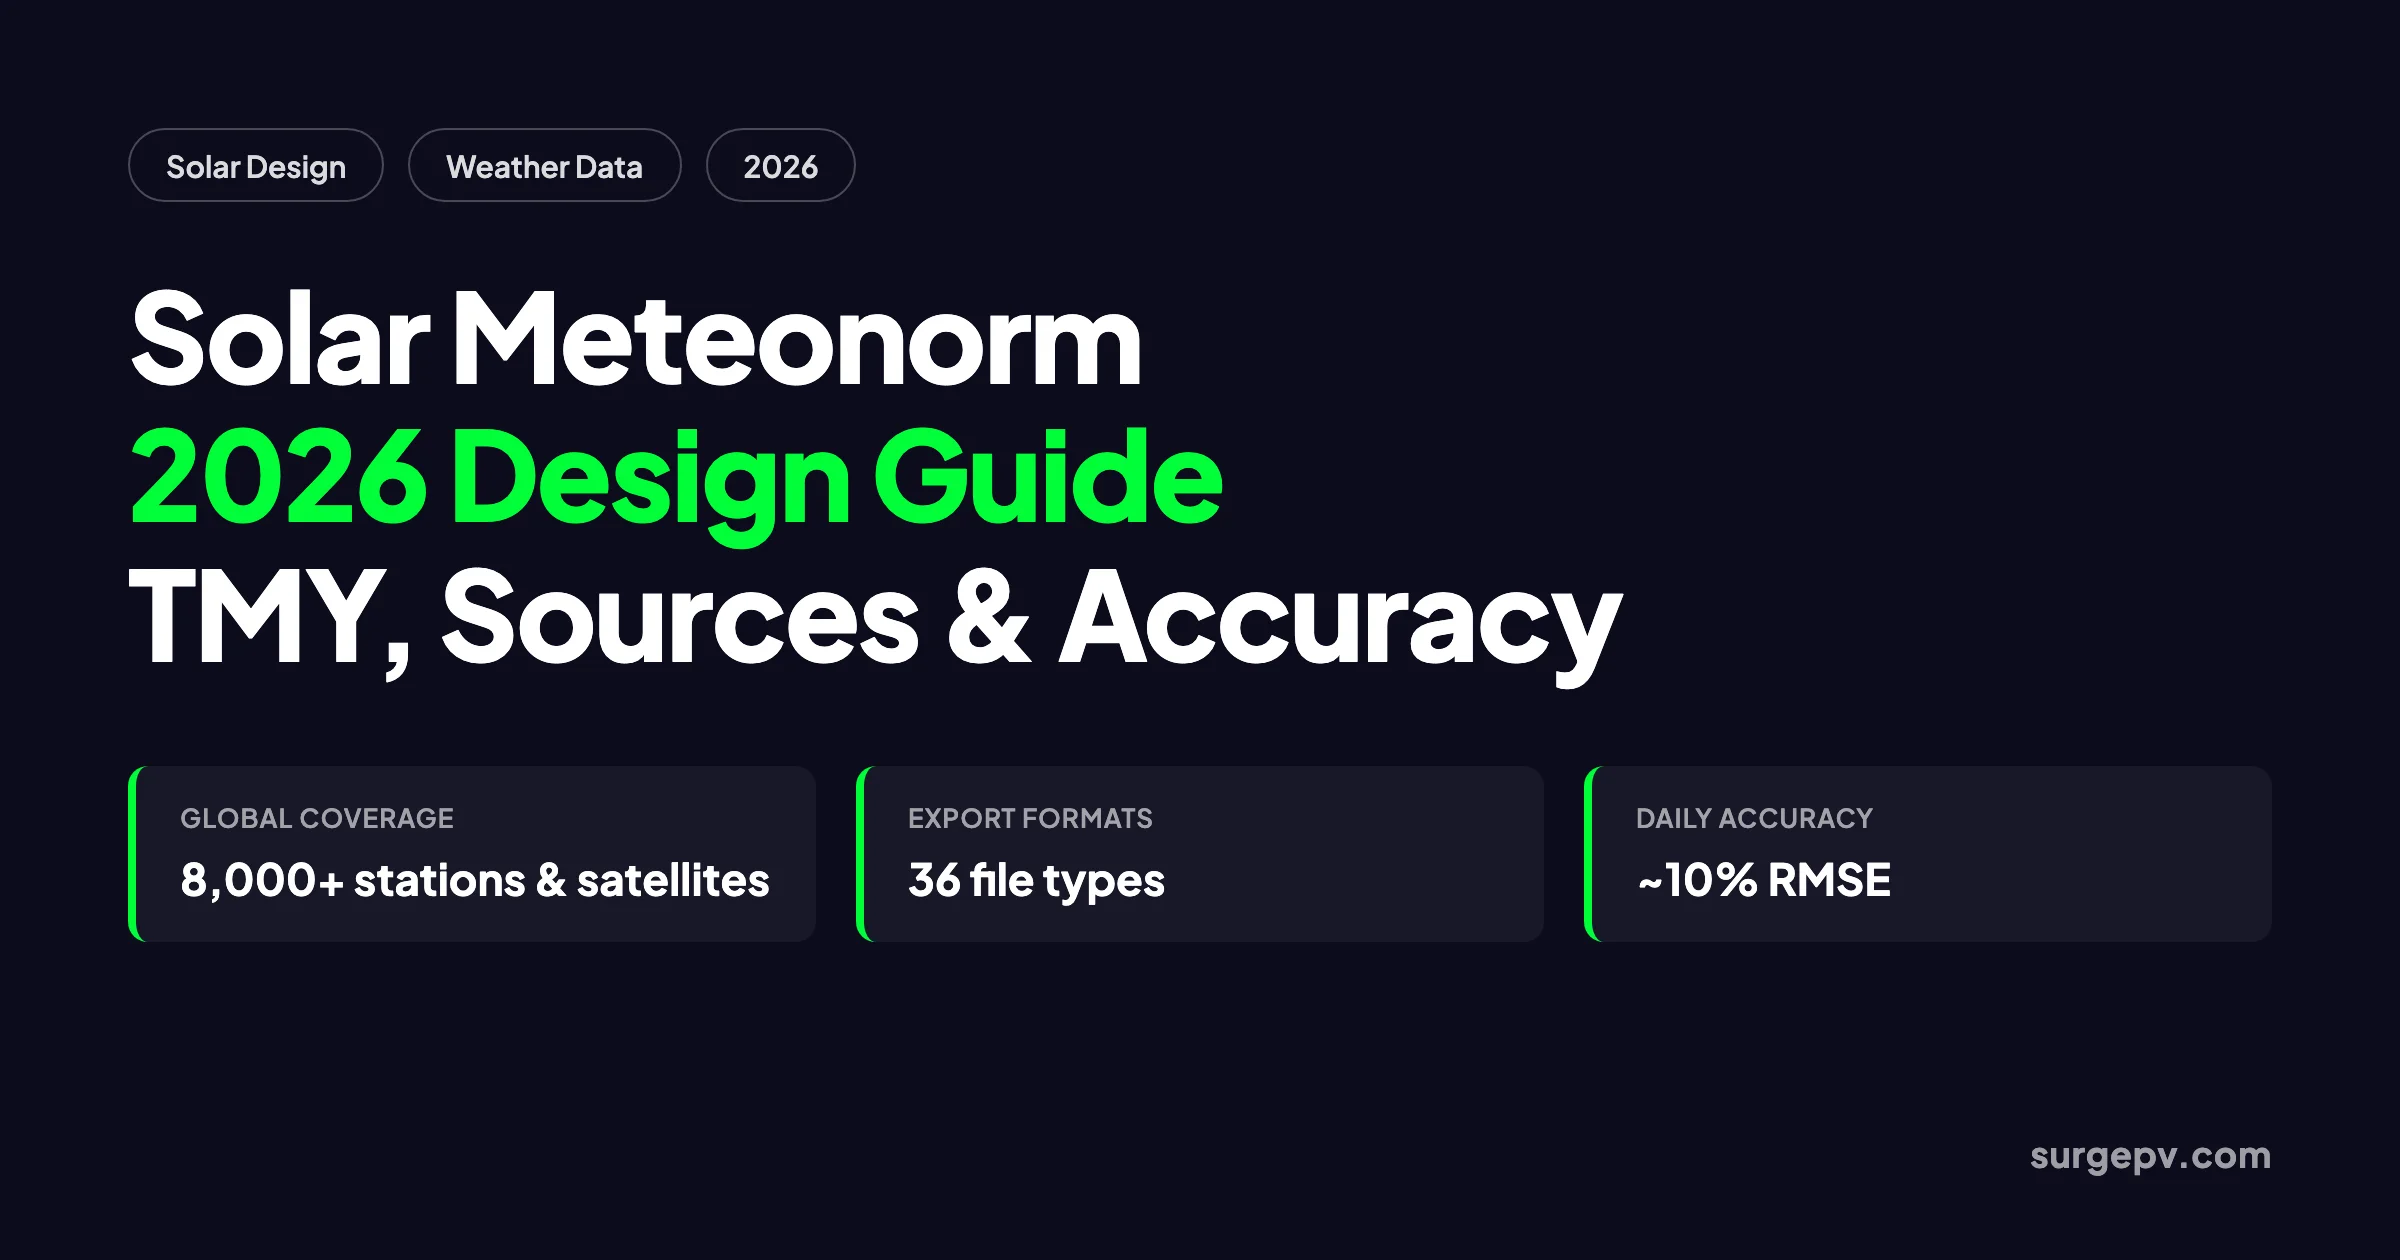
Solar Meteonorm is the use of Meteonorm’s Typical Meteorological Year data in PV design. It combines ground-station records, satellite imagery, and aerosol models to produce hourly weather files for energy-yield modeling at almost any location.
A 10% error in irradiance input becomes roughly a 10% error in annual energy yield. That rule of thumb is why the choice of weather data matters as much as module efficiency or inverter sizing. Meteonorm, developed by Meteotest, is one of the most widely used meteorological databases for solar engineering. It stitches together ground-station records, satellite imagery, and aerosol models to produce Typical Meteorological Year files for almost any location on Earth.
In 2026, the platform has evolved into Meteonorm Climate and Meteonorm Observation. The core idea remains the same: give designers an hourly weather file that represents long-term climate, not a single historic year. But the data period, spatial resolution, and export options have changed. This guide explains what solar Meteonorm is, how it builds a TMY, where its accuracy is strongest and weakest, and how to use it in a modern design workflow — including how SurgePV automates the same weather-data pipeline.
Quick Answer
Solar Meteonorm is the use of Meteonorm’s Typical Meteorological Year data in PV design. It combines ground-station records, satellite imagery, and aerosol models to produce hourly weather files for energy-yield modeling at almost any location.
In this guide:
- What Meteonorm is and why it is a default data source for many solar simulators
- How a Typical Meteorological Year is generated from monthly means
- The data sources behind Meteonorm in 2026: stations, satellites, and aerosols
- The key irradiance, temperature, and environmental parameters it outputs
- Meteonorm 7, 8, and 9: versions, data periods, and API updates
- How Meteonorm compares to PVGIS, SolarGIS, and NSRDB
- Common pitfalls when using TMY data for proposals
- How to import Meteonorm files into PVsyst, SAM, and SurgePV
- How SurgePV automates weather data and design for solar projects
What Is Meteonorm and Why Solar Designers Use It
Meteonorm is a commercial meteorological database built for solar energy, building simulation, and environmental engineering. It was first released in 1985 by Meteotest, a Swiss meteorological consulting company. Today it is used as the default weather source in tools such as PVsyst, PVSOL, Polysun, T*SOL, and many academic workflows.
The product combines measured climate records with interpolation models and satellite-derived irradiance. The output is a consistent set of hourly or sub-hourly values that designers can drop into simulation software. Instead of searching for a local weather station, cleaning missing data, and guessing diffuse fractions, a designer can select a site and receive a ready-made weather file.
According to Meteonorm, the database draws on more than 8,000 weather stations, five geostationary satellites, and a globally calibrated aerosol climatology. That breadth is the main reason engineers reach for it during early-stage design. A single data source covers deserts, tropical coasts, high plains, and northern latitudes.
Meteonorm is not a simulator. It does not size strings, choose inverters, or compute losses. It is a weather-file factory. Its job is to answer one question: what does the local climate look like over a representative year? Once that file is imported into solar design software, the rest of the engineering can begin.
Why TMY data matters
A Typical Meteorological Year is not a prediction for next year. It is a synthetic year built to represent the long-term average climate. Banks, utilities, and EPCs use TMYs because they smooth out unusual weather and give a stable baseline for financial models. A proposal based on a TMY should be close to the multi-year average production. It will not match any single real year exactly.
How Meteonorm Builds a Typical Meteorological Year
The process starts with long-term monthly averages, not raw hourly measurements. Meteonorm collects monthly means for global radiation, temperature, humidity, precipitation, wind speed, and other parameters from nearby weather stations. Where station coverage is sparse, it blends in satellite-derived irradiance.
Next, a stochastic weather generator creates an hourly time series that preserves the statistical properties of the monthly averages. The result is 8,760 hourly values per parameter for a full year. This synthetic year is what engineers call a TMY. It is not the average of 20 years of data. It is a stitched-together sequence of months that each look typical for the site.
The distinction matters. If you simply averaged every January from 2000 to 2020, you would smooth away day-to-day variability and extreme events. A TMY keeps realistic cloud sequences, temperature swings, and diurnal patterns. That is why it produces more believable inverter clipping, battery cycling, and shading losses than a plain average would.
Meteonorm’s method is described in its theory documentation. The document explains how ground and satellite data are merged, how interpolation is corrected for altitude and distance, and how the stochastic generator produces hourly values from monthly inputs.
From monthly means to hourly values
The weather generator does three things:
- Preserve monthly statistics. The generated month has the same mean radiation and temperature as the long-term average.
- Preserve daily patterns. Clear and cloudy days appear in realistic sequences.
- Preserve correlations. Temperature, humidity, wind, and radiation vary together in physically plausible ways.
The result is a file that looks like a real year even though no single historical year matches it exactly.
Meteonorm Data Sources in 2026: Ground Stations, Satellites, and Aerosols
Solar Meteonorm in 2026 sits on three legs: ground-station archives, geostationary satellites, and a global aerosol climatology.
Ground-station archives
The backbone is the Global Energy Balance Archive, plus national networks such as MeteoSwiss, the German Weather Service, and the Baseline Surface Radiation Network. These sources provide long-term monthly means of radiation, temperature, precipitation, wind, and humidity. Where a quality station sits close to the project site, the interpolated result is usually most reliable.
Meteonorm’s theory documentation notes that interpolation accuracy for yearly global radiation has a root mean square error of around 6.8% in cross-validation. The error is smaller in Europe and larger in regions with fewer stations.
Satellite data
For locations far from weather stations, Meteonorm uses data from five geostationary satellites. The Observation product, documented by Meteonorm Observation, covers latitudes from 60°S to 60°N with best quality inside the geostationary disk. Standard spatial resolution is 0.0625°, or roughly 5–7 km. High-resolution imagers over North America and Europe push this to about 2–3 km.
The same page publishes the following typical accuracy for satellite-based global radiation:
| Time resolution | Typical relative RMSE |
|---|---|
| Hourly | ~20% |
| Daily | ~10% |
| Monthly | ~5% |
These numbers are comparable to the 5–10% uncertainty of well-maintained ground pyranometers. The advantage of satellites is coverage. The disadvantage is higher error in complex terrain, at high latitudes, and in snow-covered areas where satellites struggle to distinguish clouds from bright ground.
Aerosol climatology
Aerosols reduce direct-beam irradiance and increase diffuse light. Meteonorm uses the globally calibrated gridded aerosol dataset by Chris Gueymard. The climatology covers 2000–2015 with a spatial resolution of 0.5°. In regions with heavy dust, smoke, or urban haze, this layer has a large influence on DNI and therefore on tracking-system yield.
Key Output Parameters Every Designer Should Understand
Meteonorm outputs more than 30 parameters. For PV design, these are the ones that matter most:
| Parameter | Symbol | Why it matters |
|---|---|---|
| Global Horizontal Irradiance | GHI | Total solar radiation on a horizontal surface; the starting point for most yield calculations |
| Direct Normal Irradiance | DNI | Beam radiation perpendicular to the sun; critical for trackers and CPV |
| Diffuse Horizontal Irradiance | DHI | Scattered radiation on a horizontal surface; dominates on cloudy days |
| Global Tilted Irradiance | GTI / POA | Radiation on the actual panel tilt and azimuth; what modules see |
| Ambient temperature | T_amb | Drives module temperature and therefore power and degradation |
| Wind speed | v_wind | Affects module cooling and structural loads |
| Albedo | α | Determines ground-reflected radiation, especially for bifacial modules |
| Atmospheric pressure | P_atm | Used for altitude corrections and air-mass models |
| Precipitable water / aerosols | - | Influence spectral response and DNI |
GHI is the most commonly reported value, but it is not what the array receives. The design software converts GHI to plane-of-array irradiance using a transposition model such as Perez or Hay-Davies. That conversion introduces its own uncertainty, so the quality of the raw GHI/DNI split still matters.
Temperature is equally important. A module in a hot climate produces less voltage and power than the same module in a cool climate, even with identical irradiance. Meteonorm provides hourly ambient temperature, which simulators combine with mounting type, wind speed, and irradiance to estimate cell temperature.
Solar Meteonorm in 2026: Versions, Data Periods, and API Updates
Meteonorm has moved through several major releases. In 2026, users encounter versions 7, 8, and 9 depending on the software license or API endpoint.
Meteonorm 7 and 8
Meteonorm 7 was widely embedded in third-party tools. It introduced stochastic generation of hourly values from monthly means and expanded satellite coverage. Meteonorm 8 added historical time series, a larger station archive, and improved interpolation. According to Meteonorm Climate, the standard data periods are:
- 1996–2015 for irradiation data
- 2000–2019 for all other meteorological parameters
Historical hourly values of irradiation and temperature are available from 2010 onward and are continuously updated.
Meteonorm 9 and the API
Meteonorm 9 is the current algorithmic generation behind the Meteonorm API. The API changelog shows regular updates through early 2026, including version 9.0.4 in February 2026. Key additions include:
- An
/climate/amyendpoint for Actual Meteorological Years from 2020 onward - An
/observation/historicalendpoint for historical observations from 2020 onward - Extreme-year settings such as P10, P90, and worst-case year
- Additional export formats including PVsyst, PVSOL, Polysun, EPW, and CSV
Third-party design platforms are beginning to adopt Meteonorm 9 data by default. For example, archelios PRO v2025.1 switched to Meteonorm 9 and cited more than 4,000 TMY stations, according to a Trace Software release note.
Data freshness plan
Three things in this guide are likely to date within 12 months:
- The exact Meteonorm API version and changelog entries
- The number of stations included in Meteonorm 9
- The default data periods, which Meteonorm updates as new records become available
The underlying concepts — TMY generation, ground-satellite blending, and irradiance uncertainty — are evergreen.
Meteonorm vs PVGIS, SolarGIS, and NSRDB: When to Use Which
No single weather database is best everywhere. The right choice depends on location, project phase, budget, and whether the data needs to be bankable.
| Source | Type | Strengths | Best for |
|---|---|---|---|
| Meteonorm | Commercial | Broad global coverage; 36+ export formats; long track record; climate-change scenarios | Early design, international portfolios, building simulation |
| SolarGIS | Commercial | High spatial resolution; strong validation; low annual bias | Bankable yield assessments, utility-scale projects, complex terrain |
| PVGIS | Free | Free; easy web interface; covers Europe, Africa, and parts of Asia | Residential and small commercial feasibility |
| NSRDB | Free | High-quality ground and satellite data; widely accepted in the U.S. | U.S. projects, financing, and research |
A 2024 study by Riise et al. in Solar Energy benchmarked six solar irradiance products against 34 ground stations in Norway. The authors found that Meteonorm had lower accuracy at higher latitudes, with a median relative mean absolute error 9.4 percentage points higher than geostationary-satellite products such as PVGIS SARAH-2 and Solargis. Snow cover and local topography were the main drivers of error.
A 2023 comparison of Meteonorm 7.2 and SolarGIS at a 10 MW plant in Dhaka, published in the International Journal of Applied Engineering and Technology, reported annual GHI errors of 3.01% for Meteonorm and 0.36% for SolarGIS. Energy-yield prediction errors were 14.93% and 10.32% respectively. One study at one site does not settle the debate, but it illustrates the gap that can appear in humid, low-latitude climates.
A data-backed opinion
For residential and small commercial proposals, Meteonorm and PVGIS are usually close enough. For utility-scale financing or projects in high-latitude, mountainous, or snow-prone regions, it is worth buying site-specific data from a provider with published validation for that region. The cost of better data is small compared with the value of a few percentage points of production accuracy on a multi-megawatt project.
Common Pitfalls and Misconceptions When Using Meteonorm
Even good data can be misused. Here are the most common mistakes we see in project files.
Treating a TMY as a forecast
A TMY represents long-term average climate. It will not match production in any single year. If a client asks, “Will my system produce exactly 12,000 kWh next year?” the honest answer is no. The TMY gives the expected average over many years. Real annual production will vary by 5–15% depending on weather.
Ignoring spatial resolution
Meteonorm’s satellite grid is 5–7 km by default. A coastal site, an urban heat island, or a mountain valley can have microclimates that differ from the grid cell average. If the project sits in complex terrain, compare Meteonorm’s annual GHI against local measurements or a higher-resolution product.
Forgetting the version number
Meteonorm 7, 8, and 9 use different station archives, satellite models, and data periods. Two engineers can get different GHI values for the same coordinates if they use different versions. Always record the version, data period, and source mix when documenting a design.
Assuming irradiance is the only uncertainty
A perfect weather file still leaves model uncertainty in transposition, soiling, temperature, shading, and degradation. A bankable study should report uncertainty from all sources, not just the weather data. According to Meteonorm features, the software displays uncertainty information transparently for each dataset.
Overlooking high-latitude and snow effects
Satellite algorithms struggle to separate snow from clouds. In Scandinavia, the Alps, or high plains with seasonal snow, Meteonorm can underestimate winter reflection or overestimate spring albedo. A local albedo measurement and a ground-station check reduce this risk.
How to Import Meteonorm Data into Your Solar Workflow
Using Meteonorm in practice follows a simple sequence. The exact clicks depend on whether you use the desktop software, the API, or a design tool with Meteonorm built in.
Step 1: Define the location
Enter latitude and longitude or pick the nearest station. If the site is far from a station, Meteonorm will interpolate or switch to satellite data. Check the distance to the nearest station and the elevation difference.
Step 2: Choose the data period and scenario
Select a TMY for long-term yield, an AMY for a specific recent year, or a future scenario for climate-change analysis. For most proposals, the standard TMY is the right choice.
Step 3: Select the output format
Meteonorm supports more than 36 formats. The most common for solar are:
- PVsyst — directly importable into PVsyst
- CSV — generic columnar data for spreadsheets or custom scripts
- TMY2 / TMY3 — standard U.S. weather-file formats
- EPW — EnergyPlus weather format, used in building simulation
- SAM — for NREL’s System Advisor Model
Step 4: Sanity-check the annual totals
Before running a full simulation, compare the Meteonorm annual GHI and DNI against published solar maps or a second data source. A large unexplained difference is a warning sign.
Step 5: Import into your simulator
Load the file into PVsyst, SAM, PVSOL, or SurgePV. Verify that the time zone, latitude, and elevation match the project site. Then run the shade model, define the array, and check the plane-of-array irradiance.
How SurgePV Automates Weather Data and Design
Meteonorm is a powerful input. SurgePV turns that input into a complete design, proposal, and financial model.
The solar simulation software starts with a site address or satellite outline. It pulls location-specific weather data, computes hourly solar positions, and converts GHI to plane-of-array irradiance using validated transposition models. Shadow analysis traces the direct beam across the roof or array and accounts for row-to-row shading, obstructions, and diffuse-sky blockage.
The solar financial modeling takes those hourly production values and builds cash flows, payback, and net-present-value estimates. For teams that want to accelerate early layout and string sizing, Clara AI automates the first-pass design.
SurgePV also includes free calculators that complement Meteonorm-based studies:
- The system size calculator turns annual GHI and energy target into a rough kWp estimate.
- The panel layout estimator helps you place modules on a roof before importing a full weather file.
- The solar savings calculator translates production forecasts into customer-facing savings numbers.
A typical workflow looks like this:
- Import the site address or satellite outline into SurgePV.
- The platform selects the nearest quality weather file and calculates hourly solar position.
- GHI is decomposed into DNI and DHI, then transposed to the actual module tilt and azimuth.
- Shade and incidence-angle models trim the available irradiance.
- The financial model turns the hourly production into an annual kWh forecast and a customer-ready proposal.
For projects that need detailed engineering deliverables or permit-ready drawings, Heaven Designs provides solar design and engineering consultancy services including PE-stamped permit design.
Try it on your next project
If you are still copying weather files between tools and rebuilding layouts by hand, you are losing time and increasing the chance of mismatched inputs. Book a demo to see how SurgePV ties location-specific weather data, 3D layout, shading, and financial modeling into one workflow.
Solar Meteonorm 2026 FAQ
What is solar Meteonorm used for?
Solar Meteonorm refers to the use of Meteonorm Typical Meteorological Year data in photovoltaic design. It provides hourly values of solar irradiance, temperature, wind, and other parameters so designers can estimate annual energy yield, size inverters, and model system performance for a specific site.
What is the difference between a TMY and an AMY in Meteonorm?
A Typical Meteorological Year is a statistically representative synthetic year stitched together from long-term monthly data. An Actual Meteorological Year is a historical time series for a specific recent year, based on satellite observations and reanalysis. TMYs are used for standard long-term yield estimates; AMYs are used for performance comparisons and operational analysis.
How accurate is Meteonorm solar data?
Accuracy depends on region and time resolution. Meteonorm’s satellite-based Observation product quotes relative RMSE of about 20% for hourly values, 10% for daily values, and 5% for monthly values. Independent validation of earlier satellite datasets in Europe and Africa found hourly relative RMSE between 12% and 25%. High-latitude and snow-affected sites show larger errors.
Is Meteonorm free to use?
No. Meteonorm is a commercial product sold by Meteotest as licensed software, an API, and a DLL. Some third-party design tools include Meteonorm data under their own license, but direct access requires a subscription or software purchase.
Which is better for solar design, Meteonorm or SolarGIS?
There is no universal winner. SolarGIS generally shows lower bias in published validation studies and finer spatial resolution, but it is also commercial. Meteonorm offers broad global coverage, flexible export formats, and long data records. The best choice depends on project location, budget, and whether you need site-specific bankable data.
What file formats does Meteonorm export?
Meteonorm supports more than 36 export formats. Common options include CSV, TMY2, TMY3, EPW, PVsyst, PVSOL, Polysun, SAM, and TRY. This makes it compatible with most energy-modeling and building-simulation tools.
Does Meteonorm include future climate scenarios?
Yes. Meteonorm includes climate-change projections based on IPCC scenarios. Users can generate future TMY files for decades through 2100, which is useful for long-term asset planning and stress-testing energy yields.
Can Meteonorm data be imported into PVsyst?
Yes. Meteonorm exports a dedicated PVsyst format. You can also export generic CSV or TMY files and import them into PVsyst, SurgePV, SAM, PVSOL, or other solar design platforms that accept standard weather-file formats.
What to Do Next
- Audit your current weather-data source. Record the version, data period, and distance to the nearest station for your last three projects.
- Cross-check Meteonorm annual GHI against a second dataset such as PVGIS or SolarGIS, especially for sites outside Europe or in complex terrain.
- Run the same project in SurgePV to see how automated weather-data handling, shading analysis, and financial modeling reduce manual file handling and mismatch risk.
Where this fits
This article is part of SurgePV's Solar Design hub, which works through the topic from first principles to the decisions a project team actually has to make.


