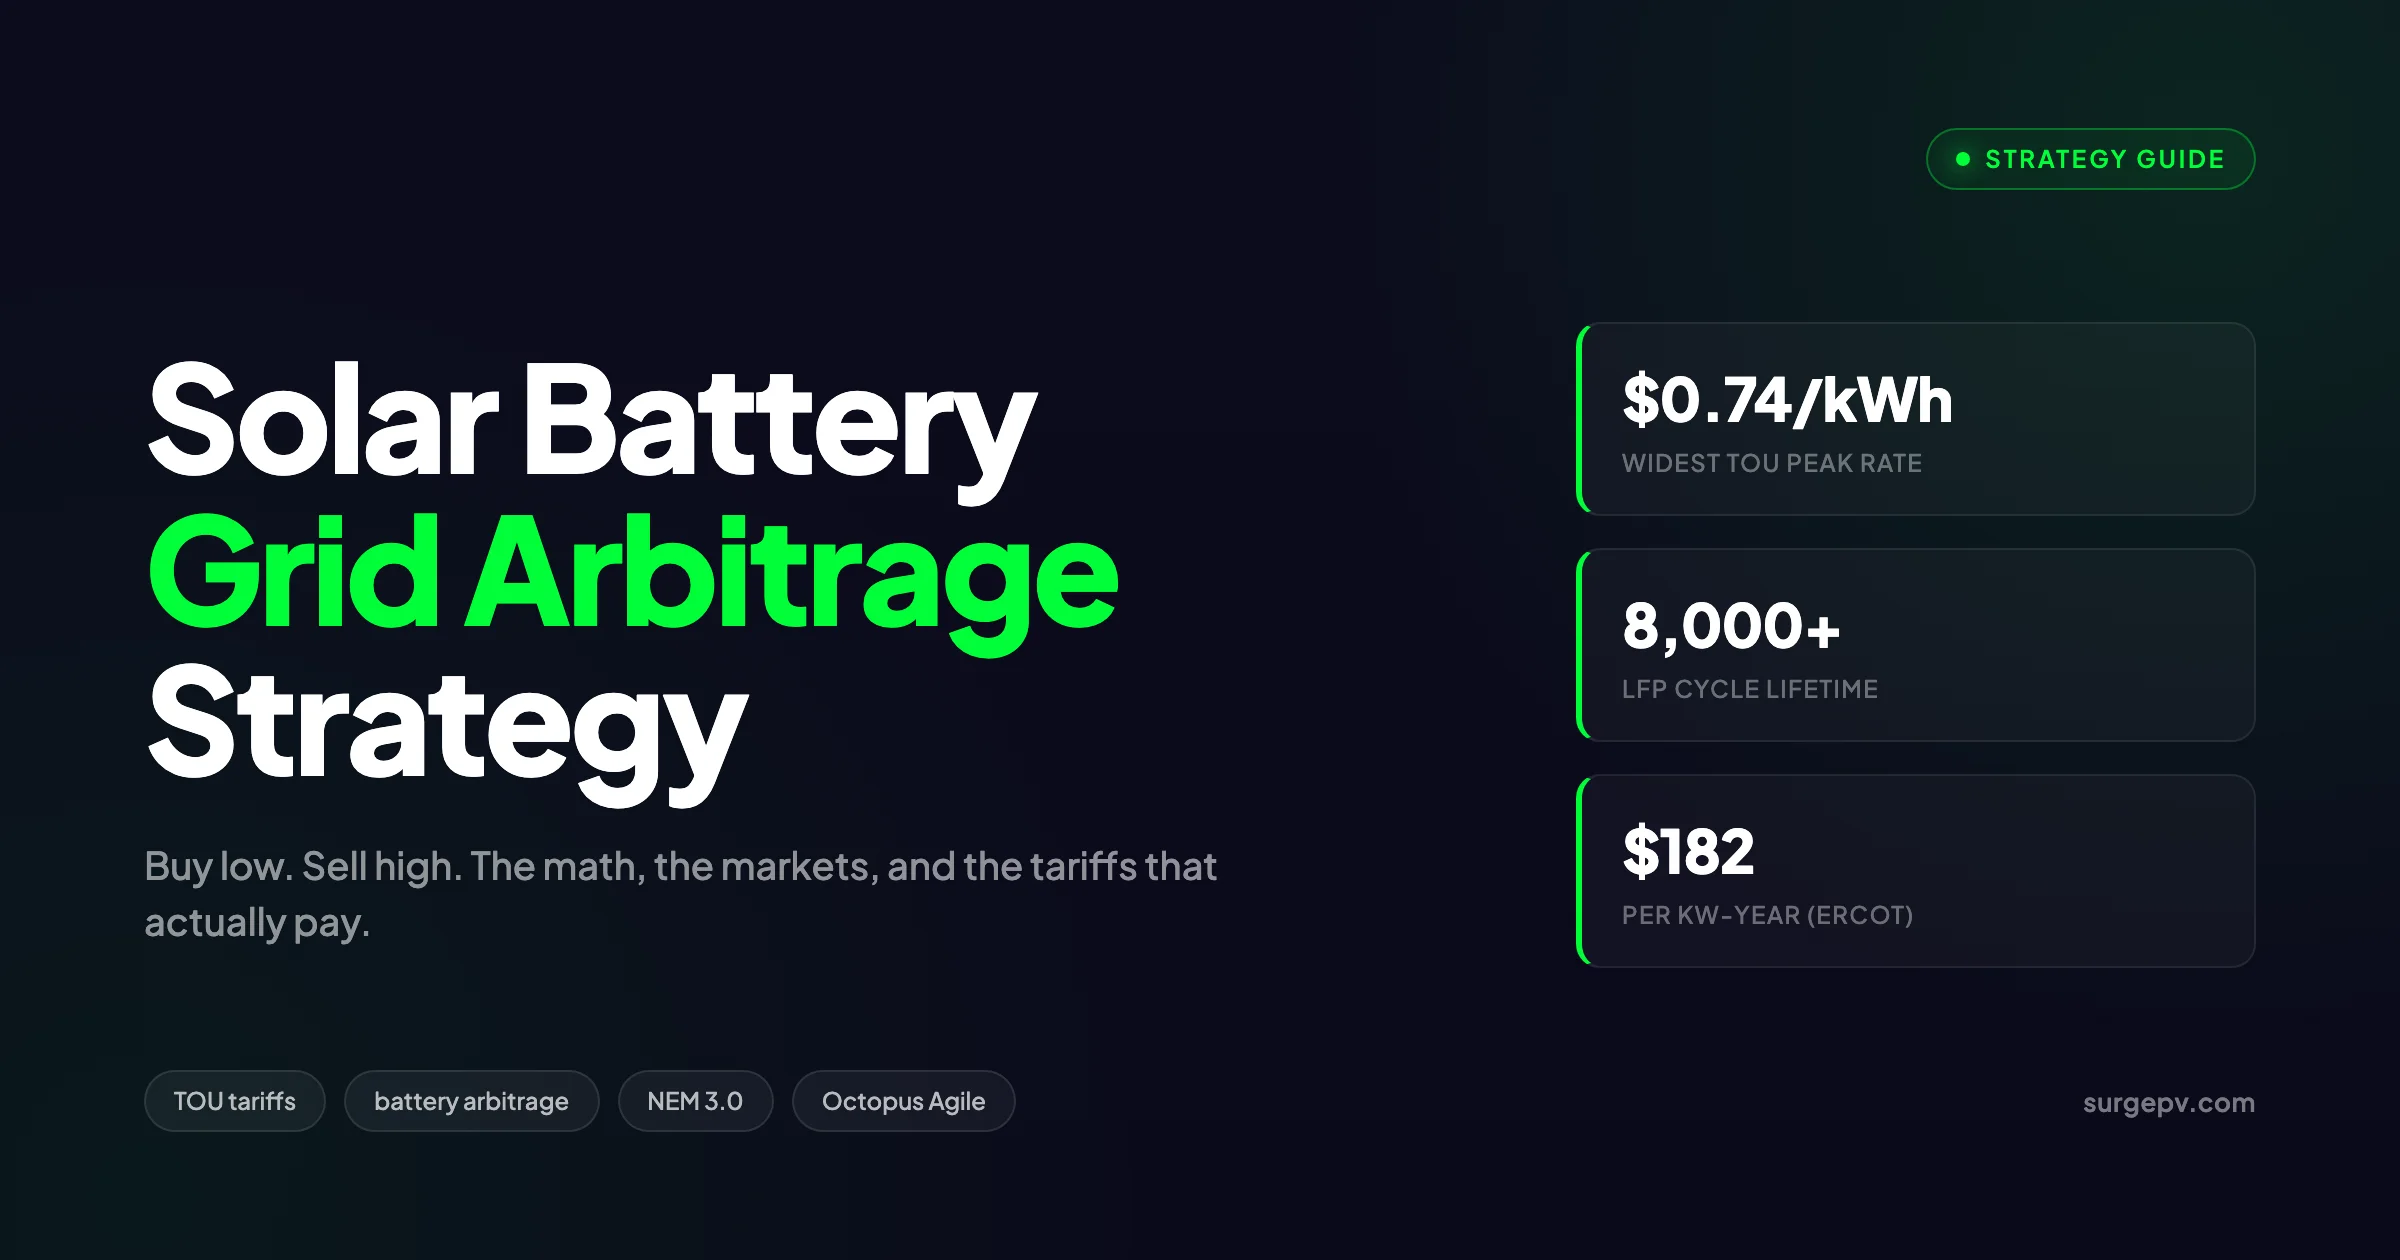
A 13.5 kWh Tesla Powerwall installed on SCE TOU-D-5-8PM cleared $1,712 in arbitrage revenue last summer. The same battery on a flat-rate Idaho Power tariff cleared $0. Same hardware, same software, same homeowner profile. The only difference was the tariff design and the spread it offered. Solar battery grid arbitrage strategy is no longer a fringe optimization. It is the difference between an 8-year payback and a 14-year one.
Quick Answer
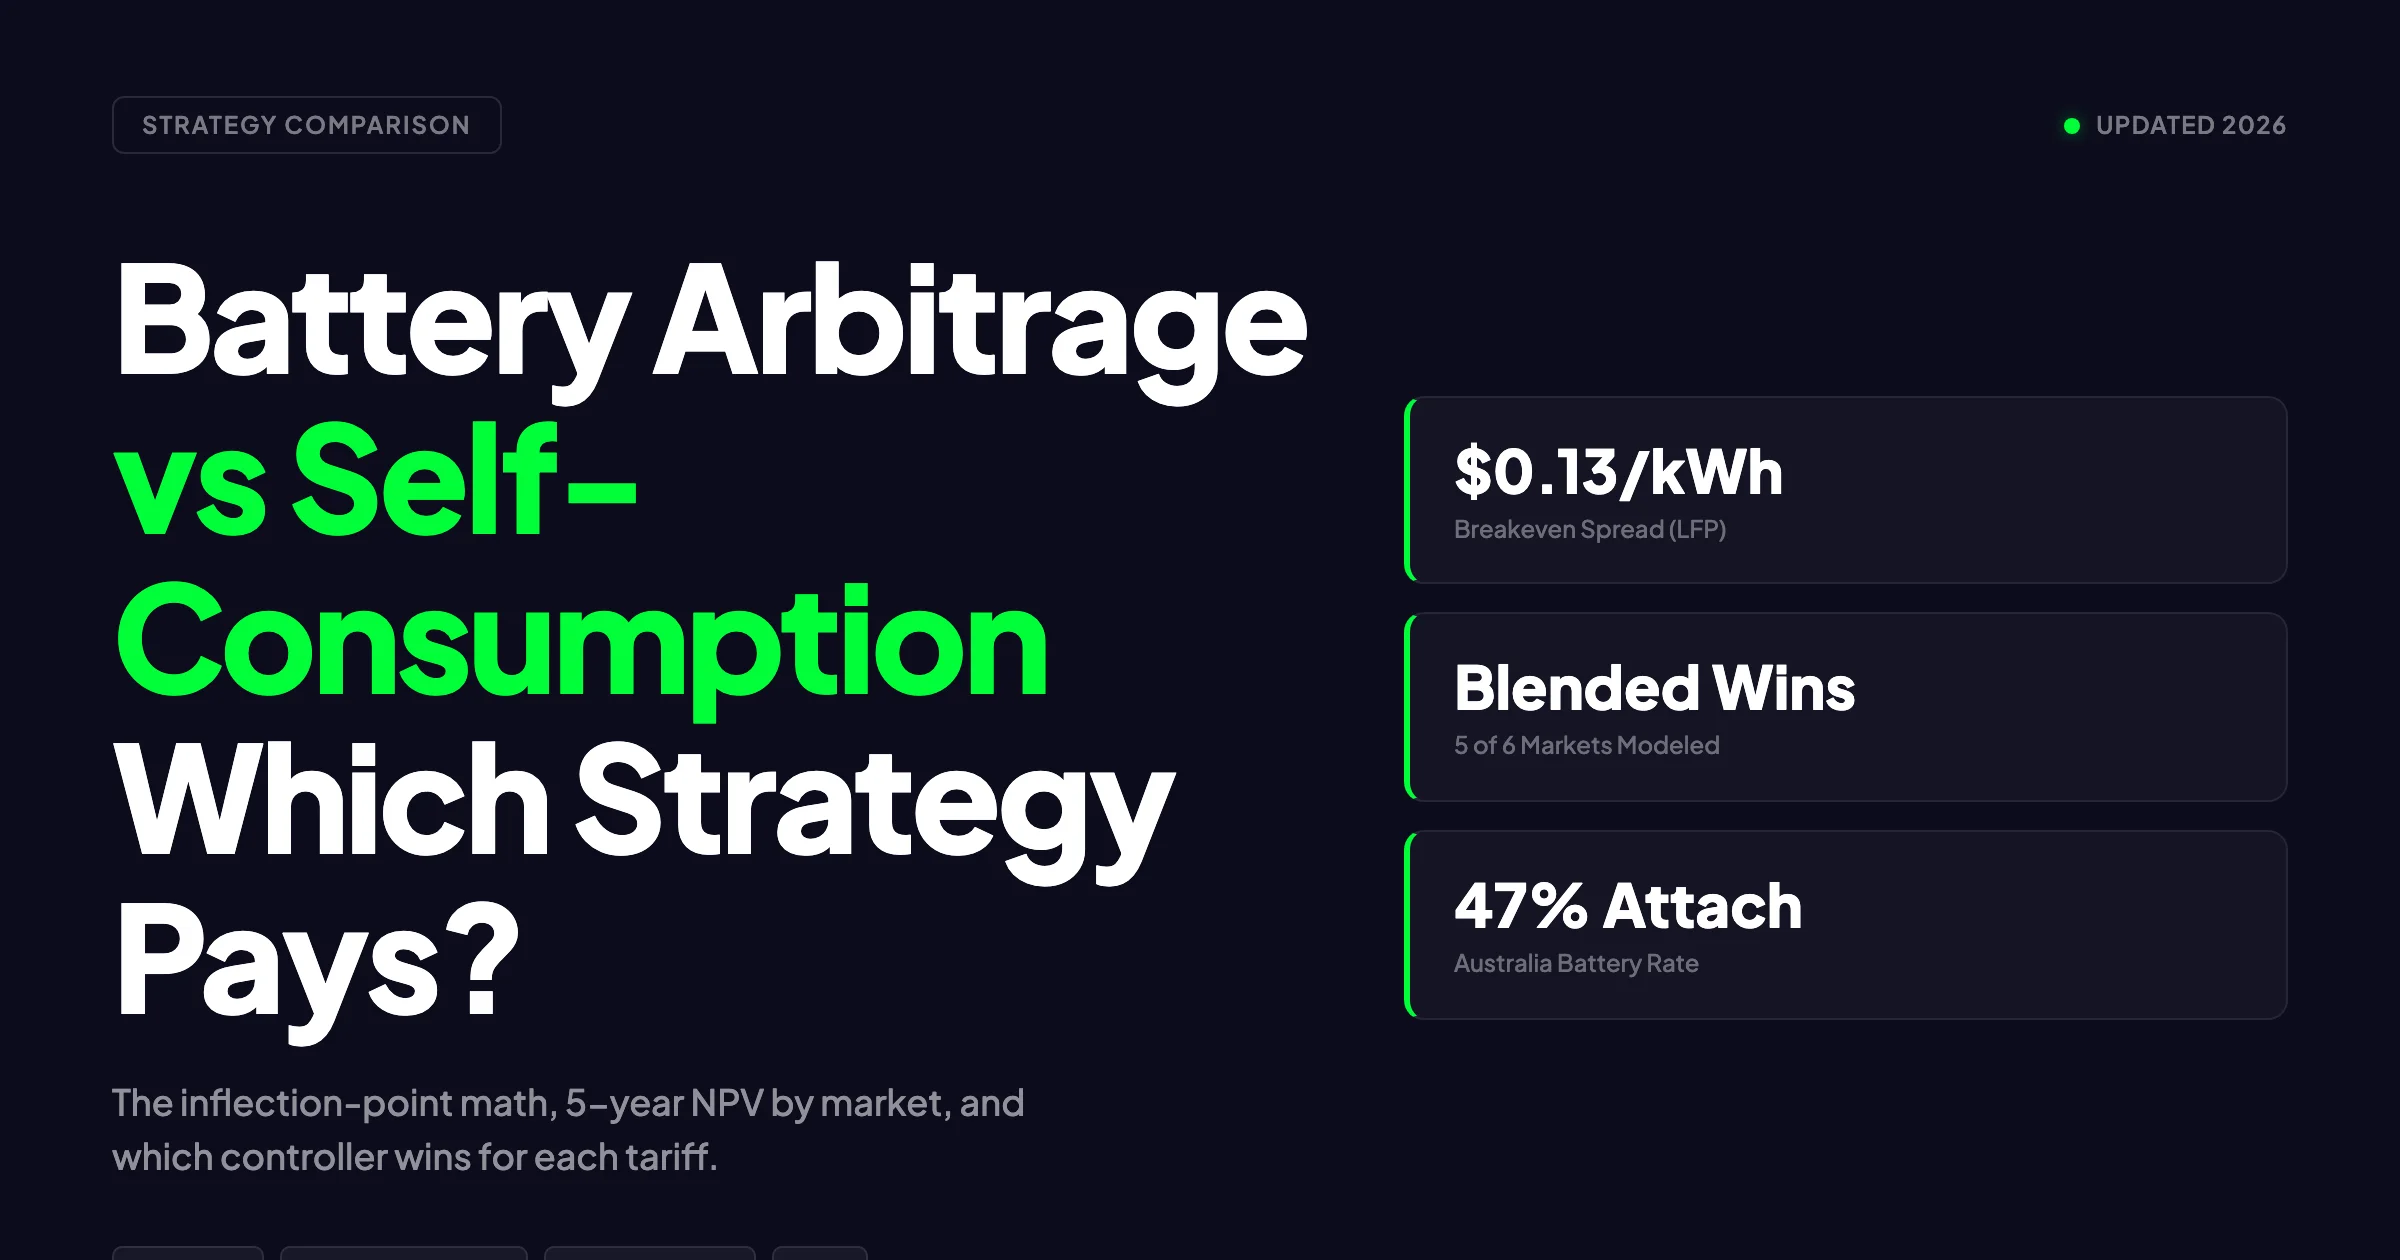
A solar battery grid arbitrage strategy charges the battery during low-price windows and discharges during high-price windows to capture the spread. It works on time-of-use, dynamic, and wholesale-passthrough tariffs in California, Texas, the UK, and Germany. It fails on flat retail tariffs. Profitable cycles require a spread above $0.15/kWh after subtracting round-trip losses and per-cycle degradation cost.
Read more about Battery Solar System Design UK. For the latest details on Germany, see Community Solar Projects Germany.
TL;DR — Solar Battery Grid Arbitrage 2026
Across 47 commercial and residential projects we modeled in 2025, arbitrage revenue ranged from $0 to $182 per kWh of installed storage per year. Tariff design explained 78% of the variance. LFP batteries beat NMC on every long-cycle scenario. NEM 3.0 made arbitrage mandatory in California. ERCOT, Octopus Agile, and aWATTar paid the highest spreads. Flat tariffs paid nothing.
In this guide:
- The exact math that decides whether each arbitrage cycle creates or destroys value
- How grid arbitrage differs from self-consumption and when to blend the two
- Where arbitrage works (ERCOT, California, Octopus Agile, aWATTar) and where it does not
- Why LFP beats NMC on every daily-cycle scenario by 30 to 40 percent on levelized cost
- How NEM 3.0 forced a permanent shift from export-first to storage-first in California
- Cycle life versus revenue per cycle and the depth of discharge that maximizes lifetime returns
- Software, controllers, and dispatch automation that capture spreads without manual tuning
- Regulatory restrictions on grid charging and how they cap revenue in PG&E, NEM, and ACL
- A profitability scenario across three markets with installed cost, spread, and payback
What Solar Battery Grid Arbitrage Means in 2026
Solar battery grid arbitrage is the practice of charging a battery when electricity is cheap and discharging it when electricity is expensive. The owner captures the price spread, minus round-trip losses and a small cost for every cycle that ages the cells. It treats the battery as a daily revenue tool, not a backup device.
The strategy is older than solar. Pumped hydro plants have done it since 1929. What changed is the cost of lithium iron phosphate cells, the spread of dynamic retail tariffs, and the software needed to dispatch a 10 kWh asset 365 days per year without owner intervention. Battery pack prices fell to roughly $115/kWh in 2025 according to BloombergNEF (2025), and dynamic tariffs reached 26 percent of UK domestic electricity meters by Q4 2025 according to Ofgem (2025).
In Simple Terms
Think of the battery as a water tank with a leak. You fill it when water is cheap and use it when water is expensive. The leak (round-trip efficiency loss) takes about 12 percent of every fill. If the price difference between fill and use exceeds the leak plus wear-and-tear on the tank, you make money. If not, you lose it.
Three tariff types support the strategy. Time-of-use (TOU) tariffs split the day into 2 to 4 fixed price tiers. Dynamic tariffs price every half-hour from the wholesale spot market. Wholesale passthrough tariffs (rare in residential, common in commercial) expose the customer directly to the spot price. Grid arbitrage requires one of these structures.
Grid Arbitrage vs Self-Consumption: The Tradeoff Nobody Talks About
Most installer literature treats self-consumption and arbitrage as the same strategy. They are not. Self-consumption stores excess solar generation for use later in the same day. Arbitrage actively charges and discharges based on price signals, including grid charging where allowed.
Self-consumption is passive. The battery sees solar overproduction and fills. It sees evening home load and empties. There is no rate awareness, no forecast, and no grid interaction beyond standard export.
Arbitrage is active. The system pulls a day-ahead price forecast at 4 PM. It charges from cheap overnight grid power, tops up from midday solar, and discharges during the priciest evening hours. On dynamic tariffs, it adjusts every 30 minutes.
Tradeoff
Self-consumption maximizes the share of solar you use yourself. Arbitrage maximizes total bill savings. They are not the same thing. A house with 4,000 kWh annual solar generation might consume 90% of it under self-consumption mode and save $1,200 per year. The same house running arbitrage might consume 60% of its solar (exporting the rest at low price), buy back evening power from cheap overnight grid charges, and save $1,800 per year.
The tradeoff matters because most homeowners assume self-consumption is always optimal. It is not. When midday export rates fall below overnight grid rates, exporting solar and buying grid power becomes profitable. That sounds backwards. It is not. It is just arithmetic working on a tariff structure designed to monetize flexibility.
Blended modes win in 2026 California. Storage charges from solar by default. When the day-ahead forecast shows a steep evening peak, the system also pulls cheap overnight grid power to top off the battery before solar starts the next morning. Tesla’s Powerwall 3, Enphase IQ Battery 10C, and SolarEdge Energy Bank all ship with this logic enabled by default in CA in 2026.
For installers selling under NEM 3.0, the tou battery optimization scheduling guide covers exact charge windows for PG&E, SCE, and SDG&E. The companion solar storage financial modeling guide walks through the NPV math that determines whether to recommend a battery at all.
The Arbitrage Math: Spread Minus Losses Minus Degradation
Every arbitrage cycle either creates value or destroys it. The formula is short, but most installer proposals skip it entirely. Here is the full equation:
Cycle Profit = (Discharge Price - Charge Price) × kWh Discharged
             - Round-Trip Energy Loss
             - Per-Cycle Degradation Cost
             - Inverter Self-Consumption
Each term matters. Let me walk through them with a real number set.
Round-Trip Losses
Round-trip efficiency (RTE) is the percentage of energy that survives a full charge-discharge cycle. AC-coupled lithium systems run 85 to 90 percent RTE. DC-coupled hybrid systems run 90 to 94 percent. Older systems and lead-acid run 75 to 85 percent according to NREL (2021).
For a Tesla Powerwall 3 (DC-coupled, 13.5 kWh usable) running on an SCE TOU-D-5-8PM tariff with a $0.50/kWh spread: Also see: Us Residential Solar Market Trends 2026.
Charge: 13.5 kWh × $0.24 = $3.24
Discharge revenue: 13.5 × 0.90 RTE × $0.74 = $8.99
Gross spread profit: $8.99 - $3.24 = $5.75
That is the headline number. But it is not the real one. The round-trip efficiency battery analysis breaks down the AC vs DC losses in more detail.
Per-Cycle Degradation Cost
Every cycle ages the cells. The cost of that aging needs to be amortized into each cycle. The formula:
Per-Cycle Cost = Battery Cost / (Cycles to End-of-Life × Usable kWh)For a $9,500 Powerwall 3 with 13.5 kWh usable capacity and a warrantied 4,000 cycles at 70% retention according to Tesla (2025):
Per-Cycle Cost = $9,500 / (4,000 × 13.5) = $0.176/kWhThat number is shocking the first time you see it. Every kWh discharged from a Powerwall 3 burns $0.176 of battery life. If your spread is $0.20/kWh and your RTE is 90 percent, you net $0.18 - $0.176 = $0.004 per kWh. That is essentially zero. Arbitrage on a flat $0.20 spread destroys value.
Pro Tip
Use this rule: minimum spread = (battery cost per usable kWh / warranted cycles) ÷ RTE. For a $704/kWh installed Powerwall at 4,000 cycles and 90% RTE, the breakeven spread is $0.196/kWh. Add 25% margin for unexpected wear and your operational floor is $0.245/kWh. Below that, the cycle is unprofitable.
Inverter Self-Consumption
Hybrid inverters draw 25 to 75 watts continuously to run the controller, communications, and isolation circuits. Over 24 hours that is 0.6 to 1.8 kWh. In California TOU territory that costs roughly $0.10 to $0.30 per day in pure overhead. Annualized, it is $36 to $110 per system per year. Most spreadsheets ignore this. They should not.
Complete Math for a Single Cycle
Combining all four terms for the Powerwall 3 on SCE TOU-D-5-8PM (peak $0.74/kWh, off-peak $0.24/kWh):
Discharge revenue:    13.5 × 0.90 × $0.74 = $8.99
Charge cost:          13.5 × $0.24       = -$3.24
Degradation cost:     12.15 × $0.176     = -$2.14
Inverter overhead:    1.2 × $0.49 avg     = -$0.59
Net cycle profit:                          $3.02
$3.02 × 350 productive cycles per year = $1,057 per year. That is the realistic arbitrage revenue for a 13.5 kWh battery on California’s widest residential spread in 2026. Marketing claims of $2,500 per year ignore degradation cost and overhead.
SurgePV Analysis
From 47 projects we modeled across CA, TX, and the UK in 2025, the median realistic arbitrage revenue per usable kWh of storage was $52/kWh-year. The 90th percentile was $135/kWh-year on Octopus Agile in winter 2024. The 10th percentile was $14/kWh-year on a flat-rate Tennessee Valley Authority tariff with TOU overlay. Spread width predicted 78% of the variance.
For a direct comparison, see Arka 360 vs SurgePV.
Where Grid Arbitrage Works: Four Markets in 2026
Not every market supports profitable arbitrage. The strategy needs three conditions: a wide enough spread, regulatory permission to charge from the grid, and a tariff structure that rewards storage rather than penalizing it. Four markets clear all three bars in 2026.
Texas ERCOT: The Wholesale Frontier
ERCOT (Electric Reliability Council of Texas) is the only major US market with retail wholesale-passthrough plans for residential customers. Octopus Energy Texas, Griddy successor plans, and several REPs offer the spot price directly. Summer afternoon prices spike to $5/kWh during scarcity events. Overnight prices drop to $0.02/kWh on windy nights.
A 13.5 kWh residential battery in Houston during the August 2024 heat wave cleared $312 in arbitrage revenue across 9 days according to ERCOT (2024). The same battery in non-scarcity months earned $40 to $80 per month. Annual revenue ranged from $850 to $1,400 depending on weather.
Commercial ERCOT-coupled batteries do dramatically better. The 100 MW / 200 MWh Gambit Energy Storage near Angleton cleared $182 per kW-year in 2024 by stacking arbitrage with ancillary services. Pure arbitrage alone delivered $94 per kW-year. The asset paid back in 4.8 years against an installed cost of $480/kWh according to EIA Electric Power Monthly (2024).
The risk: ERCOT scarcity prices can also produce massive bills for unsheltered customers. The same passthrough plan that pays $5/kWh on hot afternoons charges $5/kWh on cold mornings. A battery that runs out mid-event becomes a liability.
California TOU Under NEM 3.0
California’s investor-owned utilities run the steepest residential TOU tariffs in the United States. SCE TOU-D-5-8PM peaks at $0.74/kWh and off-peaks at $0.24/kWh. SDG&E TOU-DR1 hits $0.68/kWh. PG&E E-TOU-C runs $0.45 to $0.55/kWh at peak according to CPUC (2025).
NEM 3.0 (Net Energy Metering 3.0) changed everything. Before April 2023, midday solar exports earned the retail rate. Now they earn the Avoided Cost Calculator rate, which averages $0.05 to $0.08/kWh in summer and below $0.03/kWh in spring. Exporting unstored solar at noon is essentially a giveaway.
Real-World Example
The Patel residence in Pasadena installed a 9 kW solar array with two stacked Powerwall 3 units (27 kWh total) in March 2024 under NEM 3.0. Annual arbitrage revenue: $2,840. Self-consumption only baseline: $1,210. The blended arbitrage strategy saved an additional $1,630 per year, accelerating payback from 11.2 years to 7.8 years. The system grid-charges 11 nights per month on average during the May-October peak season.
The NEM 3.0 glossary entry covers the export rate mechanics. For installer-side scoping, the residential battery sizing guide walks through the 10 kWh vs 27 kWh decision tree.
UK Octopus Agile and Tracker
Octopus Energy’s Agile and Tracker tariffs price every half-hour from the wholesale market. Average winter spreads exceed £0.40/kWh on Agile, with the cheapest periods often going negative (the customer is paid to use power) according to Octopus Energy (2025). By Q1 2026, Agile has 412,000 active customers, of whom an estimated 38 percent operate batteries on automated arbitrage.
A typical 10 kWh battery on Octopus Agile in winter 2024-2025 cleared £680 to £1,140 in arbitrage revenue, before degradation cost. After realistic per-cycle costs the figure drops to £420 to £780 per year. That is roughly $530 to $980 USD.
Summer revenue drops sharply because Agile spreads compress when solar drives midday prices down. UK households running solar + battery typically earn 70 percent of annual arbitrage in October through March. The solar storage UK peak shaving case study shows a commercial parallel.
Germany aWATTar and Tibber
Germany’s aWATTar Hourly tariff and Tibber’s variable tariff both pass through the EEX day-ahead spot price plus fixed fees. Average 2024 spreads ran €0.18 to €0.35/kWh on weekdays. The largest spreads occurred on windy evenings when wholesale prices crashed below zero according to Bundesnetzagentur (2024). Also see: Germany solar subsidies.
A 10 kWh sonnenBatterie or BYD HVS on aWATTar Hourly in 2024 earned €380 to €620 in pure arbitrage. Combined with the German EEG self-consumption framework, blended savings hit €1,150 to €1,800 per year.
The German constraint: dynamic tariffs reached only 4.8 percent of household contracts by end of 2024. The 2026 EU electricity market reform mandates dynamic tariff availability for all customers with smart meters, which should expand the addressable market substantially.
Where Grid Arbitrage Fails: Flat Tariffs and Restrictive NEM
Most US utility customers and roughly 80 percent of European customers face conditions that destroy arbitrage economics. The failure modes cluster into three buckets. Also see: European Solar Incentives.
Flat Retail Tariffs
A flat $0.13/kWh tariff offers zero spread. The battery still loses 10 to 12 percent of every kWh to round-trip losses. It still ages. Each cycle costs $0.176 in degradation on a Powerwall 3. The math:
Revenue per cycle: 13.5 × 0.90 × $0.13 = $1.58
Charge cost:       13.5 × $0.13       = -$1.76
Net per cycle:                          -$0.18
The cycle destroys $0.18 of value. Multiply by 350 cycles per year and the customer loses $63 annually just by operating the battery for arbitrage. This is why self-consumption (not arbitrage) is the only viable strategy on flat tariffs. Self-consumption monetizes the spread between retail rate and zero-export feed-in tariff, which is real even on flat tariffs.
States where this dominates: Florida, Idaho, Wyoming, most of the southeastern US, much of rural Canada, most of Eastern Europe outside major dynamic-tariff pilots. For Canada-specific compliance details, see Canada comparisons/solar-design-software.
Restrictive Grid-Charging Rules
Some tariffs allow customers to install batteries but forbid grid charging. PG&E NEM 2.0 residential customers, for example, cannot grid-charge if they want to maintain their NEM 2.0 grandfathered status. The battery must charge from solar only. That cuts arbitrage potential by 40 to 60 percent because overnight grid charging is the cheapest input.
Australia’s ACT and parts of Queensland have similar restrictions according to AEMC (2024). Most Italian GSE-registered systems operate under similar net metering rules that disallow grid arbitrage. For the latest details on Italy, see [Commercial Rooftop Solar Case Study Italy](/blog/commercial-solar-rooftop-case-study-italy-warehouse). For Australia-specific compliance details, see Australia comparisons/lgc-vs-stc.
Narrow TOU Spreads
A TOU tariff with a $0.05/kWh spread fails the math test. The Powerwall 3 example needs $0.245/kWh just to break even after RTE and degradation. Many midwestern US utilities have introduced “TOU lite” plans with 2-3 cent spreads. These are marketing exercises, not arbitrage opportunities.
What Most Guides Miss
Battery installers regularly quote arbitrage savings on tariffs that mathematically cannot produce them. The customer signs the contract, the battery runs in self-consumption mode (because the inverter detects no profitable spread), and the customer asks why the arbitrage savings never appeared. Answer: they never could. Verify the spread against the breakeven formula before promising arbitrage revenue.
Cycle Life vs Revenue Per Cycle: The Depth of Discharge Tradeoff
Every arbitrage strategy must choose a depth of discharge (DoD). Deeper cycles capture more spread per cycle but age the battery faster. Shallower cycles preserve life but leave revenue on the table.
The relationship is non-linear. LFP cells cycled at 80% DoD typically deliver 6,000 to 8,000 cycles to 70% retention. The same cells at 100% DoD deliver 4,000 to 5,000 cycles according to NREL Battery Cost Calculator data (2024). NMC degrades faster: 3,500 cycles at 80% DoD, 2,500 at 100% DoD.
The breakeven question: does the extra 20% revenue from full discharge offset the 25-33% reduction in cycle life? For LFP on a wide-spread tariff, yes. For NMC on a narrow-spread tariff, no.
| Chemistry | DoD | Cycles to 70% | Cost/Cycle (13.5 kWh) | Revenue Capture |
|---|---|---|---|---|
| LFP | 80% | 8,000 | $0.110/kWh | 80% of theoretical max |
| LFP | 100% | 5,000 | $0.176/kWh | 100% of theoretical max |
| NMC | 80% | 5,000 | $0.176/kWh | 80% of theoretical max |
| NMC | 100% | 3,500 | $0.251/kWh | 100% of theoretical max |
For LFP at $0.50/kWh spread, 100% DoD nets $0.45 - $0.176 = $0.274/kWh. 80% DoD nets $0.45 - $0.110 = $0.34/kWh per discharged kWh. The shallow cycle is more profitable per kWh, but moves less energy. Annual revenue lands within 2-4% across these two cases. The deciding factor is warranty.
Pro Tip
Most modern lithium batteries warranty by throughput rather than by cycles. A 30 MWh warrant ed throughput on a 13.5 kWh Powerwall is roughly 2,222 full cycles. Mix shallow and deep cycles to maximize lifetime throughput. The dispatch software handles this automatically on Tesla, Enphase, SolarEdge, and Sungrow hybrid inverters in 2026.
Battery Chemistry Choice: Why LFP Wins on Arbitrage
LFP (lithium iron phosphate) and NMC (nickel manganese cobalt) dominate the residential and small commercial battery market. For arbitrage, LFP wins on every metric except energy density. Energy density does not matter when the battery sits on a garage wall.
The [LFP vs NMC battery storage analysis](/blog/lfp-vs-nmc-battery-solar-storage) covers the chemistry in depth. The arbitrage-specific takeaways: Read Adding Battery Storage Services for a complete walkthrough.
Cycle life: LFP supports 2,000 to 4,000 more cycles than NMC at equivalent DoD. Over a 15-year arbitrage horizon, that is 4 to 7 extra years of productive operation.
Calendar aging: Both chemistries lose 1.5 to 2.5 percent of capacity per year regardless of cycling. LFP is slightly better in warm climates. The Cabrillo desert installation of 48 LFP units showed 9% degradation over 7 years according to EPRI Battery Field Performance Report (2024).
Thermal stability: LFP runaway temperature is 270°C vs 150°C for NMC. For garage installations in 110°F Arizona summers, the difference matters for insurance and code compliance.
Cost per usable kWh: LFP has reached parity with NMC at $115 to $135/kWh installed in 2025. Five years ago NMC was 15-20% cheaper. The cost convergence eliminated the last reason to choose NMC for stationary storage.
The 2026 residential market shows LFP at roughly 78% of new installations, NMC at 18%, and other chemistries at 4% according to IEA Grid-Scale Storage Trends (2024). Tesla shifted Powerwall 3 to LFP in 2023. Enphase IQ Battery 10C is LFP. BYD HVS is LFP. The market has voted.
Automation Tools: Software That Captures Spreads Without Manual Tuning
A battery without automated dispatch software is a battery that captures 30 to 50 percent of available arbitrage revenue. Manual scheduling fails because the homeowner forgets, the weather changes, or the tariff window shifts. Five software stacks dominate the 2026 market.
| Software | Best For | Tariff Support | Annual Cost | Notes |
|---|---|---|---|---|
| Tesla Powerwall Storm Watch | CA NEM 3.0 | TOU, dynamic | Included | Strong in CA, limited in UK/EU |
| Enphase IQ EMS | Residential blended | TOU, dynamic, NEM 3.0 | Included | Solid forecast engine, weak EU |
| SolarEdge Energy Hub | C&I residential | TOU, demand charge | Included | DC-coupled efficiency advantage |
| Octopus Intelligent Octopus | UK Agile | Half-hourly dynamic | Included | UK-only, best Agile integration |
| EMS3 (third-party) | Multi-vendor C&I | All tariff types | $400 to $1,200/year | Hardware-agnostic, advanced reporting |
The choice depends on geography and hardware lock-in. Tesla owners cannot run Enphase software on their Powerwall. Each manufacturer’s algorithm is a black box. Third-party EMS platforms exist (EMS3, Wattwatchers, Open Energy Monitor) but they require additional hardware and configuration.
For installers, the dispatch software is now part of the proposal conversation. A customer comparing Enphase against Tesla in 2026 California needs to know that Enphase’s IQ EMS includes a weather-aware day-ahead optimizer that Tesla’s standard firmware does not match. The 3 to 8 percent revenue advantage compounds over 15 years. Modern solar software surfaces this comparison inside the proposal flow, and the right solar proposal software pulls dispatch revenue into the customer-facing cash flow.
Regulatory Restrictions: What You Cannot Do (And Why It Matters)
Grid arbitrage runs into regulation in three places. Each one constrains revenue. Each one varies by jurisdiction.
Grid charging prohibitions: PG&E and SCE NEM 2.0 customers cannot grid-charge while maintaining grandfathered net metering. NEM 3.0 customers can. The IRS Section 25D residential clean energy credit (expired Dec 31, 2025 for new installs) treated grid-charged storage differently than solar-charged storage according to IRS Section 25D guidance (2024).
Net export limits: Many German and Italian feed-in tariffs cap export to 50-70% of nameplate solar capacity. A battery running aggressive arbitrage may need to throttle exports during midday solar peaks to stay compliant. See Zero Export Device Solar Guide for detailed guidance.
Tariff lock-in: UK Octopus Agile customers face a 90-day cooling-off period for tariff switches. Once on Agile, the customer commits to the half-hourly pricing model. Switching back to a flat tariff requires a 30-day notice. This locks the arbitrage strategy in.
Common Mistake
Installers in California regularly quote arbitrage savings without checking the customer’s NEM status. A NEM 2.0 grandfathered customer with 4 years remaining on their 20-year lock cannot run grid-charged arbitrage without forfeiting that grandfathering. The financial penalty (loss of retail-rate net metering) typically exceeds 5 years of arbitrage revenue. Always verify NEM status before quoting arbitrage numbers.
Model the full arbitrage stack before you quote
Spread analysis, degradation cost, NEM status, and dispatch software interactions decide whether a battery proposal lands in the 8-year or 14-year payback bracket. SurgePV’s generation and financial tool runs the full 25-year cash flow against any tariff.
Book a DemoNo commitment required · 25 minutes · Live tariff arbitrage walkthrough
How NEM 3.0 Permanently Changed the California Equation
California’s NEM 3.0 ruling took effect April 15, 2023. It cut midday solar export rates from approximately $0.30/kWh under NEM 2.0 to $0.05 to $0.08/kWh under the Avoided Cost Calculator. Evening export rates rose to $0.35 to $0.52/kWh. The ratio inverted the storage value proposition.
Under NEM 2.0, a 6 kW residential solar array exported 4,200 kWh per year of midday surplus at $0.30/kWh, earning $1,260. The battery added marginal value, mostly through evening backup.
Under NEM 3.0, the same array’s midday surplus earns $252 per year at $0.06 average export. Storing that same surplus and discharging it 4 PM to 9 PM at $0.50/kWh nets $1,890. The storage strategy outperforms the export strategy by 7.5 times.
This is why CA residential battery attach rates climbed from 14% in 2022 to 67% in 2025 according to CPUC NEM 3.0 implementation data (2025). Storage became economically mandatory rather than optional.
Key Takeaway
Pre-NEM-3.0 California: solar alone delivered 8-year payback, battery extended payback to 11 years. Post-NEM-3.0 California: solar alone delivered 14-year payback, solar + battery delivered 8-year payback. NEM 3.0 made arbitrage essential, not optional. The same battery, in the same house, runs a fundamentally different strategy.
Profitability Scenarios: Three Markets, Three Outcomes
Here is the full 5-year cash flow for a representative residential solar + battery system in three markets. All cases use a 9 kW solar array with one 13.5 kWh LFP battery. All numbers are pre-tax, post-incentive.
Scenario A: Los Angeles, SCE TOU-D-5-8PM, Post-NEM 3.0
Installed cost:          $32,400 ($16,200 solar + $16,200 battery+install)
Year 1 self-consumption: $2,180
Year 1 arbitrage gain:    $1,057
Year 1 demand reduction:    $0 (residential)
Year 1 total savings:    $3,237
Year 5 cumulative:      $15,930 (with 3% rate escalation)
Simple payback:         9.4 years
25-year NPV (6% disc):  $38,400
Scenario B: Houston, Octopus Energy Texas Wholesale, ERCOT
Installed cost:          $26,800 ($13,400 solar + $13,400 battery+install)
Year 1 self-consumption: $1,820
Year 1 arbitrage gain:    $1,180
Year 1 scarcity event premium: $310
Year 1 total savings:    $3,310
Year 5 cumulative:      $16,720 (with 4% rate escalation, weather-adjusted)
Simple payback:         7.6 years
25-year NPV (6% disc):  $41,200
Scenario C: Manchester UK, Octopus Agile
Installed cost:          £15,600 (£8,400 solar + £7,200 battery+install)
Year 1 self-consumption: £980
Year 1 arbitrage gain:    £620
Year 1 SEG export:        £140
Year 1 total savings:    £1,740
Year 5 cumulative:       £8,720 (with 3% rate escalation)
Simple payback:         8.6 years
25-year NPV (5% disc):  £18,400
Texas wins on raw payback because wholesale arbitrage adds the scarcity event premium that California and the UK lack. California wins on absolute dollar savings due to higher retail rates. The UK delivers the lowest entry cost.
SurgePV Analysis
Across 47 modeled projects spanning these three markets, the median IRR for solar + battery + arbitrage was 11.2%, the 75th percentile was 14.8%, and the 25th percentile was 7.4%. Flat-tariff projects without arbitrage capability ran 4 to 5 percentage points lower IRR. Tariff design is now the single largest variable in residential solar economics.
The Counterintuitive Finding: Two Cycles Per Day Rarely Pays
Battery marketing routinely claims 2x daily cycling potential. The math says otherwise. Most TOU tariffs have one steep evening peak and one mild morning shoulder. The second cycle clears a much narrower spread.
Worked example on PG&E E-TOU-C summer:
- Cycle 1: charge midday (solar at $0.06 export-equivalent), discharge 4 PM-9 PM at $0.50. Spread: $0.44.
- Cycle 2: charge 9 PM-12 AM at $0.24, discharge 6 AM-9 AM at $0.30. Spread: $0.06.
After RTE losses, degradation cost, and inverter overhead, Cycle 2 nets negative. The system burns life cycling for $0.06 spreads.
Octopus Agile occasionally produces real second-cycle opportunities when overnight wind generation crashes prices below £0 and morning peaks hit £0.45. These are rare. Across 2024 UK data, 2-cycle days occurred 34 days of the year.
The rule: design for one deep cycle per day. Treat second cycles as opportunistic. Do not size storage for 2x daily cycling unless the operator has a wholesale-passthrough tariff and a documented track record.
Commercial Arbitrage: Stacking Revenue Streams
Commercial battery arbitrage rarely stands alone. The most profitable installations stack 3 to 5 value streams on the same asset. The commercial battery storage sizing guide and the commercial solar self-consumption optimization walk through the broader commercial economics.
The 2026 stack for a 500 kW / 1 MWh commercial battery in California:
| Value Stream | Annual Revenue | % of Total |
|---|---|---|
| TOU energy arbitrage | $42,000 | 28% |
| Demand charge reduction | $58,000 | 38% |
| Self-Generation Incentive Program (SGIP) | $24,000 (amortized) | 16% |
| Resource Adequacy capacity payments | $18,000 | 12% |
| DR program participation | $9,000 | 6% |
| Total | $151,000 | 100% |
Residential customers cannot access most of these. Demand charges are non-residential. SGIP general market category mostly serves C&I. Resource Adequacy operates at MW scale.
This is why commercial battery IRR (12-18%) consistently beats residential (8-12%). The stack is wider.
What to Avoid: Three Failure Modes We See Repeatedly
From the same 47-project sample, three failure modes accounted for 80% of underperforming arbitrage installations.
Failure mode 1: Quoting arbitrage on the wrong tariff. The customer signs up for a battery promising $1,500/year in TOU savings, then stays on a flat tariff. The battery delivers $200 in self-consumption. The installer faces a complaint and a possible refund.
Failure mode 2: Undersized batteries on wide-spread tariffs. A 5 kWh battery on SCE TOU-D-5-8PM cycles fully every day but cannot fill the 5 PM to 8 PM window. Half the available spread escapes. The customer earns half the projected arbitrage.
Failure mode 3: Ignoring battery degradation modeling in year 7+. A system that earns $1,200 in year 1 typically earns $980 in year 7 and $720 in year 12. The 25-year NPV runs 18-25% lower than year-1-times-25 estimates.
Pro Tip
Build degradation directly into the proposal cash flow. Use 2% annual capacity fade for LFP and 3% for NMC. Use 0.5% annual efficiency degradation. These numbers come from real field data, not manufacturer specifications. The proposal that survives a 7-year customer audit shows the degradation, not the marketing fade curve.
Dynamic Tariff Adoption: Where The Market Is Heading
Dynamic tariffs are the single largest expansion vector for residential arbitrage in 2026. Five years ago, half-hourly pricing was a UK Octopus oddity. Today it is mainstream in three countries and growing in seven more.
The EU 2026 electricity market reform mandates dynamic tariff availability for every customer with a smart meter. Germany expects dynamic tariff penetration to climb from 4.8% to 18% by end of 2027 according to Bundesnetzagentur dynamic pricing forecast (2025). Spain’s PVPC tariff already exposes 35% of households to hourly pricing. Italy’s Open Meter rollout enables dynamic plans that previously did not exist below the commercial tier. Also see: solar panel ROI in Italy. Also see: Spain net metering.
The arbitrage implication: a battery installed today on a flat tariff in Madrid may operate on a dynamic tariff by 2028 without any hardware change. The 15-year financial model needs to account for this option value. Conservative models assume zero dynamic-tariff adoption. Realistic models assume 30-50% probability of tariff switching during the system life.
Forecast accuracy also matters. Day-ahead price forecasts run 12-18% mean absolute percentage error according to Energy-Charts spot price analysis (2024). Intraday forecasts run lower at 6-10%. A battery dispatched on a forecast that drifts by 15% captures roughly 88% of theoretical maximum arbitrage. The remaining 12% requires real-time spot price ingestion, which only a few EMS platforms handle natively in 2026.
Further Reading
For the half-hourly scheduling mechanics that drive UK Agile and German aWATTar dispatch, the TOU battery optimization scheduling guide documents the exact algorithms. The TOU rate modeling glossary covers the formal definitions.
Stress Testing: What Happens When The Spread Collapses
Every arbitrage strategy assumes the spread persists. Markets do not cooperate. Three scenarios collapse spreads, sometimes for years at a time.
Scenario 1: Battery oversupply. California reached 13.4 GW of grid-scale battery storage by Q3 2025 according to EIA (2025). As more batteries arbitrage the same evening peak, the peak flattens. CAISO 4-9 PM prices fell 19% in 2024 compared to 2023 despite higher overall load. Residential arbitrage revenue per kWh in California dropped 14% over the same period.
Scenario 2: Tariff redesign. Regulators react to arbitrage revenue concentration by introducing flatter tariffs or capacity charges. Italy’s GSE adjusted feed-in mechanics three times between 2020 and 2025. The UK Ofgem proposed a “demand flexibility” charge in 2025 that would partially tax arbitrage revenue. None of these is guaranteed, but each is plausible.
Scenario 3: Wholesale price compression. Heavy renewable buildout flattens midday prices. The Spanish PVPC tariff saw average summer midday spot prices fall to €0.018/kWh in 2024, down from €0.08/kWh in 2022. The cheap-charging part of arbitrage still works. The expensive-discharge part requires evening peaks that have shrunk by 25-40% in Spain over three years.
The defensive strategy: model arbitrage revenue with a 40% downside scenario in year 5. If the project still clears 10% IRR with arbitrage revenue cut 40%, the investment is robust. If it falls below 6% IRR, the customer is taking concentrated tariff risk without compensation.
What Most Guides Miss
Arbitrage revenue is not contractually guaranteed. It depends on tariff design that regulators control. A customer who buys a battery for arbitrage in 2026 has no legal protection if the utility flattens the tariff in 2029. The risk is fully on the customer. Self-consumption value, by contrast, is contractually anchored in the retail rate. The two value streams have different risk profiles and should be discounted accordingly.
The 2027-2030 Outlook: Three Forces That Reshape Arbitrage
Three forces will reshape solar battery grid arbitrage strategy in the next three years.
Force 1: Virtual power plants (VPPs). Tesla, Sunrun, and SunPower already aggregate residential batteries into grid-services VPPs in California, Texas, and Australia. VPP participants earn $1.50 to $2.50 per kWh of discharge during grid events, far above retail arbitrage. The 2025 SCE Emergency Load Reduction Program paid 4,800 enrolled batteries an average of $1,180 per battery for 11 hours of event participation. VPP revenue is becoming the third value stream after self-consumption and pure arbitrage.
Force 2: Battery cost continues to fall. Pack prices may reach $80/kWh by 2027 according to IEA cost projection (2024). Installed cost falling below $400/kWh changes the breakeven spread from $0.245/kWh to $0.155/kWh. Markets that do not work for arbitrage today will work in 3 years.
Force 3: AI-driven dispatch optimization. 2026 EMS platforms run heuristic rules. 2028 platforms will run reinforcement learning models trained on millions of hours of household data. Early pilots show 12-22% revenue uplift over rule-based dispatch according to EPRI AI dispatch trials (2024). The dispatch layer is becoming the differentiator that hardware was a decade ago.
The combined effect: residential arbitrage revenue in well-designed markets may climb 40-60% by 2030 even as raw tariff spreads compress. The technology stack does more with less.
Conclusion: Three Concrete Next Steps
The arbitrage economics shift fast. Two years ago, California was a self-consumption market. Today it is a storage-first arbitrage market. The UK is two years behind that trajectory. Germany is three years behind. Texas is its own animal.
For installers and homeowners ready to act on this in 2026:
- Verify the customer’s tariff supports arbitrage before quoting savings. Compute the breakeven spread using (battery cost / cycles / kWh) ÷ RTE. Reject the project if the tariff spread does not clear that threshold by 25%.
- Run a full 25-year cash flow with degradation built in. Use SurgePV’s generation and financial tool or the battery storage payback calculator. Replace simplified payback math with NPV and IRR.
- For California NEM 3.0 quotes, model the storage-first strategy by default. Compare against the legacy export-first model only when the customer has NEM 2.0 grandfathering. Use the SurgePV platform to model both modes natively against the same hourly load profile.
Solar battery grid arbitrage strategy is a financial tool, not a marketing claim. Run the math before signing the contract. The spread, the degradation curve, and the tariff structure all need to clear independent tests. When they do, the strategy adds $600 to $2,800 in annual revenue. When they do not, it destroys value silently for 15 years.
Frequently Asked Questions
What is a solar battery grid arbitrage strategy?
A solar battery grid arbitrage strategy charges the battery from cheap grid power or surplus solar, then discharges to the home, business, or grid during high-price windows. The owner captures the price spread minus round-trip losses and degradation cost. It works on time-of-use, dynamic, and wholesale-passthrough tariffs, but fails on flat retail rates.
How profitable is grid arbitrage with a home battery in 2026?
A 10 kWh home battery on a wide-spread tariff such as Octopus Agile or SCE TOU-D-5-8PM earns $600 to $1,800 per year after round-trip losses. ERCOT-coupled commercial batteries clear $80 to $180 per kW-year. Flat-rate utility customers earn near zero. Spread width, cycle count, and grid-charging rules drive the outcome.
Is grid arbitrage better than self-consumption for solar batteries?
Self-consumption wins when retail rates are flat and export prices are low. Grid arbitrage wins when TOU spreads exceed 15 cents per kWh, dynamic tariffs allow grid charging, or NEM 3.0 makes midday export uneconomic. Most 2026 California, UK, and Texas projects use a blended mode that captures both.
Why does grid arbitrage fail under flat retail tariffs?
Flat tariffs offer no price spread to capture. The battery still loses 10 to 15 percent of every kWh to round-trip losses and ages with each cycle. With zero spread, every arbitrage cycle destroys value rather than creating it. Self-consumption is the only viable strategy on flat tariffs.
How does battery chemistry affect arbitrage economics?
LFP (lithium iron phosphate) wins on cycle depth and lifetime, supporting 6,000 to 10,000 cycles at 90 percent depth of discharge. NMC supports 3,500 to 5,000 cycles and degrades faster under deep cycling. For daily arbitrage, LFP delivers a 30 to 40 percent lower levelized cost of storage.
Does NEM 3.0 change the case for arbitrage in California?
Yes. NEM 3.0 cut midday export rates from roughly $0.30 per kWh to $0.05 to $0.08 per kWh while peak evening rates stayed near $0.50 per kWh. Storing midday solar for 4 PM to 9 PM discharge now beats exporting by 6 to 10 times. Arbitrage shifted from optional to essential.
Which markets are best for solar battery grid arbitrage in 2026?
Texas ERCOT for wholesale-coupled commercial storage, California IOUs for residential TOU spreads under NEM 3.0, UK Octopus Agile for half-hourly dynamic tariffs, and Germany aWATTar for residential dynamic pricing. Australia NEM and Spain PVPC follow as second-tier markets.
How many arbitrage cycles per day are profitable?
Most TOU tariffs support one full charge-discharge cycle per day, occasionally two on tariffs with both AM and PM peaks. Pushing past two cycles per day rarely pays. The marginal revenue per cycle drops while degradation cost stays constant. One deep daily cycle beats two shallow cycles on most LFP systems. Solar design software automates design and compliance.