Quick Answer
Six months later, their monitoring portal shows 8.2–8.7 kWh on a full cycle. Installers who size backup duration without modeling RTE routinely promise 12 hours of coverage and deliver 9. Designers who assume 100% efficiency in self-consumption calculations overstate savings by 10–25% before the battery ages a single day.
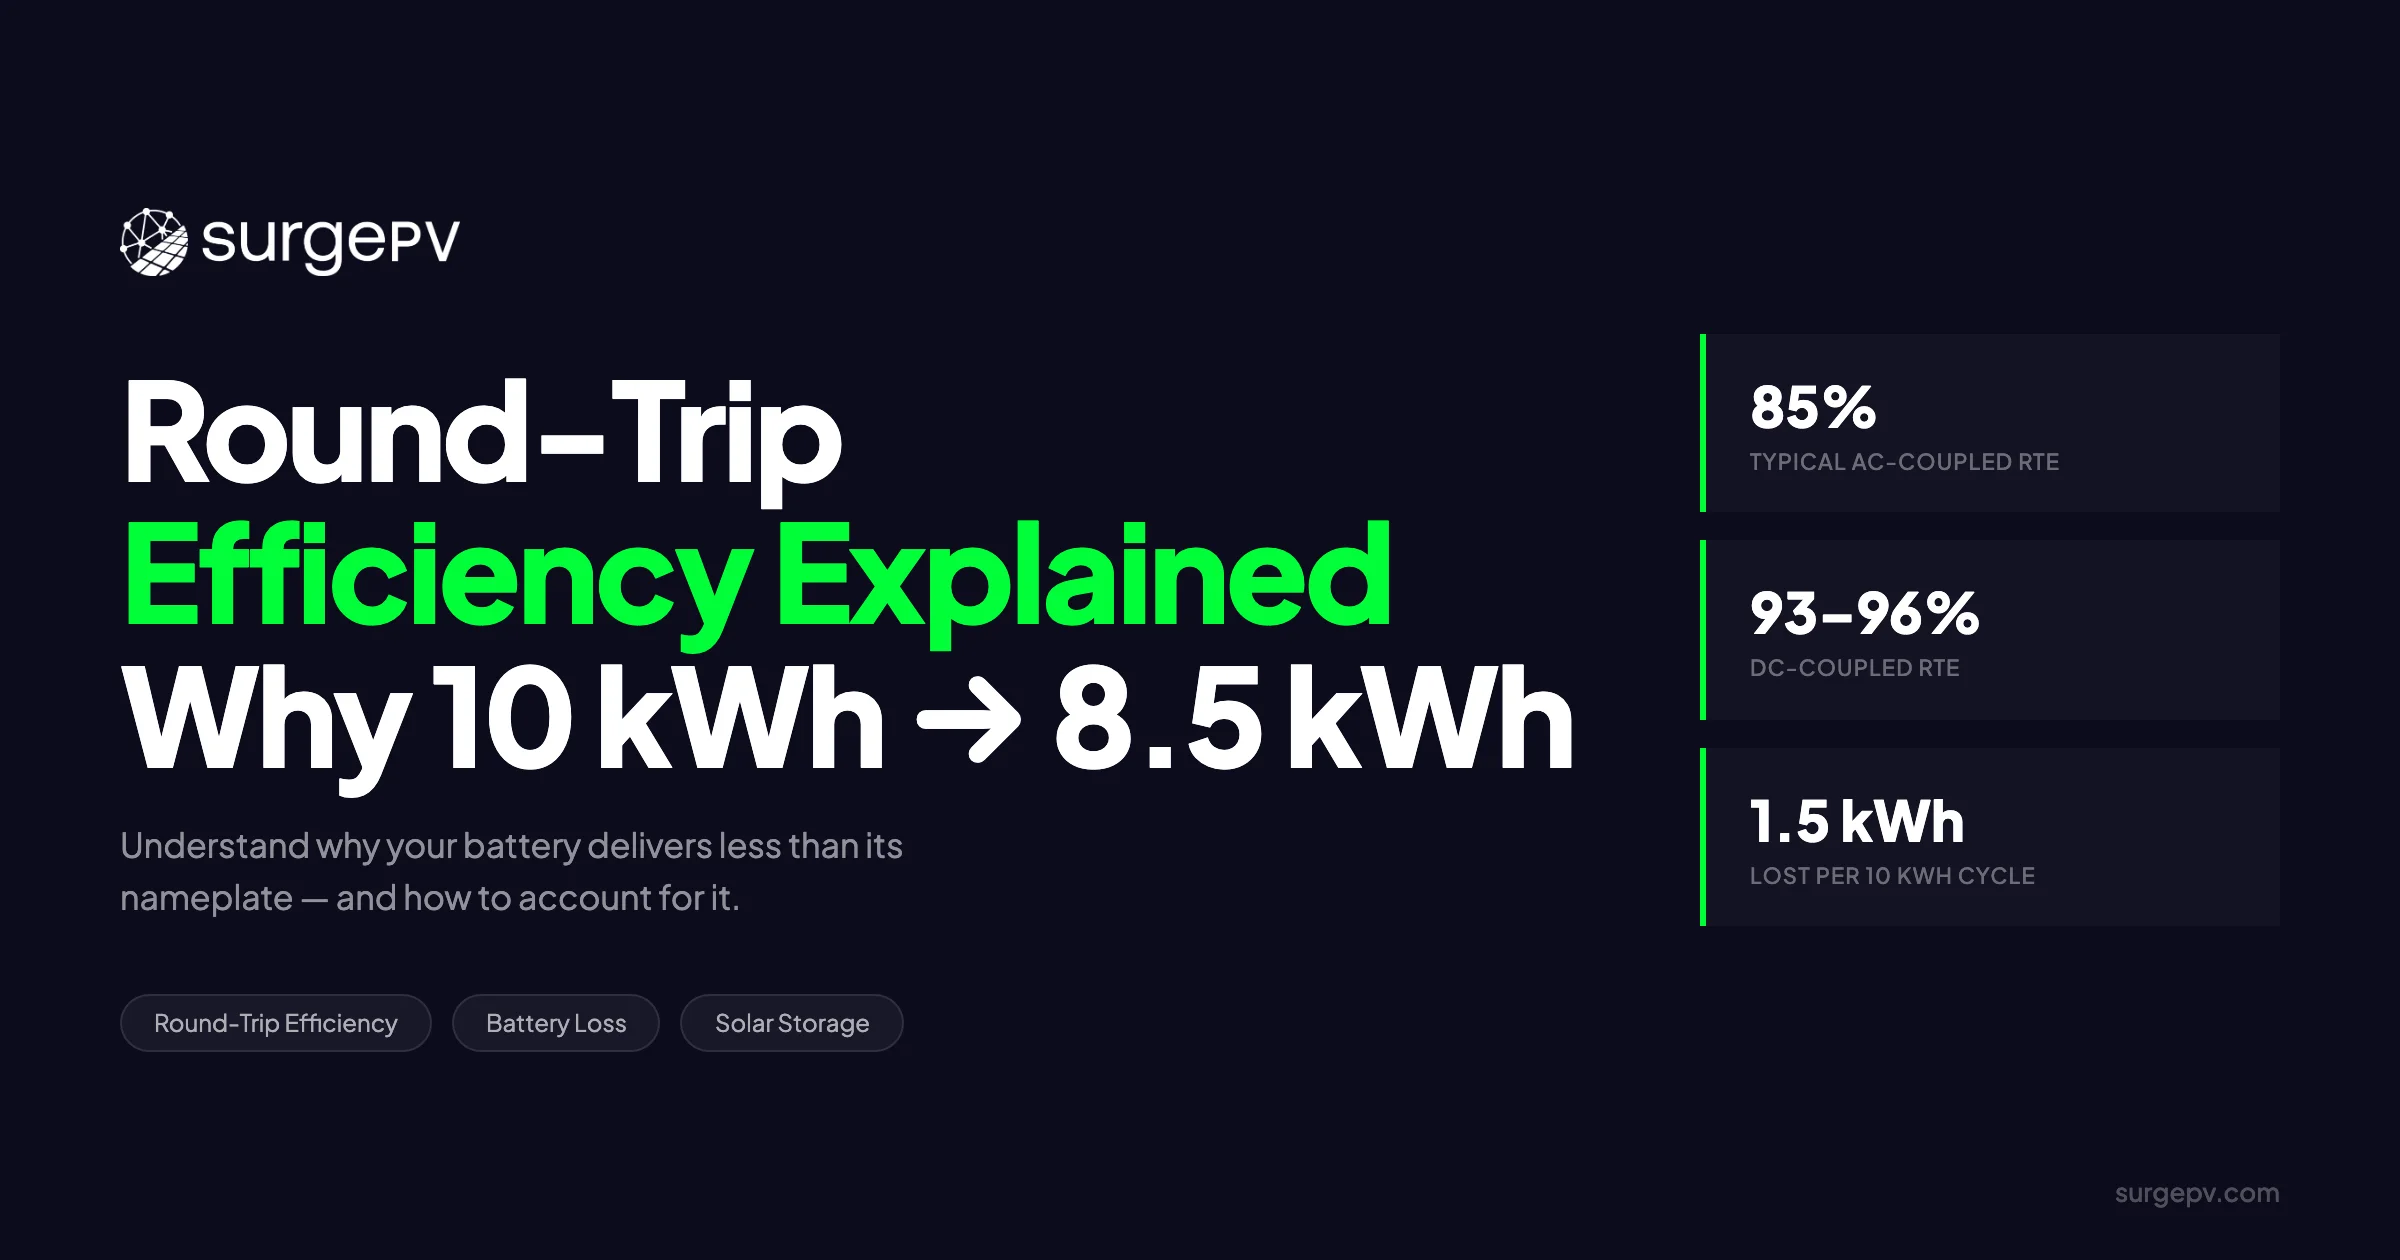
You sell a 10 kWh battery. The client expects 10 kWh of backup power. Six months later, their monitoring portal shows 8.2–8.7 kWh on a full cycle. They call it a defect. It is not. The gap is round-trip efficiency — the single most misunderstood number in residential storage design.
Six months later, their monitoring portal shows 8.2–8.7 kWh on a full cycle. Installers who size backup duration without modeling RTE routinely promise 12 hours of coverage and deliver 9. Designers who assume 100% efficiency in self-consumption calculations overstate savings by 10–25% before the battery ages a single day.
Installers who size backup duration without modeling RTE routinely promise 12 hours of coverage and deliver 9. Designers who assume 100% efficiency in self-consumption calculations overstate savings by 10–25% before the battery ages a single day. Solar design software should bake these losses into the financial model, not just the hardware specification sheet. When it does not, the gap between proposal and reality becomes a warranty complaint.
TL;DR
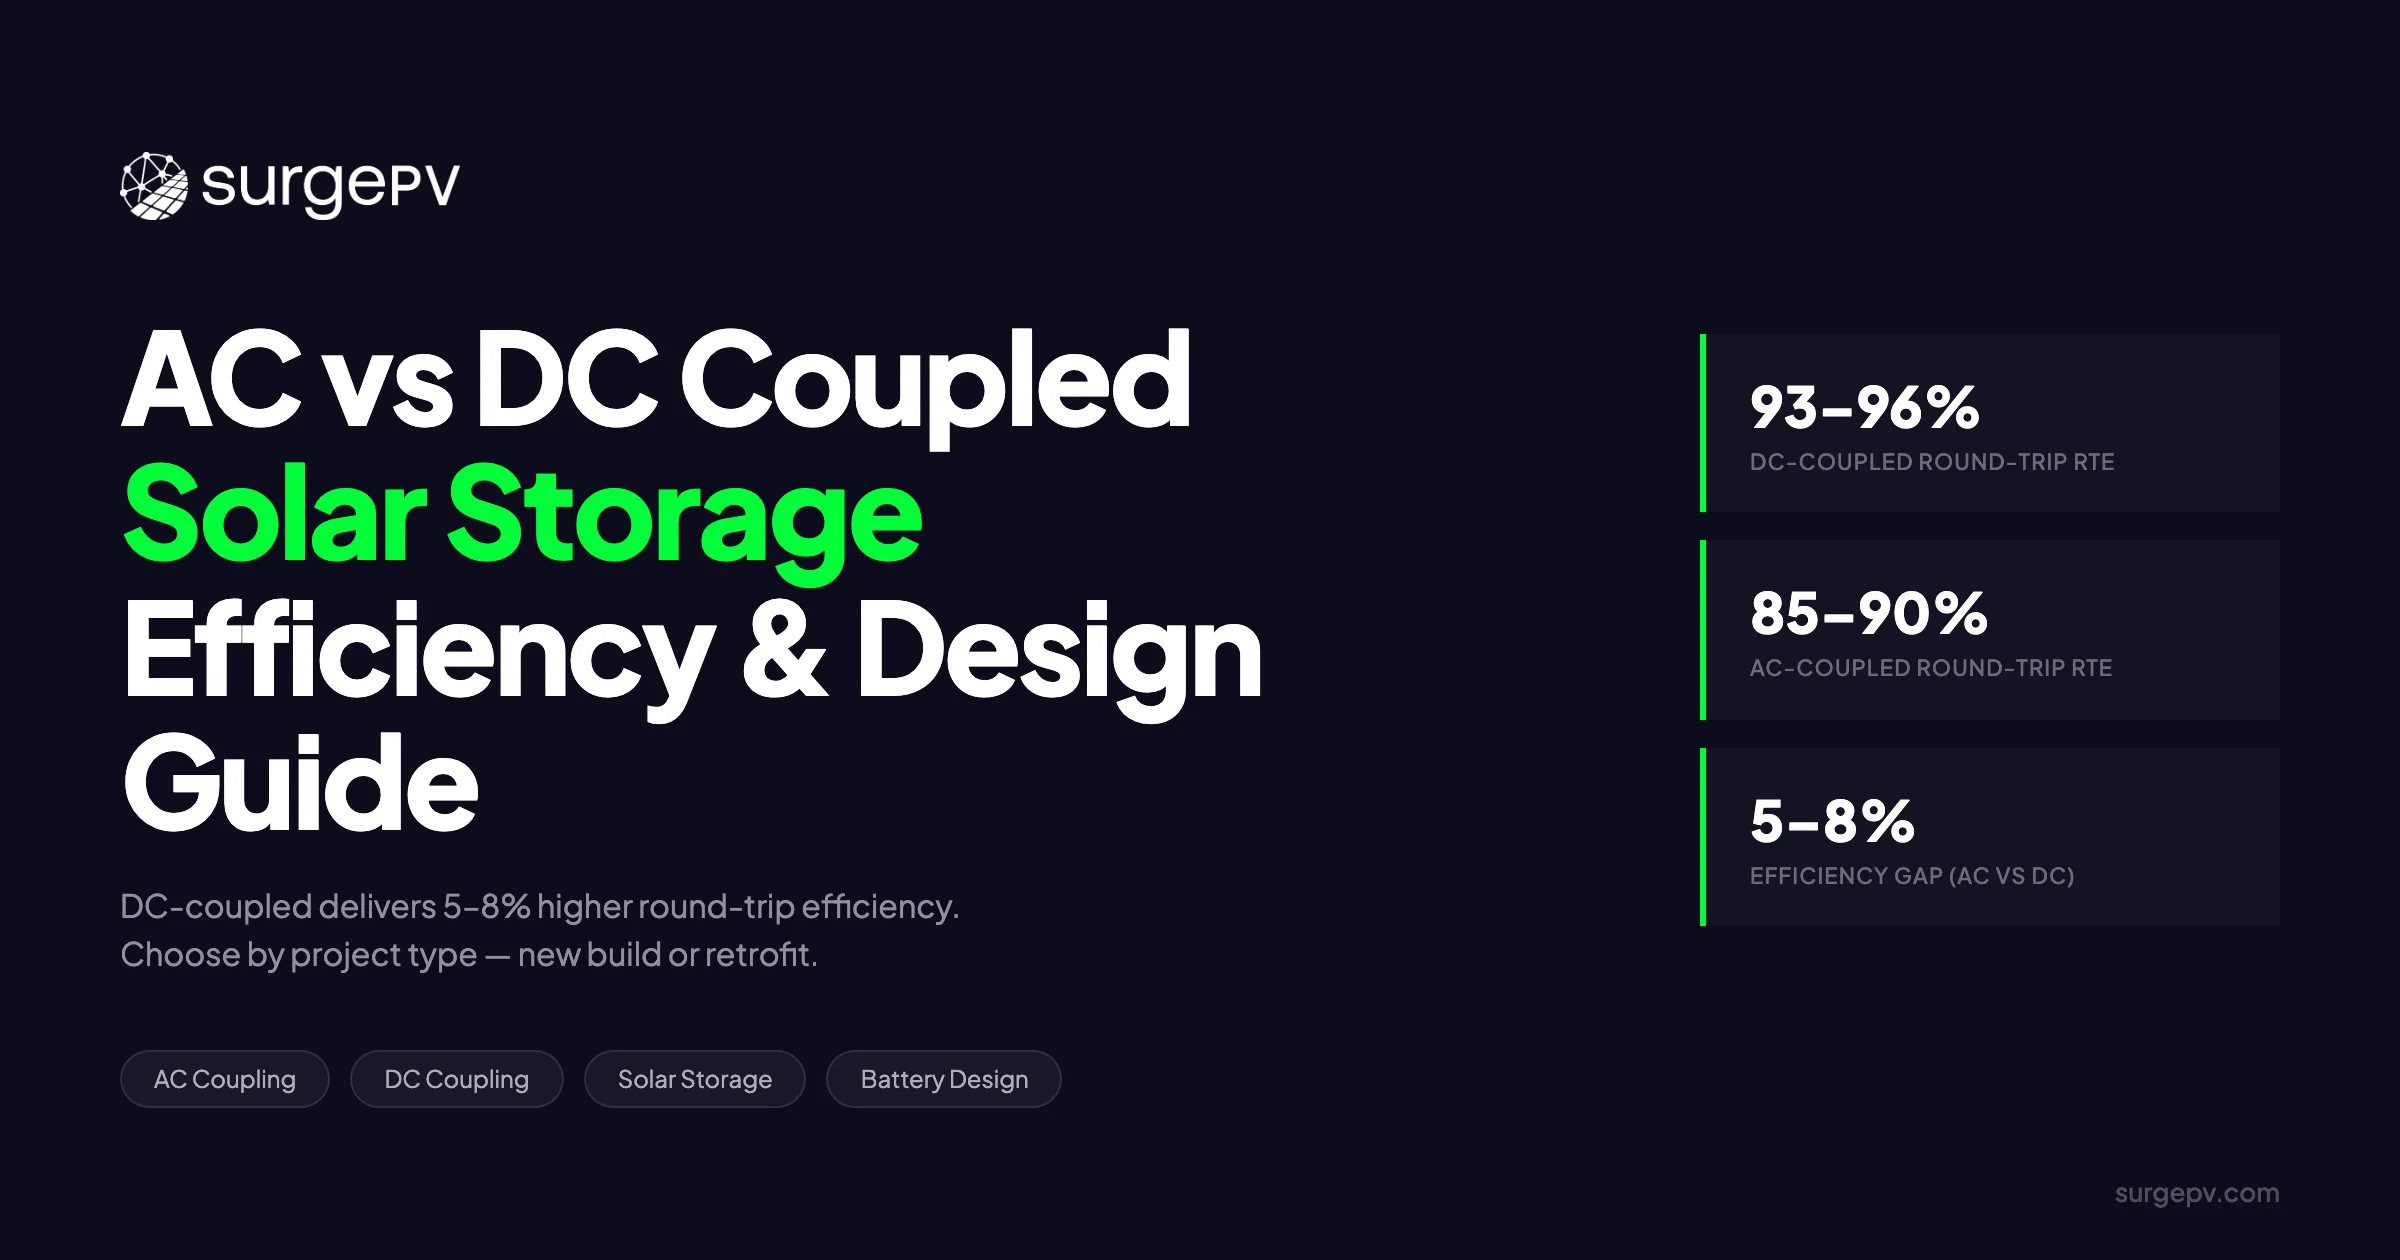
Round-trip efficiency measures how much energy you recover after a full charge-discharge cycle. On AC-coupled systems, expect 85–94% RTE. A 10 kWh battery at 90% RTE and 85% depth of discharge delivers roughly 7.65 kWh of usable energy. LFP batteries lead on DC RTE (95–99%); inverter conversions and BMS overhead account for the rest.
For United States-specific compliance details, see United States arizona/phoenix. For United States-specific compliance details, see United States california/los-angeles.
In this guide:
- What round-trip efficiency means and why it is never 100%
- The exact RTE formula with a worked example using a 10 kWh system
- The difference between DC and AC round-trip efficiency — and which one matters for your project
- Where energy is lost: inverters, BMS, heat, and wiring
- Chemistry comparison: LFP, NMC, lead-acid, flow, and NaS
- Real-world specs from Tesla, LG, BYD, CATL, and Samsung SDI
- How RTE affects payback, self-consumption, and client ROI
- Practical steps installers can take to minimize losses
What Is Round-Trip Efficiency?
Round-trip efficiency is the percentage of electrical energy recovered after a complete charge-store-discharge cycle. If you feed 10 kWh into a battery and retrieve 9 kWh, the RTE is 90%. It is a system-level energy metric, not a cell-level chemistry score, and it is never 100% because physics demands losses at every conversion step.
The term applies to the full pathway: AC power from the grid or solar inverter passes through a battery inverter to reach DC storage, then reverses direction to supply AC loads. Each conversion — electrical to chemical, chemical back to electrical — generates heat, resistance, and parasitic overhead. A lithium cell may test at 98% DC-DC efficiency in a laboratory, but by the time two inverter conversions, BMS balancing, and wiring resistance are included, the homeowner sees 85–94% on an AC-coupled system.
RTE is often confused with two related metrics. Coulombic efficiency measures charge carriers: amp-hours out divided by amp-hours in. A battery can show 99.9% coulombic efficiency while RTE sits at 90% because voltage drops during discharge. Voltage efficiency captures the ratio of average discharge voltage to average charge voltage. Neither metric alone describes the energy balance the client pays for. Only RTE — energy out divided by energy in — matches the kilowatt-hours on the utility bill and the monitoring dashboard.
Think of a water tank. You pour 10 liters in through a narrow funnel (inverter losses), the tank walls absorb some moisture (chemistry inefficiency), the float valve draws a trickle continuously (BMS power), and when you drain it through a second funnel (second inverter), you collect 8.5 liters. The tank holds 10 liters. The system delivers 8.5. That is round-trip efficiency.
| Term | Definition | When It Matters |
|---|---|---|
| Round-Trip Efficiency (RTE) | Energy discharged divided by energy charged, expressed as a percentage | Financial modeling, client proposals, system sizing |
| Coulombic Efficiency | Amp-hours discharged divided by amp-hours charged | Cell research, chemistry comparison, laboratory testing |
| Voltage Efficiency | Average discharge voltage divided by average charge voltage | Understanding why RTE falls below coulombic efficiency |
| System Efficiency | RTE plus auxiliary losses: cooling, communication, standby draw | Total cost of ownership and annual energy balance |
Designers who confuse these terms quote DC cell figures to clients who pay for AC meter readings. The result is misaligned expectations. Solar software should distinguish between DC battery RTE and AC system RTE automatically so proposals reflect what the homeowner actually experiences.
The RTE Formula: How to Calculate Battery Efficiency
The formula is simple. The application is not.
RTE = (Energy_discharged / Energy_charged) × 100%
Both measurements must be taken at the same electrical point — typically the AC meter — to produce a system-level figure. Measuring at the battery terminals gives DC RTE. Measuring at the household distribution panel gives AC RTE. Mixing the two produces meaningless numbers and unreliable financial projections.
Here is a full worked example for a 10 kWh AC-coupled lithium iron phosphate (LFP) battery in a residential retrofit installation.
Step 1 — Energy charged: The homeowner draws 10.00 kWh from the grid during off-peak hours, measured at the AC meter.
Step 2 — Inverter charge conversion: The battery inverter converts AC to DC at 97% efficiency. 10.00 kWh × 0.97 = 9.70 kWh reaches the battery DC bus.
Step 3 — Battery DC-DC storage: The LFP battery stores energy at 96% DC round-trip efficiency. 9.70 kWh × 0.96 = 9.31 kWh is chemically stored after losses to internal resistance, BMS balancing, and heat.
Step 4 — Depth of discharge limit: The manufacturer specifies 85% DoD to preserve cycle life. 9.31 kWh × 0.85 = 7.91 kWh is available for discharge.
Step 5 — Inverter discharge conversion: The battery inverter converts DC back to AC at 97% efficiency. 7.91 kWh × 0.97 = 7.67 kWh is delivered to the household AC loads.
Step 6 — System RTE: (7.67 kWh / 10.00 kWh) × 100% = 76.7% AC-AC.
This is lower than most installers expect. The 10 kWh label on the battery spec sheet becomes 7.67 kWh at the load. The remaining 2.33 kWh is lost to six distinct mechanisms across the chain.
Now consider a DC-coupled system on a new build. The solar array charges the battery directly through a charge controller, skipping the AC-DC inversion step on the charge side. Only the discharge pass requires DC-AC conversion. This architecture typically improves system RTE by 3–6 percentage points, bringing the same 10 kWh LFP battery to roughly 80–82% AC-AC RTE.
Design Rule of Thumb
Use 85–90% as a planning figure for AC-coupled systems and 92–97% for DC-coupled systems. Adjust downward by 2–4 percentage points for extreme climates, high charge rates, or batteries past year 5.
These figures belong in every proposal. Solar design software that applies a flat 95% assumption to all batteries regardless of architecture produces payback estimates that fail in the field.
AC vs DC Round-Trip Efficiency: What Solar Designers Actually Need to Know
Manufacturers quote DC round-trip efficiency because the number is higher. Installers need AC round-trip efficiency because the number is real. Understanding the gap between the two separates accurate proposals from disappointed clients.
DC RTE measures losses inside the battery pack only. It includes cell chemistry limitations, internal DC resistance, BMS passive balancing, and cell-to-cell variation. It does not include any conversion outside the battery enclosure. Typical DC RTE ranges from 92% for older NMC packs to 99% for premium LFP modules under ideal conditions.
AC RTE measures energy from the point where AC power enters the system to the point where AC power exits. For an AC-coupled battery, this means two inverter conversions — one to charge, one to discharge — plus wiring resistance, breaker losses, and any thermal management power drawn during the cycle. Typical AC RTE ranges from 85% to 94% depending on chemistry, inverter quality, and installation conditions. For more on this topic, see AC Coupled vs DC Coupled Battery Solar.
The difference matters because datasheets rarely clarify which figure they display. A battery marketed at 96% RTE may deliver 89% AC-AC after inverter losses. A client who reads the datasheet and expects 96% will feel misled when their monitoring shows 89%.
Use this decision framework on every project:
- Retrofit / AC-coupled: Use AC RTE. The battery connects to the existing AC bus through a separate inverter. Two conversions are unavoidable.
- New build / DC-coupled: Use DC RTE plus one inverter loss for discharge. The charge controller handles DC-DC conversion from the array. Only the discharge path needs inversion.
- Hybrid inverter: Check whether the manufacturer quotes RTE at the battery terminals or the inverter AC terminals. Some hybrid inverters include battery conversion losses in their system RTE; others do not.
A further caution: some datasheets omit wiring and protection losses. A 30-meter cable run, a fused disconnect, and a distribution breaker can add 0.5–1.5% resistive loss. For detailed designs, add 1–2% to the datasheet RTE loss budget.
Where the Energy Goes: Inverter Losses, BMS Overhead, and Thermal Load
Energy does not disappear. It converts to heat, parasitic power, and resistive dissipation. Breaking down the loss stack for a typical AC-coupled residential battery explains why 10 kWh becomes 8.5 kWh — or less.
1. Inverter losses Modern string inverters and battery inverters operate at 97–99% peak efficiency. Peak efficiency, however, occurs at 50–75% of rated load. At low load factors — common in overnight trickle charging or morning top-up — efficiency can drop to 90–93%. Because a round-trip cycle involves two conversions, even a high 98% per-pass efficiency costs roughly 4% of total energy.
2. BMS parasitic loads The Battery Management System monitors cell voltages, balances charge across cells, and manages safety contactors. This requires 5–20W of continuous power. On a 10 kWh battery cycled once daily, 15W of continuous draw equals 0.36 kWh per day — roughly 3.6% of throughput. Over a year, BMS overhead alone can consume 130 kWh.
3. Thermal management Batteries operate best near 25°C. In extreme climates, active heating or cooling adds 1–3% extra loss per cycle. Cold-climate installations where batteries sit in unheated garages may require resistive heating before charging begins. Hot-climate installations with poor ventilation trigger cooling fans or refrigerant loops. Both draw energy that never reaches the load.
4. Wiring and protection DC cabling between inverter and battery, AC cabling to the distribution panel, fuses, breakers, and contactors all add resistive loss. Well-designed residential systems keep this under 0.5%, but long cable runs, undersized conductors, or corroded connections can push it above 1.5%.
| Loss Source | Typical Loss | Cumulative Energy (kWh) |
|---|---|---|
| Energy charged (AC meter) | — | 10.00 |
| Inverter charge conversion | 3.0% | 9.70 |
| Battery DC-DC RTE | 4.0% | 9.31 |
| BMS parasitic + balancing | 1.5% | 9.17 |
| Thermal management | 1.0% | 9.08 |
| Inverter discharge conversion | 3.0% | 8.81 |
| Wiring and protection | 0.8% | 8.74 |
| Net delivered to loads | 12.6% total loss | 8.74 |
This table assumes a well-designed LFP system in moderate temperatures. Poor installations with long cable runs, outdated inverters, or extreme climates can push total loss above 20%, bringing the delivered energy below 8.0 kWh from the same 10 kWh nameplate.
Round-Trip Efficiency Comparison by Battery Chemistry
DC round-trip efficiency varies significantly across storage chemistries. The choice of chemistry affects not only RTE but also cycle life, safety, temperature tolerance, and capital cost.
| Chemistry | DC RTE | Cycle Life | Temperature Sensitivity | Typical Use Case |
|---|---|---|---|---|
| LFP (LiFePO4) | 95–99% | 4,000–8,000 cycles | Low (-10°C to 50°C) | Residential solar, commercial backup |
| NMC (LiNiMnCoO2) | 92–96% | 2,000–4,000 cycles | Moderate (10°C to 45°C) | High-density residential, EV integration |
| Lead-acid (VRLA) | 75–85% | 500–1,200 cycles | High (20°C to 30°C optimal) | Legacy off-grid, budget installations |
| Vanadium flow | 65–80% | 15,000+ cycles | Very low (5°C to 50°C) | Utility-scale, long-duration storage |
| NaS (Sodium-sulfur) | 85–92% | 4,500+ cycles | High (operates at 300°C) | Grid-scale, industrial peak shaving |
LFP leads on DC RTE for two reasons. Its olivine crystal structure maintains stable voltage across the state-of-charge window, minimizing resistive loss. And its flat discharge curve means the battery operates at high voltage efficiency throughout most of the cycle. NMC offers higher volumetric energy density — more kilowatt-hours per liter — but its layered oxide structure generates more heat during intercalation, which drags RTE down by 3–5 percentage points compared to LFP.
Lead-acid remains common in legacy off-grid systems but its Peukert effect — reduced available capacity at high discharge rates — and high internal resistance limit RTE to 75–85% even in ideal conditions. For new solar-plus-storage designs, lead-acid rarely competes on lifetime cost. See our guide on Battery Solar System Design UK for more. For the latest details on UK, see Heritage Building Solar Case Study.
Vanadium flow batteries trade RTE for longevity. Their 65–80% DC RTE is the lowest of the mainstream chemistries, but 15,000+ cycle life and negligible calendar aging make them attractive for 4–8 hour utility discharge cycles where total lifetime throughput matters more than per-cycle efficiency.
Calendar aging degrades RTE over time. A battery shipping from the factory at 96% DC RTE may operate at 93–94% after 10 years of SEI growth and electrolyte decomposition. This fade is separate from capacity fade — a battery can retain 85% of its nameplate capacity while RTE drops by 2–3 percentage points because internal resistance has increased.
Real Specs: Tesla Powerwall, LG ESS, BYD, CATL, Samsung SDI
Manufacturer data sheets provide a baseline, but the conditions matter. All figures below are verified from technical documentation, warranty filings, or independent test reports. Where a manufacturer quotes DC RTE, an estimated AC-AC figure is added.
| Product | Chemistry | Quoted RTE | AC or DC | Notes |
|---|---|---|---|---|
| BYD Battery-Box Premium HVM | LFP | 96% | AC-AC | Hybrid inverter included; tested at 0.2C rate |
| Tesla Powerwall 2 | NMC | 90% | AC-AC | Measured at 25°C; firmware updates may adjust BMS thresholds |
| LG ESS Home 10 | NMC | 94.5% | DC-DC | Estimated ~89% AC-AC with standalone inverter |
| CATL LUNA2000 (Huawei) | LFP | 95.5% | DC-DC | Modular expansion; 5–20 kWh stacks |
| Samsung SDI SBB | NMC | 93% | DC-DC | Commercial and residential variants available |
| SonnenBatterie Eco | LFP | 92% | AC-AC | All-in-one system with integrated inverter and BMS |
Manufacturers test at ideal conditions: 25°C ambient, 0.2C charge and discharge rates, and new cells with fewer than 50 cycles. Real-world installations operate at variable temperatures, higher C-rates during peak shaving, and accumulated calendar aging. Expect real-world RTE to fall 2–4 percentage points below quoted figures.
The BYD and SonnenBatterie systems quote AC-AC RTE because they ship with integrated inverters. This removes ambiguity — the number reflects what the homeowner measures. Products quoting DC RTE require the designer to model inverter losses separately. Warning: do not mix DC and AC figures in the same financial model. A proposal assuming 96% RTE for a DC-quoted battery with a 97% inverter will overstate performance by 5–6 percentage points.
Model Battery Performance in Your Solar Projects
SurgePV’s generation and financial tool runs degradation scenarios and lifetime yield calculations automatically.
Book a DemoNo commitment required · 20 minutes · Live project walkthrough
For a direct comparison, see Arka 360 vs SurgePV.
How RTE Affects Solar Self-Consumption and Financial Returns
Round-trip efficiency is not an abstract specification. It directly determines how much money a battery saves, how fast it pays back, and whether a self-consumption target is achievable.
Consider a 10 kWh battery cycled once daily, 365 days per year, with a utility rate of $0.15 per kWh.
At a hypothetical 100% RTE, the battery shifts 10 kWh × 365 = 3,650 kWh annually. At $0.15 per kWh, that equals $547.50 per year in avoided grid imports.
At a realistic 90% AC RTE and 85% DoD, usable energy per cycle is 7.65 kWh. Annual shifted energy becomes 7.65 kWh × 365 = 2,792 kWh. At $0.15 per kWh, savings drop to $418.84 per year. Also see: Us Residential Solar Market Trends 2026.
The unrealized savings are $128.66 per year. Over a 15-year system life, that compounds to $1,930 in lost value — more than the installed cost of some battery inverters. If the designer promised payback in 8 years using 100% efficiency assumptions, the actual payback stretches past 10 years.
The error cascades into solar self-consumption design. Imagine a 5 kW solar array generating 7,000 kWh per year. The designer targets 60% self-consumption, meaning 4,200 kWh stays on-site rather than exporting to the grid. The battery is sized to absorb excess daytime production and discharge it in the evening.
If the designer assumes 95% RTE but the system delivers 88%, the battery absorbs 7% less storage capacity per cycle. Over a year, that gap forces an extra 200–250 kWh onto the grid as uneconomical export. The client misses their self-consumption target, export payments may not cover the shortfall, and the installer faces a callback.
Warranty language adds another layer of risk. Some manufacturers warrant remaining capacity — for example, 70% of original capacity at year 10 — but they do not warrant RTE. A battery can pass a 70% capacity test while RTE has fallen from 96% to 88%. The client still has 7 kWh of storage, but each cycle costs more in lost energy, and the effective daily throughput shrinks. Solar proposal software should model both capacity fade and RTE fade separately so clients see the full depreciation curve.
Improving Round-Trip Efficiency: What Installers Can Control
Not all losses are fixed. Installers can improve system RTE by 3–8 percentage points through design choices and maintenance practices.
1. Prefer DC-coupled or hybrid architectures Eliminating one AC-DC conversion step improves system RTE by 3–5 percentage points. On new builds, specify DC-coupled battery storage with a hybrid inverter. On retrofits where AC-coupling is unavoidable, select high-efficiency battery inverters rated at 98% or above. See Adding Battery Storage Services for detailed guidance.
2. Right-size the inverter An oversized inverter operating at 10–20% of rated load wastes conversion efficiency. Match the inverter continuous rating to the battery’s maximum charge and discharge rate. If the battery peaks at 5 kW, a 10 kW inverter spends most of its time in a low-efficiency zone. Downsize to 5–6 kW unless future expansion is planned.
3. Manage temperature Install batteries in conditioned, shaded, or ventilated spaces. Unheated garages in cold climates trigger resistive heating draws. Direct sun exposure in hot climates forces cooling cycles. Even a 5°C reduction in average cell temperature improves RTE by 0.5–1 percentage point and slows calendar aging simultaneously. Shadow analysis software identifies shading issues before installation.
4. Limit charge and discharge rates Lower C-rates reduce resistive losses. Charging a 10 kWh battery at 2 kW (0.2C) instead of 5 kW (0.5C) cuts I²R heat generation by more than half. Where time-of-use windows allow, program slower charging schedules.
5. Keep firmware updated BMS firmware updates improve cell balancing algorithms, reduce parasitic balancing currents, and refine state-of-charge estimation. A 2023 firmware update for one major residential battery reduced standby draw by 8W — a 0.8 percentage point improvement in annual RTE.
6. Use accurate modeling software Build real RTE figures into every proposal. Show year-1 RTE, year-10 RTE, and year-15 RTE side by side. Clients who see 90% today and 86% in year 10 set realistic expectations. Clients who see 100% forever receive a fantasy. Solar design software that automates these projections prevents manual spreadsheet errors and keeps every proposal consistent.
Conclusion
A 10 kWh label does not mean 10 kWh delivered. Round-trip efficiency, inverter losses, BMS overhead, depth-of-discharge limits, and wiring resistance compound to reduce usable energy by 10–25% in AC-coupled systems. A 10 kWh battery at 90% RTE and 85% DoD yields 7.65 kWh at the load — not a defect, but physics.
LFP chemistry leads on DC RTE at 95–99%, but system architecture determines what the homeowner experiences. DC-coupled designs skip one inverter conversion and deliver 3–6 percentage points higher AC RTE. AC-coupled retrofits face two conversions and should be modeled at 85–94%.
The financial impact is measurable. A designer who ignores RTE overstates savings by $1,900 or more over a 15-year project life. A designer who models it accurately builds trust, prevents warranty disputes, and sizes storage that performs as promised.
Use solar design software that applies architecture-specific RTE assumptions, chemistry-specific degradation curves, and year-by-year capacity fade. Your clients will see realistic numbers. Your callbacks will drop. And your 10 kWh batteries will deliver exactly what you said they would.
Frequently Asked Questions
What is round-trip efficiency in a solar battery?
Round-trip efficiency is the percentage of energy you get back after storing and discharging electricity. If you put 10 kWh into a battery and get 9 kWh out, the RTE is 90%. It accounts for inverter, chemistry, and BMS losses in a complete cycle.
How do you calculate round-trip efficiency?
Use the formula: RTE = (Energy_discharged / Energy_charged) × 100%. Measure both values at the same point — typically the AC meter — to get an accurate system-level figure.
What is a good round-trip efficiency for a solar battery?
For AC-coupled systems, 85–94% is typical. For DC-coupled systems, 92–97%. LFP batteries generally score higher than NMC, lead-acid, or flow batteries.
What is the difference between AC and DC round-trip efficiency?
DC RTE measures losses inside the battery only. AC RTE includes inverter and wiring losses for the complete system. AC RTE is what the homeowner’s meter measures and what matters for financial modeling.
Which battery chemistry has the highest round-trip efficiency?
Lithium iron phosphate (LFP) typically leads with 95–99% DC RTE, followed by NMC at 92–96%. Lead-acid tops out at 75–85%.
What causes energy loss in a battery round-trip cycle?
Energy is lost to inverter conversion heat, BMS balancing and monitoring power, thermal management for heating or cooling, resistive losses in wiring and protection devices, and internal cell resistance during chemical storage. Each layer removes 0.5–4% of the original energy.
Does round-trip efficiency drop over time?
Yes. Calendar aging increases internal resistance and thickens the SEI layer, which raises resistive losses per cycle. A battery may ship at 96% DC RTE and operate at 93–94% after 10 years even if its capacity warranty still has years remaining.
Can inverter improvements help round-trip efficiency?
Yes. Modern silicon carbide (SiC) inverters reach 99% peak efficiency and maintain higher efficiency at partial load. Hybrid inverters that eliminate one conversion step improve system RTE by 3–5 percentage points compared to AC-coupled retrofits with separate battery inverters.