Quick Answer
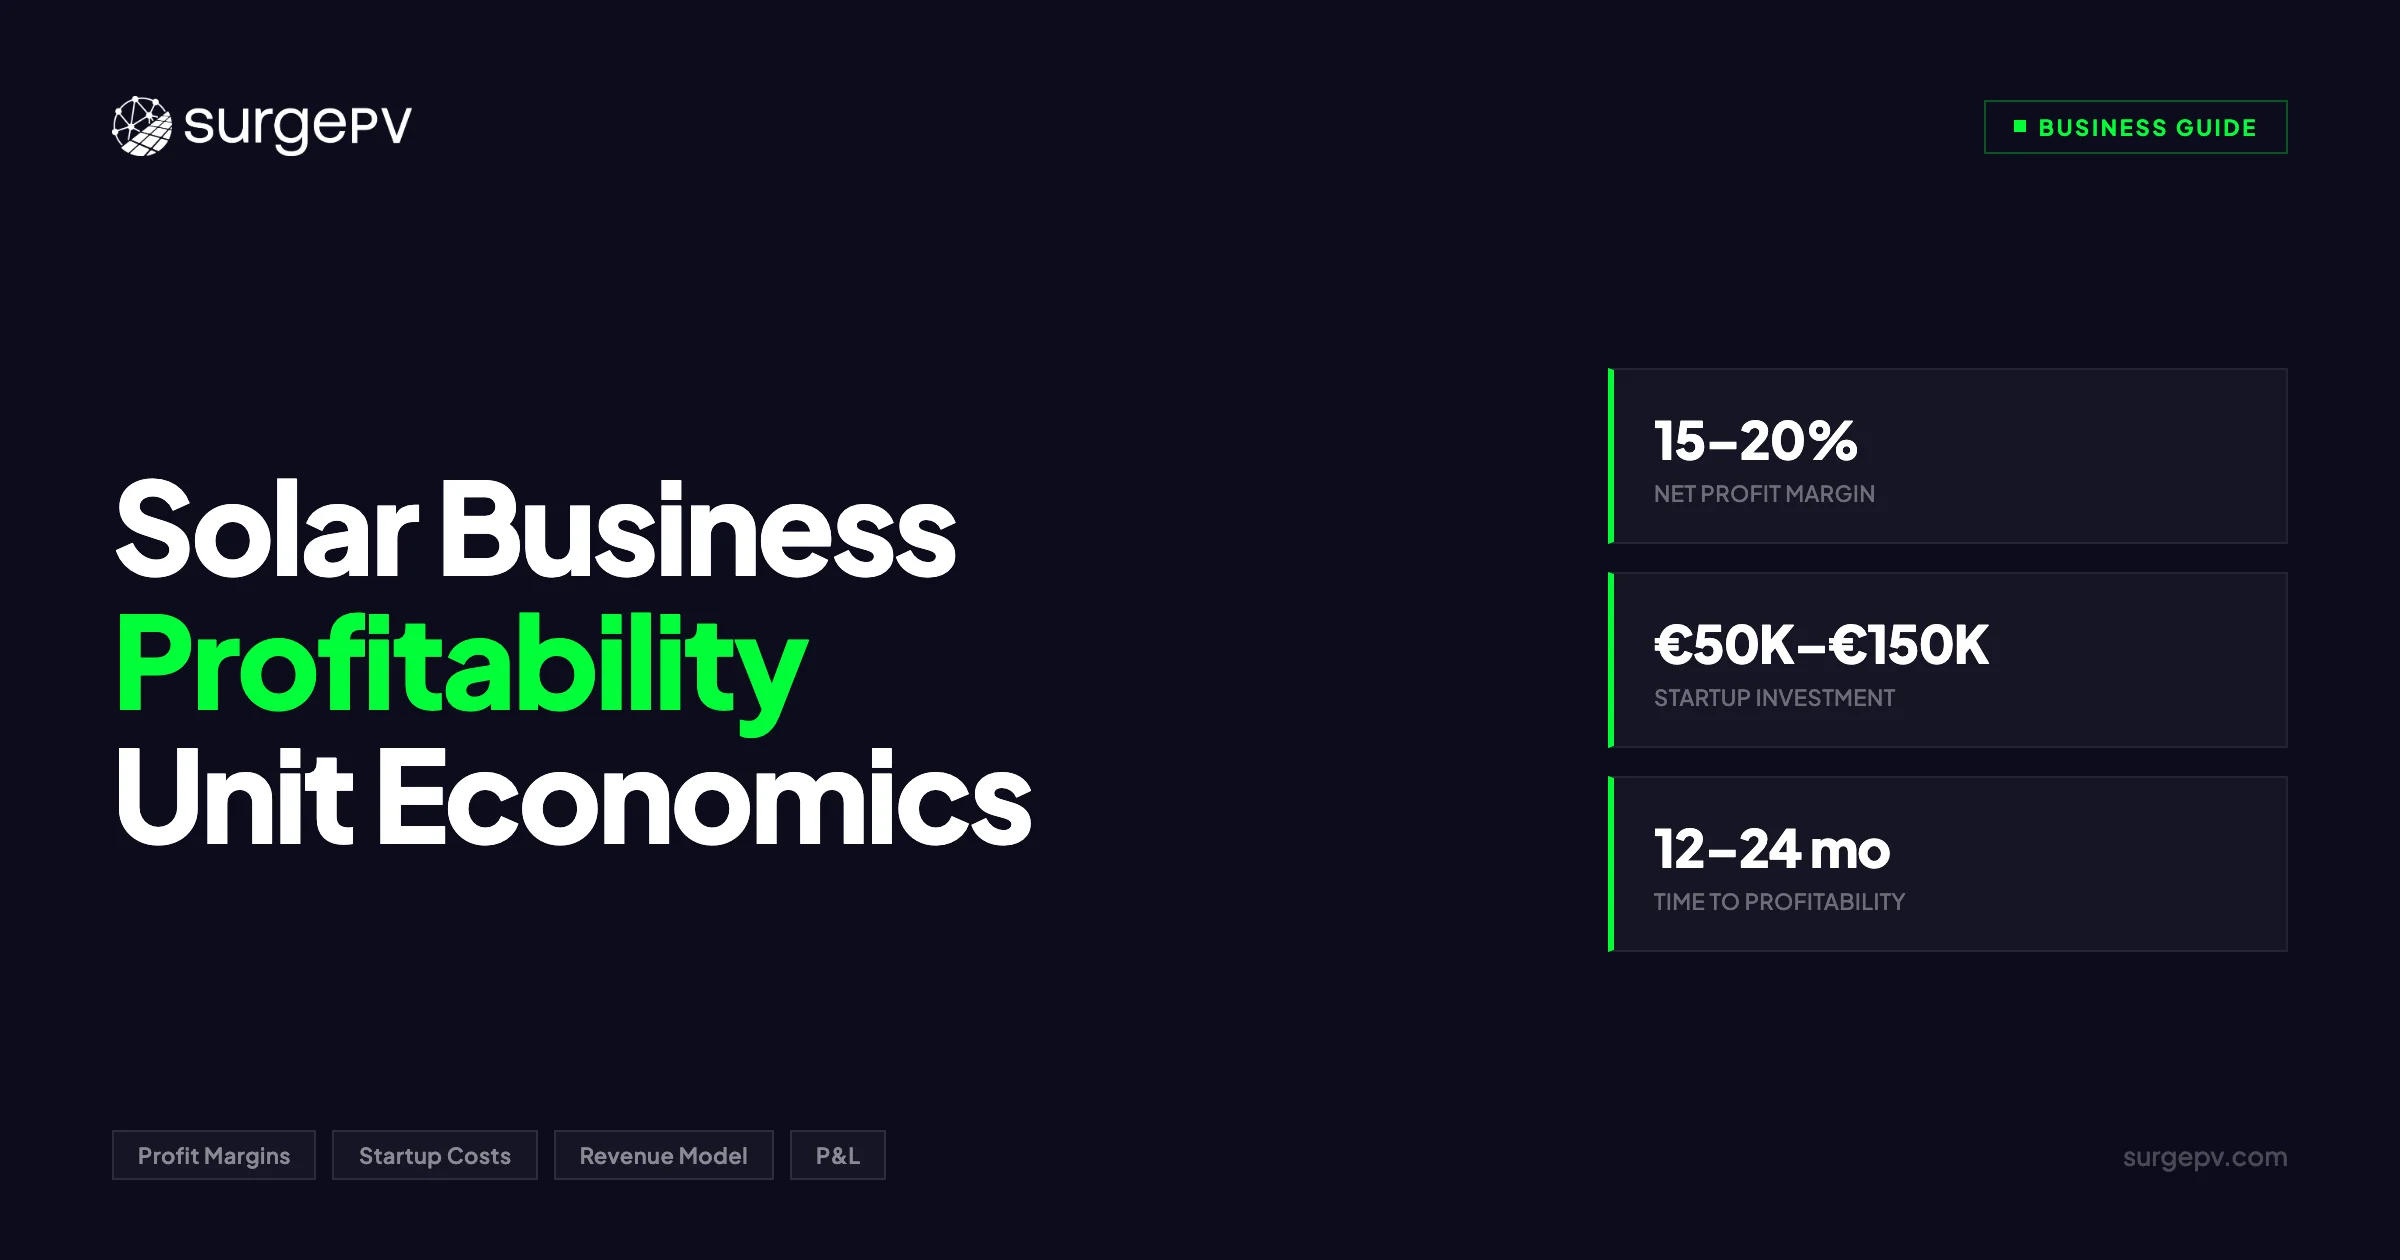
Profitable solar businesses maintain 25–35% gross margins and 8–15% net margins. Key drivers: low customer acquisition cost ($1,000–$3,000), efficient installation (1–2 days residential), and high add-on sales (batteries, EV chargers). Top performers achieve $3–5M revenue per installation crew annually.
The European solar market added over 65 GW of new capacity in 2025. Module prices hit record lows. Electricity prices stayed above €0.25/kWh across most of the continent. Also see: European Solar Incentives. For Europe-specific compliance details, see Europe solar compliance.
Profitable solar businesses maintain 25–35% gross margins and 8–15% net margins. Key drivers: low customer acquisition cost ($1,000–$3,000), efficient installation (1–2 days residential), and high add-on sales (batteries, EV chargers). Top performers achieve $3–5M revenue per installation crew annually.
Profitable solar businesses maintain 25–35% gross margins and 8–15% net margins. Key drivers: low customer acquisition cost ($1,000–$3,000), efficient installation (1–2 days residential), and high add-on sales (batteries, EV chargers). Top performers achieve $3–5M revenue per installation crew annually.
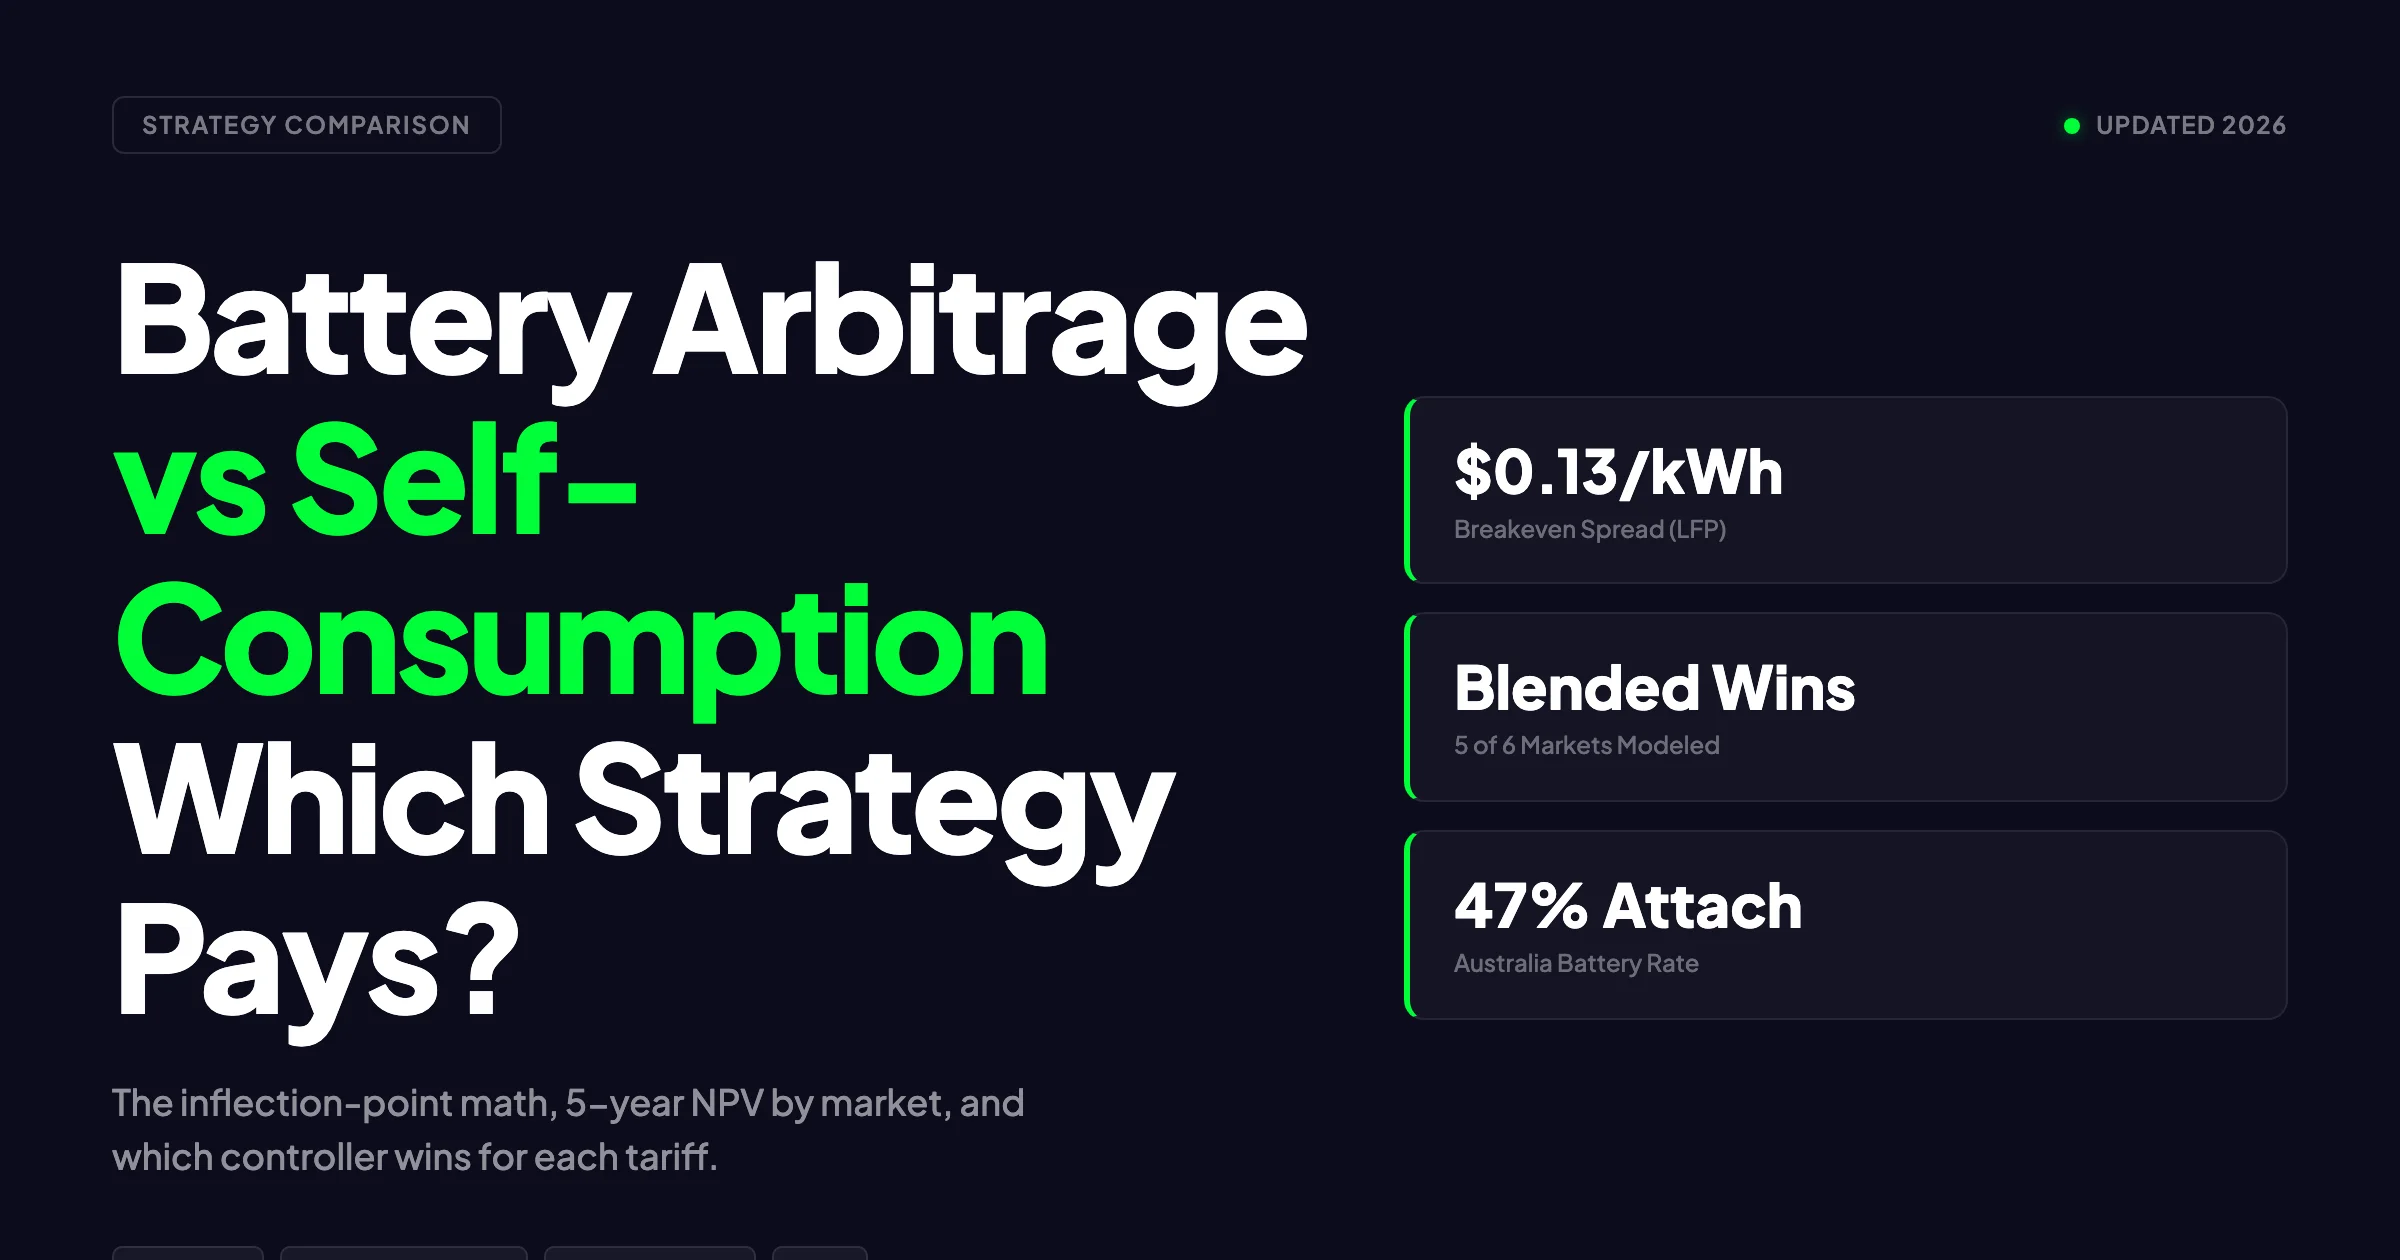
But “the market is growing” is not a business plan. The difference between a profitable solar company and one that fails within three years comes down to unit economics: revenue per job, cost per job, close rate, customer acquisition cost, and overhead structure.
Key Findings — Solar Business Unit Economics
Net profit margin: 15–20% for well-run residential installers
Revenue per residential job: €8,000–€18,000 (varies by market and system size)
Gross profit per residential job: €2,500–€5,400
Startup costs: €50,000–€150,000 depending on scale
Time to profitability: 6–12 months at 6+ installations/month
Customer acquisition cost: €400–€1,200 per signed contract
Close rate (industry average): 15–25%, rising to 25–35% with professional proposals
What this guide covers:
- Solar market opportunity and the installer supply gap
- Revenue models: residential vs. commercial, one-time vs. recurring
- Full cost structure and sample P&L for a 10-installation-per-month company
- How design and proposal software directly reduces soft costs
- Complete startup checklist with cost estimates
Section 1: Solar Market Opportunity
Market Size and Growth
SolarPower Europe projects cumulative installed capacity to exceed 500 GW by 2027, up from roughly 340 GW at end of 2025. Annual additions run at 60–70 GW across the EU. Germany alone added over 16 GW in 2025, and Poland, Italy, and Spain each add 4–8 GW annually. Also see: solar panel ROI in Italy. Also see: Germany solar subsidies. Also see: Spain net metering.
For installers, the relevant metric is not gigawatts — it is the number of individual projects. A 16 GW residential and commercial market translates to hundreds of thousands of installation jobs per year. Also see: Us Residential Solar Market Trends 2026.
The Installer Supply Gap
Demand for installations is growing faster than the supply of qualified installers. The European solar workforce grew roughly 30% between 2022 and 2025, but project volumes grew faster. In Germany, lead times for residential installations stretched to 8–14 weeks in high-demand regions. See our guide on Community Solar Projects Germany for more. See Community Solar Business Model for detailed guidance.
This supply gap is good news for new entrants. It means:
- Pricing pressure is moderate. Customers cannot always shop five quotes because there are not five available installers.
- Lead flow is strong. Referrals and inbound inquiries come more easily in undersupplied markets.
- Margins hold up. When installers are scarce, discounting is less common.
Why Companies Still Fail
Despite favorable conditions, solar installation businesses still fail. The most common reasons are not market-related:
- Underpriced bids. New entrants undercut incumbents to win jobs, then discover their margins cannot cover overhead.
- Poor cash flow management. Solar projects involve upfront material costs and delayed customer payments. Companies that cannot bridge the gap run out of cash.
- High customer acquisition cost. Spending €1,500–€2,000 per lead while closing at 15% means €8,000–€13,000 to acquire one customer. That destroys margins on a €12,000 job.
- Inaccurate proposals. Designs that do not match site conditions lead to change orders, delays, and margin erosion.
The companies that survive are the ones that control their unit economics from the start.
Section 2: Revenue Model — Residential vs. Commercial
Residential Revenue
Residential solar is where most new installers start. Lower capital requirements, simpler permitting, and shorter sales cycles make it accessible.
| Revenue Component | Typical Range | Notes |
|---|---|---|
| System price (6–10 kWp) | €8,000–€15,000 | Varies by market, panel tier, and mounting complexity |
| Battery add-on (5–10 kWh) | €4,000–€8,000 | Attach rate rising: 30–50% of residential jobs include storage |
| EV charger add-on | €800–€1,500 | Growing cross-sell opportunity |
| Monitoring/service contract | €100–€200/year | Recurring revenue, 20–30% adoption rate |
| Average revenue per residential job | €10,000–€18,000 | Including storage attach rate |
The battery attach rate is the single biggest variable in residential revenue per job. A company selling storage on 40% of jobs versus 15% has dramatically different revenue per customer with minimal incremental sales cost.
Commercial Revenue
Commercial projects (50–500 kWp) offer higher revenue per job but require more working capital, longer sales cycles, and specialized technical capacity.
| Revenue Component | Typical Range | Notes |
|---|---|---|
| System price (50–200 kWp) | €40,000–€180,000 | €800–€1,100/kWp installed |
| O&M contract (annual) | €1,500–€5,000/year | Higher adoption rate than residential (50–70%) |
| Monitoring platform | €500–€1,200/year | Often bundled with O&M |
| Average revenue per commercial job | €60,000–€150,000 | Highly variable by system size |
Residential vs. Commercial Comparison
| Factor | Residential | Commercial |
|---|---|---|
| Revenue per job | €10,000–€18,000 | €60,000–€150,000 |
| Gross margin | 30–40% | 20–30% |
| Sales cycle | 2–6 weeks | 2–6 months |
| Working capital needed | Low–moderate | High |
| Customer acquisition cost | €400–€1,200 | €2,000–€8,000 |
| Technical complexity | Low–moderate | Moderate–high |
| Repeat business | Low (one roof) | Moderate (portfolio owners) |
| Recurring revenue potential | Low | Moderate–high (O&M contracts) |
Most profitable installers operate in both segments, using residential volume for cash flow stability and commercial projects for higher absolute margins.
Recurring Revenue: O&M and Monitoring
Every system you install is a potential O&M customer for 20–25 years.
At €150/year per residential system and 25% adoption, a company installing 100 systems per year builds €3,750/year in recurring revenue from each cohort. After five years, that is €18,750 in annual recurring revenue from O&M alone — at 60–70% gross margins.
Section 3: Cost Structure — Full P&L Breakdown
Understanding where the money goes matters more than knowing how much comes in.
Cost of Goods Sold (COGS): 50–60% of Revenue
COGS includes everything directly tied to delivering a single installation:
| Cost Category | % of Revenue | Per Job (€10,000 job) | Notes |
|---|---|---|---|
| Modules | 20–25% | €2,000–€2,500 | Commodity pricing, bulk discounts available |
| Inverter | 8–12% | €800–€1,200 | String vs. micro affects cost |
| Mounting system | 5–8% | €500–€800 | Roof type affects complexity |
| BOS (cables, connectors, etc.) | 3–5% | €300–€500 | Often underestimated |
| Battery (if included) | 15–20% | €1,500–€2,000 | Only on storage jobs |
| Subcontracted labor | 10–15% | €1,000–€1,500 | If not using in-house crews |
| Total COGS | 50–60% | €5,000–€6,000 |
The two largest COGS levers are module procurement pricing and labor efficiency. Annual volume agreements with distributors save 5–10% on hardware. Optimized crew scheduling saves 10–20% on labor per job.
Sales and Marketing: 8–12% of Revenue
| Cost Category | % of Revenue | Monthly Cost | Notes |
|---|---|---|---|
| Digital advertising | 3–5% | €2,000–€5,000 | Google Ads, social media |
| Sales staff compensation | 3–5% | €3,000–€5,000 | Base + commission |
| CRM and sales tools | 0.5–1% | €200–€500 | Proposal software, CRM |
| Events and local marketing | 1–2% | €500–€1,500 | Trade shows, local sponsorships |
| Total sales and marketing | 8–12% | €5,700–€12,000 |
Customer acquisition cost (CAC) runs €400–€1,200 per signed residential contract, varying widely by lead source:
| Lead Source | Cost per Lead | Close Rate | Effective CAC |
|---|---|---|---|
| Referrals | €0–€50 | 25–35% | €0–€200 |
| Organic inbound (SEO/website) | €30–€80 | 20–30% | €100–€400 |
| Google Ads | €80–€200 | 10–20% | €400–€2,000 |
| Lead aggregators | €50–€150 | 5–15% | €350–€3,000 |
| Door-to-door | €100–€250 | 8–15% | €700–€3,000 |
The lowest-CAC companies invest in referral programs, organic content, and professional proposals that increase close rates. A company closing at 30% spends half as much per customer as one closing at 15%. See our guide on marketing for solar installers.
Labor: 15–20% of Revenue
| Role | Monthly Cost | Notes |
|---|---|---|
| Installation crew (2-person team) | €6,000–€9,000 | Fully loaded cost per crew |
| Project manager / lead electrician | €4,000–€6,000 | Oversees quality and compliance |
| Designer / engineer | €3,500–€5,000 | System design and permitting (or automated) |
| Admin / office support | €2,500–€3,500 | Scheduling, procurement, invoicing |
For a company running 10 residential installations per month, you need approximately 1.5–2 installation crews, one project manager, and one designer. Total labor cost: €16,000–€23,000 per month.
Overhead: 5–10% of Revenue
| Category | Monthly Cost | Notes |
|---|---|---|
| Office / warehouse rent | €1,000–€3,000 | Location dependent |
| Vehicle costs | €1,500–€3,000 | Lease, fuel, insurance for 2–3 vehicles |
| Insurance (GL, WC, professional) | €500–€1,200 | Varies by jurisdiction and coverage |
| Accounting and legal | €500–€1,000 | Monthly bookkeeping + annual filings |
| Software (design, CRM, accounting) | €300–€800 | Per-seat licensing |
| Miscellaneous | €300–€500 | Supplies, training, incidentals |
| Total overhead | €4,100–€9,500 |
Software: 1–2% of Revenue
Software costs are small in absolute terms but have outsized impact on profitability. Solar design software affects close rates, design accuracy, proposal quality, and permitting speed — the highest-leverage variables in solar unit economics.
| Software Category | Monthly Cost | Impact Area |
|---|---|---|
| Solar design and simulation | €100–€300 | Design accuracy, proposal quality |
| CRM | €50–€150 | Lead management, pipeline visibility |
| Proposal generation | €50–€200 | Close rates, sales velocity |
| Accounting | €30–€80 | Financial management |
| Project management | €30–€100 | Crew scheduling, job tracking |
| Total software | €260–€830 |
At €500/month against €100,000/month in revenue, software is 0.5% of revenue. If it increases close rates from 15% to 25% and reduces design errors by 80%, the ROI is several hundred percent.
Sample P&L: 10 Residential Installations per Month
Here is a complete monthly P&L for a solar installation company doing 10 residential jobs per month at an average ticket of €12,000:
| Line Item | Monthly (€) | % of Revenue |
|---|---|---|
| Revenue | 120,000 | 100% |
| Modules | 27,000 | 22.5% |
| Inverters | 12,000 | 10.0% |
| Mounting and BOS | 10,800 | 9.0% |
| Installation labor (subcontracted) | 14,400 | 12.0% |
| Total COGS | 64,200 | 53.5% |
| Gross Profit | 55,800 | 46.5% |
| Sales team compensation | 4,800 | 4.0% |
| Digital marketing | 3,600 | 3.0% |
| Other marketing | 1,200 | 1.0% |
| Total Sales & Marketing | 9,600 | 8.0% |
| Designer / engineer | 4,500 | 3.8% |
| Project manager | 5,000 | 4.2% |
| Admin | 3,000 | 2.5% |
| Total Labor (non-installation) | 12,500 | 10.4% |
| Office and warehouse | 2,000 | 1.7% |
| Vehicles | 2,500 | 2.1% |
| Insurance | 1,000 | 0.8% |
| Software | 500 | 0.4% |
| Accounting and legal | 750 | 0.6% |
| Miscellaneous | 400 | 0.3% |
| Total Overhead | 7,150 | 6.0% |
| Total Operating Expenses | 29,250 | 24.4% |
| Net Operating Profit | 26,550 | 22.1% |
| Taxes (estimated 25%) | 6,640 | 5.5% |
| Net Profit After Tax | 19,910 | 16.6% |
At 10 jobs per month and €12,000 average revenue, this company generates roughly €20,000 in monthly net profit, or €240,000 annually. Increase the average ticket to €15,000 (by selling more battery systems), and annual net profit rises to €340,000 on the same cost base.
Pro Tip
The fastest path to improving profitability is not winning more jobs. It is increasing revenue per job through battery attach rates and reducing cost per job through design automation. A company that moves its battery attach rate from 20% to 45% and cuts design time from 3 hours to 45 minutes improves net margin by 3–5 percentage points without selling a single additional system.
Section 4: How Software Reduces Soft Costs
Soft costs — everything that is not hardware — account for 40–60% of total residential solar system cost. They include design labor, sales time, permitting, customer acquisition, and project management.
Design Time Savings
Manual solar system design using generic CAD tools takes 2–4 hours per residential project: roof measurement, panel layout, string sizing, shading analysis, and production simulation. At €4,500/month and 10 projects per month, design labor costs €450 per job. See Solar Shading Analysis Guide for detailed guidance.
With solar design software that automates 3D modeling, panel placement, and shadow analysis, design time drops to 30–60 minutes. Design labor per job falls to €75–€150. That saves €300–€375 per job. Over 120 annual installations, that is €36,000–€45,000 in saved design labor alone.
Proposal Quality and Close Rates
Close rates correlate directly with proposal quality:
| Proposal Type | Typical Close Rate | Revenue per 100 Leads |
|---|---|---|
| Basic email quote (price + kWp only) | 10–15% | €100,000–€150,000 |
| Standard proposal (design + savings) | 15–22% | €150,000–€220,000 |
| Professional proposal (3D visualization, financial analysis, sensitivity) | 25–35% | €250,000–€350,000 |
The difference between a basic quote and a professional proposal is €100,000–€200,000 in revenue per 100 leads.
Solar proposal software that generates branded, detailed proposals with accurate financial projections increases close rates and reduces the time reps spend creating each proposal.
Auto-BOM and Procurement Accuracy
Manual bill-of-materials generation introduces errors. Missing components, incorrect quantities, and wrong specifications cause procurement rework and installation delays.
A single BOM error — wrong inverter model, missing MC4 connectors, or incorrect cable lengths — costs €200–€500 in rework plus a half-day crew delay. Over 120 annual installations, even a 10% error rate means 12 jobs with rework costs of €2,400–€6,000. Auto-BOM eliminates this.
Total Software Impact on Profitability
| Improvement Area | Annual Savings/Revenue Gain | How |
|---|---|---|
| Design time reduction | €36,000–€45,000 | 3 hrs → 45 min per project |
| Close rate improvement | €50,000–€100,000+ | Better proposals, 10+ point increase |
| BOM accuracy | €2,400–€6,000 | Eliminate manual errors |
| Reduced change orders | €5,000–€12,000 | Accurate designs match site conditions |
| Faster permitting | €3,000–€8,000 | Auto-generated compliance docs |
| Total annual impact | €96,400–€171,000 |
Against annual software costs of €3,000–€8,000, the return on investment is 12x–57x. Software is the highest-ROI line item on any solar company’s P&L.
See How SurgePV Cuts Soft Costs by 40%
From 3D design to financial proposals to auto-BOM, SurgePV streamlines every step that eats into your margins. See it on a real project.
Book a DemoNo commitment required · 20 minutes · Live project walkthrough
For a direct comparison, see Arka 360 vs SurgePV.
Section 5: Startup Checklist — Launching a Solar Installation Business
Here is the complete startup checklist with cost estimates across legal, financial, operational, marketing, and technology.
1. Licensing and Legal Setup
| Item | Cost Estimate | Timeline | Notes |
|---|---|---|---|
| Business registration | €200–€500 | 1–2 weeks | Varies by country (GmbH, Ltd, SAS, etc.) |
| Electrical contractor license | €1,000–€5,000 | 2–8 weeks | Required in most EU markets |
| Solar-specific certifications | €500–€2,000 | 1–4 weeks | MCS (UK), Qualifelec (France), etc. |
| Building/roofing permits authority | €300–€1,000 | 2–6 weeks | Market dependent |
| Legal setup (contracts, T&Cs) | €1,500–€3,000 | 2–4 weeks | Customer contracts, subcontractor agreements |
| Total licensing and legal | €3,500–€11,500 |
Key Takeaway
Licensing requirements vary significantly by country. In Germany, you need a Meisterpflicht (master craftsman requirement) for electrical work, which means either holding the qualification yourself or employing someone who does. In the UK, MCS certification is required to install systems eligible for the Smart Export Guarantee. Research your specific market before budgeting.
See our guide on Battery Solar System Design UK for more. For the latest details on UK, see Heritage Building Solar Case Study. For United Kingdom-specific compliance details, see United Kingdom comparisons/mcs-vs-non-mcs.
2. Insurance
| Coverage Type | Annual Cost | Why Required |
|---|---|---|
| General liability | €2,000–€5,000 | Covers property damage and bodily injury |
| Professional indemnity | €1,000–€3,000 | Covers design errors and advice |
| Workers’ compensation | €2,000–€5,000 | Mandatory in most jurisdictions |
| Commercial vehicle | €1,000–€2,500 | For work vehicles |
| Tools and equipment | €500–€1,000 | Covers theft and damage |
| Total insurance | €6,500–€16,500 |
Do not underinsure. A single rooftop accident or a fire caused by a wiring error can bankrupt an underinsured company. Budget for full coverage from day one.
3. Equipment and Vehicles
| Item | Cost Estimate | Notes |
|---|---|---|
| Work vehicle (van/truck) | €15,000–€35,000 | Used is fine for startup; needs roof rack and secure storage |
| Hand tools and power tools | €3,000–€5,000 | Drills, crimpers, multimeters, torque wrenches |
| Safety equipment | €1,500–€3,000 | Harnesses, hard hats, PPE, fall protection |
| Ladders and scaffolding | €1,000–€2,500 | Access equipment for residential roofs |
| Testing equipment | €1,500–€3,000 | IV curve tracer, insulation tester, thermal camera |
| Total equipment | €22,000–€48,500 |
4. First Hires
For a startup doing 4–8 residential installations per month:
| Role | When to Hire | Monthly Cost | Notes |
|---|---|---|---|
| Lead installer / electrician | Day 1 | €3,500–€5,000 | Must hold electrical qualifications |
| Installation assistant | Day 1 | €2,500–€3,500 | Can train on the job |
| Designer (part-time) | Month 1–3 | €1,500–€2,500 | Or use automated design software |
| Sales rep | Month 2–4 | €2,500–€4,000 | Base + commission structure |
| Admin / bookkeeper | Month 3–6 | €1,500–€2,500 | Part-time initially |
A key startup decision: hire a full-time designer (€3,500–€5,000/month for 8–12 projects) or invest in solar design software (€100–€300/month) that lets your sales team handle design. The software route saves €3,000–€4,000/month from day one.
5. Software Stack
| Tool | Monthly Cost | Purpose |
|---|---|---|
| Solar design and proposals | €100–€300 | System design, simulation, proposal generation |
| CRM | €30–€100 | Lead tracking, pipeline management |
| Accounting | €20–€50 | Invoicing, expenses, tax compliance |
| Project management | €15–€50 | Job scheduling, crew management |
| Communication | €10–€30 | Email, phone system |
| Total software | €175–€530 |
The generation and financial tool built into SurgePV handles design, simulation, financial analysis, and proposal generation in a single platform. That consolidation reduces total software cost and eliminates data transfer between tools.
Total Startup Cost Summary
| Category | Lean Startup | Full-Service Launch |
|---|---|---|
| Licensing and legal | €3,500 | €11,500 |
| Insurance (first year) | €6,500 | €16,500 |
| Equipment and vehicles | €22,000 | €48,500 |
| Working capital (3 months) | €15,000 | €45,000 |
| Marketing launch | €5,000 | €15,000 |
| Software setup | €500 | €1,500 |
| Total | €52,500 | €138,000 |
A lean residential startup can launch for under €55,000. A full-service operation starts closer to €140,000. These figures assume one installation crew and exclude office space.
Break-Even Timeline
With monthly fixed costs of €12,000–€15,000 and gross profit per job of €3,000–€5,000:
| Installations per Month | Monthly Gross Profit | Monthly Fixed Costs | Monthly Net Profit |
|---|---|---|---|
| 2 | €6,000–€10,000 | €12,000–€15,000 | -€5,000 to -€2,000 |
| 4 | €12,000–€20,000 | €12,000–€15,000 | €0 to €5,000 |
| 6 | €18,000–€30,000 | €13,000–€16,000 | €5,000 to €14,000 |
| 8 | €24,000–€40,000 | €14,000–€17,000 | €10,000 to €23,000 |
| 10 | €30,000–€50,000 | €15,000–€18,000 | €15,000 to €32,000 |
Most startups reach break-even at 4–5 installations per month, achievable within three to six months in undersupplied markets with strong referral networks.
Pro Tip
Your first 10 installations are your most important marketing asset. Deliver outstanding quality, document every project with photos, and ask for reviews and referrals before the final invoice. Referral leads close at 25–35% and cost almost nothing. That early reputation compounds for years.
For detailed strategies on building your customer pipeline, see solar sales conversion and solar business growth strategies. And for structuring financing offers that help close more deals, review the solar financing options guide.
Pro Tip
Use our free ROI and Payback Calculator to model break-even timelines for different installation volumes, average ticket sizes, and overhead structures before committing to a business plan.
Further Reading
Explore our Solar Business hub for guides on scaling operations, managing crews, and building a sustainable solar company.
Frequently Asked Questions
How much profit does a solar installer make per installation?
Net profit per residential installation typically ranges from €1,200 to €3,600, assuming 15–20% net margins on revenue of €8,000–€18,000 per job. Commercial projects generate higher absolute profit (€5,000–€25,000 per job) but often carry thinner percentage margins of 10–15%. The biggest profitability lever is soft cost efficiency: companies that use automated design and solar proposal software save €300–€500 per job in design labor alone.
How much does it cost to start a solar installation business?
A lean startup focusing on residential installations requires €50,000–€80,000, covering licensing, insurance, a work vehicle, basic tools, initial marketing, and three months of working capital. A full-service operation starts at €120,000–€200,000.
The most common mistake is underestimating working capital. You pay for materials before the customer pays you. Budget for at least three months of operating expenses in cash reserves.
Is starting a solar business still profitable in 2026?
Yes. European solar demand continues to grow at 15–20% annually, module costs are near historic lows, and electricity prices above €0.25/kWh drive strong customer ROI. The key profitability driver is operational efficiency. Companies that control soft costs through solar design platform, accurate proposals from the generation and financial tool, and streamlined permitting consistently outperform on margins.
How many installations per month to break even?
A small residential installer with monthly fixed costs of €12,000–€15,000 and gross profit of €3,000–€5,000 per job needs 4–5 installations per month to break even. At 8–10 installations per month, profitability becomes meaningful: €10,000–€23,000 in monthly net profit. Most new businesses reach break-even within six to twelve months with consistent lead flow and close rates above 20%.