Quick Answer
European electricity prices in 2026 range from €0.20/kWh in Hungary to €0.45/kWh in Denmark. Higher prices make self-consumption more valuable: a German household at €0.35/kWh saves €1,200–€1,800/year with a 6 kWp system, versus €700–€1,000 in Poland at €0.22/kWh. Solar ROI improves by 1–3 years for every €0.10/kWh increase in retail rates.
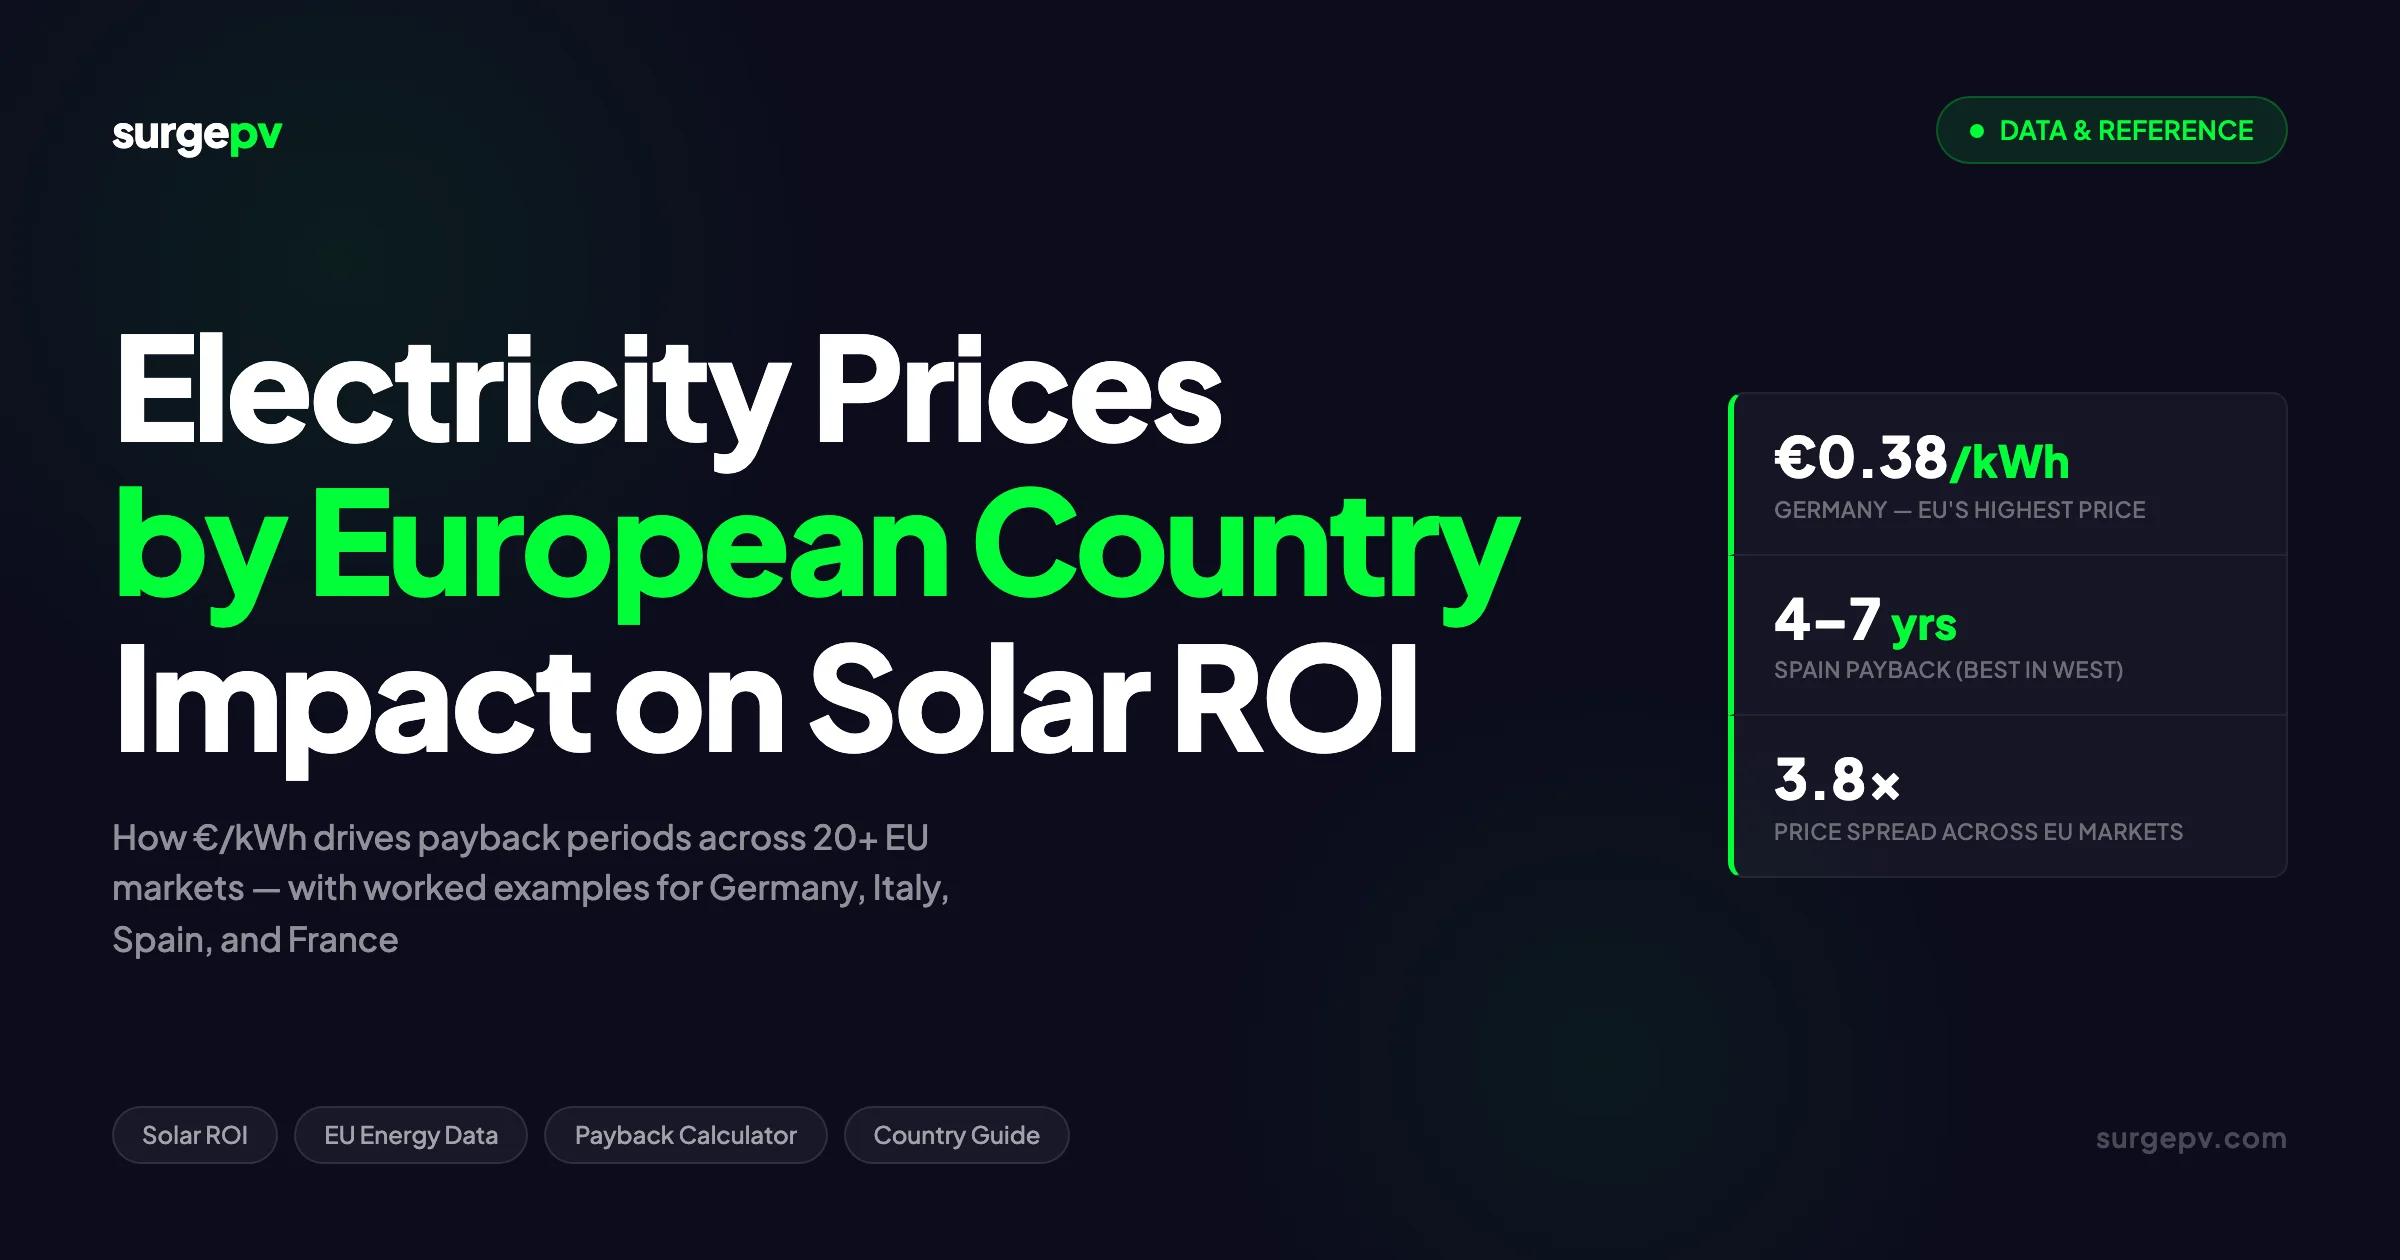
Electricity price is the single variable that determines whether solar pays back in 5 years or 15. Across Europe, residential rates span from €0.10/kWh in Hungary to €0.38/kWh in Germany — a 3.8× difference that reshapes every ROI calculation. Understanding where your market sits on that spectrum, and why, is the foundation of every credible solar investment case in 2026. Also see: Germany solar subsidies. For Germany-specific information, see Community Solar Projects Germany.
European electricity prices in 2026 range from €0.20/kWh in Hungary to €0.45/kWh in Denmark. Higher prices make self-consumption more valuable: a German household at €0.35/kWh saves €1,200–€1,800/year with a 6 kWp system, versus €700–€1,000 in Poland at €0.22/kWh. Solar ROI improves by 1–3 years for every €0.10/kWh increase in retail rates.
European electricity prices in 2026 range from €0.20/kWh in Hungary to €0.45/kWh in Denmark. Higher prices make self-consumption more valuable: a German household at €0.35/kWh saves €1,200–€1,800/year with a 6 kWp system, versus €700–€1,000 in Poland at €0.22/kWh. Solar ROI improves by 1–3 years for every €0.10/kWh increase in retail rates.
TL;DR — Electricity Prices and Solar ROI in Europe
EU residential electricity prices averaged €0.2872/kWh in H1 2025. Germany led at €0.38/kWh; Hungary sat lowest at €0.10/kWh. For solar ROI, the combination of price and irradiance determines payback: Spain (moderate price, very high sun) leads with 4–7 year paybacks; Italy (high price, high sun) follows at 5–8 years; Germany (highest price, low sun) averages 7–10 years; Hungary (lowest price) rarely pays back before 15 years.
For Italy-specific information, see Commercial Rooftop Solar Case Study Italy.
In this guide:
- Eurostat electricity price data for 20+ European countries, H1 2025
- The payback formula with worked examples for Germany, Italy, Spain, and France
- How taxes and levies distort price comparisons across markets
- Self-consumption ratio: the variable that matters more than electricity price alone
- Export tariff comparison across key EU markets
- Commercial vs residential ROI dynamics
- How to model price escalation scenarios for 25-year return projections Also see: solar panel ROI in Italy. Also see: France solar feed-in tariffs. Also see: Spain net metering.
European Electricity Prices by Country — H1 2025 Data
The table below uses official Eurostat electricity price statistics for residential consumers in the 2,500–5,000 kWh/year consumption band — the most relevant reference for residential solar ROI. Payback estimates assume a standard 6 kWp residential system with typical irradiance and self-consumption ratios for each country; treat them as directional benchmarks, not project quotes.
| Country | Residential €/kWh (H1 2025) | YoY Change | Solar Irradiance kWh/m²/y | Est. Residential Payback (6 kWp) |
|---|---|---|---|---|
| Germany | €0.38 | -3.1% | 900–1,100 | 7–10 years |
| Belgium | €0.36 | -5.2% | 900–1,000 | 8–11 years |
| Denmark | €0.35 | +17.2% | 900–1,050 | 9–12 years |
| Italy | €0.33 | +2.1% | 1,200–1,900 | 5–8 years |
| Czech Republic | €0.31 | +2.8% | 1,000–1,100 | 8–11 years |
| Ireland | €0.31 | +25.9% | 800–1,000 | 10–14 years |
| Luxembourg | €0.26 | +31.3% | 950–1,100 | 8–11 years |
| France | €0.27 | +0.4% | 1,000–1,500 | 7–10 years |
| Netherlands | €0.27 | -6.8% | 900–1,050 | 5–8 years* |
| Austria | €0.26 | -1.5% | 1,000–1,300 | 7–10 years |
| Spain | €0.26 | -1.2% | 1,400–1,800 | 4–7 years |
| EU Average | €0.29 | -0.5% | — | — |
| Portugal | €0.23 | +15.1% | 1,400–1,800 | 5–8 years |
| Poland | €0.21 | +20.0% | 950–1,100 | 8–12 years |
| Greece | €0.21 | +26.9% | 1,400–1,900 | 6–9 years |
| Sweden | €0.20 | -2.1% | 800–1,100 | 10–14 years |
| Romania | €0.17 | +8.3% | 1,100–1,400 | 9–13 years |
| Finland | €0.14 | -9.8% | 700–1,050 | 14–20 years |
| Bulgaria | €0.13 | +4.2% | 1,200–1,600 | 13–18 years |
| Malta | €0.12 | -3.1% | 1,800–2,000 | 11–16 years |
| Hungary | €0.10 | +3.5% | 1,200–1,400 | 15–20 years |
*Netherlands figure applies while the Saldering net-metering scheme is active. The 1:1 offset phases down annually through 2031; payback extends to 9–12 years post-phase-out without battery storage. Read Adding Battery Storage Services for a complete walkthrough.
Three Patterns That Define the European Price Map
Northern and Western Europe pays the most. Germany, Belgium, and Denmark dominate the top of the table. Taxes and levies account for 45–50% of the German and Danish household bill — the Energieabgaben, grid charges, and concession fees built up over two decades of Energiewende policy. High base prices create strong solar savings per kWh, but lower irradiance compared to southern Europe limits annual production.
Southern Europe combines rising prices with excellent solar resources. Italy (€0.33/kWh) and Portugal (€0.23/kWh) both saw prices increase in H1 2025, while their irradiance of 1,400–1,900 kWh/m²/year drives strong annual output. Payback periods of 5–8 years in both markets represent some of the strongest residential solar investment cases in the EU.
Eastern Europe splits sharply between legacy-regulated markets and rapidly liberalizing ones. Hungary and Bulgaria sit at regulated tariffs near €0.10–0.13/kWh, making solar economics challenging. But Poland (+20% YoY), Greece (+26.9%), and Romania (+8.3%) are repricing fast. For these markets, the price trajectory matters as much as the current level.
The Payback Formula: How Electricity Price Drives Solar ROI
The core calculation is straightforward. Where installers and analysts go wrong is oversimplifying it.
Simple Payback Period = Net System Cost ÷ Annual Savings
Annual Savings = (Production × Self-Consumption Rate × Electricity Price) + (Production × Export Rate × Export Tariff)
Breaking this down:
- Production: System size (kWp) × annual irradiance yield (kWh/kWp/year for the specific location)
- Self-consumption rate: Share of solar production used directly on-site — typically 25–45% for residential without battery storage
- Electricity price: The avoided cost per kWh at the full retail tariff, including taxes
- Export rate: Share of production sent to the grid (1 minus self-consumption rate)
- Export tariff: What the grid pays per exported kWh — consistently lower than the retail tariff in most EU markets
The key insight: electricity price only applies to the self-consumed fraction at full retail value. Exported energy earns a fraction of that. This is why self-consumption optimization matters as much as electricity price in low-export-tariff markets.
For a deeper treatment of NPV and IRR alongside simple payback, see our post on solar NPV, IRR, and payback period calculations.
Worked Example: Germany (6 kWp Residential)
- System cost: €9,000 (€1,500/kWp — mid-range German CAPEX)
- Annual production: 5,400 kWh (900 kWh/kWp/year — southern Germany benchmark)
- Self-consumption: 30% = 1,620 kWh at €0.38/kWh = €616
- Exported: 70% = 3,780 kWh at €0.082/kWh (EEG Marktwert premium) = €310
- Total annual benefit: €926
- Simple payback: 9,000 ÷ 926 = 9.7 years
- 25-year net return: (926 × 25) − 9,000 = €14,150
Worked Example: Spain (6 kWp Residential)
- System cost: €8,100 (€1,350/kWp — competitive Spanish CAPEX)
- Annual production: 9,000 kWh (1,500 kWh/kWp/year — central Spain benchmark)
- Self-consumption: 40% = 3,600 kWh at €0.26/kWh = €936
- Exported: 60% = 5,400 kWh at €0.06/kWh (compensation tariff) = €324
- Total annual benefit: €1,260
- Simple payback: 8,100 ÷ 1,260 = 6.4 years
- 25-year net return: (1,260 × 25) − 8,100 = €23,400
Worked Example: Italy, Central (6 kWp Residential)
- System cost: €9,300 (€1,550/kWp); after 50% Detrazione Fiscale, effective net cost €4,650
- Annual production: 7,800 kWh (1,300 kWh/kWp/year — Rome benchmark)
- Self-consumption: 35% = 2,730 kWh at €0.33/kWh = €901
- Exported: 65% = 5,070 kWh at €0.10/kWh (Scambio sul Posto) = €507
- Total annual benefit: €1,408
- Payback without incentive: 9,300 ÷ 1,408 = 6.6 years
- Payback with 50% deduction: 4,650 ÷ 1,408 = 3.3 years effective
Worked Example: France (6 kWp Residential)
- System cost: €10,200 (€1,700/kWp — France carries the EU’s highest residential CAPEX)
- Annual production: 6,600 kWh (1,100 kWh/kWp/year — Île-de-France benchmark)
- Self-consumption: 30% = 1,980 kWh at €0.27/kWh = €535
- Exported: 70% = 4,620 kWh at €0.13/kWh (Obligation d’Achat) = €601
- Total annual benefit: €1,136
- Simple payback: 10,200 ÷ 1,136 = 9.0 years
- 25-year net return: (1,136 × 25) − 10,200 = €18,200
Pro Tip: Run These Numbers in Your Design Tool
These examples use static electricity prices and benchmark yield estimates. Real projects need location-specific irradiance data, hourly load profiles, and multi-year price escalation scenarios. SurgePV’s generation and financial tool models all of these variables together with country-specific incentive parameters.
For a direct comparison, see Arka 360 vs SurgePV.
Country-by-Country Solar ROI Analysis
Germany: Highest Prices, Constrained by Irradiance
Germany’s residential electricity price of €0.38/kWh is the EU’s highest by a meaningful margin. That price level would produce exceptional solar ROI if Germany had Mediterranean sun. It does not.
Average irradiance in Germany ranges from 900 kWh/m²/year in the north (Hamburg) to 1,100 kWh/m²/year in southern Bavaria. Italy reaches 1,900 kWh/m²/year in Palermo; Spain averages 1,500 kWh/m²/year nationally. The irradiance gap costs roughly 2–3 years of payback relative to southern European benchmarks.
The residential payback of 7–10 years is still strong by global standards. In Bavaria — where prices meet their highest domestic irradiance — a well-designed 8–10 kWp system can break even under 8 years without any subsidy. For Global-specific compliance details, see Global net-metering-by-country. For Global-specific compliance details, see Global solar-permitting-speed-by-country.
Germany’s non-household electricity price averaged approximately €0.19/kWh in H1 2025. German commercial operators also benefit from accelerated depreciation (EStG) and the ability to size systems above 30 kWp, where economies of scale push CAPEX to €900–1,100/kWp. C&I payback periods of 5–7 years are realistic for rooftop systems in the 50–200 kWp range.
German export tariff (EEG 2023): Systems registered in 2024–2026 receive €0.082/kWh for systems under 10 kWp, or €0.071/kWh for 10–40 kWp, guaranteed for 20 years. The gap between the €0.38/kWh retail rate and the €0.082/kWh export rate — €0.298/kWh — is exactly why maximizing self-consumption is the primary lever in German solar economics.
Belgium: High Prices, Prosumer Policy Adding Complexity
Belgium’s residential electricity price of €0.36/kWh is the EU’s second-highest. But Belgian solar policy changed significantly in 2022–2023 with the prosumer tariff (prosumententarief) — a capacity charge applied to solar owners using the grid for backup, effectively raising the cost of grid-dependent operation.
The prosumer tariff applies per kVA of installed inverter capacity. For a 6 kWp system with a 6 kVA inverter, annual prosumer charges typically run €200–350 depending on the distribution network operator. This partially offsets the benefit of self-consumption savings.
The result: Belgian residential payback periods of 8–11 years, versus 6–8 years before the prosumer tariff. Raising self-consumption above 40% — with home battery storage — is now essential to maintain strong Belgian solar returns.
Green certificates (groenestroomcertificaten) remain available in Flanders and Wallonia, providing additional revenue for the first 10–15 years of system operation.
Italy: The European Sweet Spot
Italy best combines high electricity prices with high solar irradiance. At €0.33/kWh, it ranks fourth in the EU for residential prices. Its irradiance spans from 1,200 kWh/m²/year in Milan to 1,900 kWh/m²/year in Palermo. For a full regional breakdown, see our post on solar panel ROI in Italy.
The 50% Detrazione Fiscale (Ecobonus) halves the effective system cost for residential owners who pay Italian income tax, reducing payback to 3–5 years in the south and 4–6 years in the center-north.
Scambio sul Posto (net metering via GSE) compensates exported energy at approximately €0.08–0.13/kWh. The gap between the retail rate and the export rate creates the same self-consumption incentive as elsewhere — but Italy’s irradiance is high enough that strong savings materialize even at conservative self-consumption assumptions.
Spain: Best Raw Payback in Western Europe
Spain’s electricity price of €0.26/kWh is medium by EU standards — sitting at the EU average. What makes Spain the continent’s fastest-payback solar market is irradiance: 1,400–1,800 kWh/m²/year across most of the country, with Andalusia reaching 1,900–2,000 kWh/m²/year.
For a 6 kWp system in Seville:
- Annual production: ~11,400 kWh (1,900 kWh/kWp/year)
- 40% self-consumption = 4,560 kWh × €0.26 = €1,186
- 60% exported = 6,840 kWh × €0.06 = €410
- Total annual benefit: €1,596
- System cost: ~€8,100
- Payback: 5.1 years — before any incentives
Municipal tax incentives (IBI and ICIO reductions) cut effective system cost by 20–50% in many Spanish municipalities, pushing payback below 4 years in southern Spain.
Spain demonstrates that irradiance outweighs electricity price in the raw ROI calculation. Despite paying €0.12/kWh less than Germany, a Spanish homeowner achieves a faster payback because the solar asset produces 50–70% more energy per kWp installed.
France: Strong Export Tariff Partially Compensates for High CAPEX
France’s electricity price (€0.27/kWh) is middle-of-the-EU, but the French residential solar market has a distinct financial structure. The Obligation d’Achat (OA) feed-in tariff pays €0.13–0.16/kWh for exported energy — the highest guaranteed export tariff in Western Europe for residential systems. For France-specific information, see Agricultural Solar Case Study.
This elevated export rate partially compensates for France’s lower irradiance (1,000–1,200 kWh/m²/year in the north; 1,400–1,500 kWh/m²/year in the south). In southern France — Montpellier, Marseille, Nice — solar economics approach Italian returns. In Paris or Lyon, payback periods of 8–10 years are realistic.
French CAPEX is the EU’s highest for residential at €1,500–2,200/kWp. Labor regulation and permitting costs drive this premium. A reduced VAT rate of 5.5% for solar installations on residential buildings (in force since 2020) provides partial offset.
Key Takeaway: Export Tariff vs Self-Consumption Tariff
France’s €0.13–0.16/kWh export tariff vs Germany’s €0.082/kWh means a French homeowner earns 60–95% more per exported kWh. But Germany’s €0.38/kWh retail rate means a German homeowner saves 41% more per self-consumed kWh. The optimal strategy in France leans toward maximum production (larger systems, full export); in Germany, it leans toward self-consumption optimization (heat pumps, EV charging, battery storage).
Netherlands: Net Metering Phase-Out Changes Everything
The Netherlands occupied an unusual position: residential electricity prices around €0.27/kWh plus the Saldering net-metering scheme (1:1 billing offset for all exported energy) produced effective payback periods of 5–7 years — some of the fastest in northern Europe.
The Saldering scheme is being phased out. The 1:1 offset steps down annually: 64% in 2025, 54% in 2026, 44% in 2027, 26% in 2028, and full phase-out by 2031. After phase-out, exported energy earns approximately €0.06/kWh (spot-linked) instead of the retail equivalent.
For Dutch systems installed in 2026, the ROI calculation must model this transition:
- Near-term (2026–2028) effective benefit: ~€1,400–1,600/year for a 6 kWp system (while Saldering remains partial)
- Post-2031 benefit (no Saldering): ~€700–900/year (self-consumption only)
Average blended payback for a 2026 installation: approximately 8–10 years over a 25-year lifespan. Battery storage that raises self-consumption from 30% to 60%+ can push this toward 7–8 years by reducing Saldering dependency.
Poland: Rising Prices, Improving ROI
Poland’s residential electricity price is currently €0.21/kWh — mid-table. But Poland saw the third-largest year-on-year increase in H1 2025 at +20%, following above-15% increases in 2023–2024. The trajectory points up.
Poland adopted a net metering reform in 2022 that replaced 1:1 offset with an 80% buy-back model — the prosumer system where exported energy is credited at 80% of the spot market rate. Self-consumption optimization is now standard practice in Polish solar design.
Poland’s irradiance (950–1,100 kWh/m²/year) is better than its geographic position might suggest — comparable to Bavaria or Austria. With CAPEX of €900–1,300/kWp, residential payback periods of 8–12 years are typical at current prices. If the 20%/year price increase trajectory continues even partially, Polish solar economics improve materially.
Denmark: Highest Tax Share Meets Low Irradiance
Denmark’s electricity price of €0.35/kWh is among Europe’s highest, with taxes and levies representing approximately 47.7% of the bill — the EU’s highest share. From a solar ROI perspective this matters: the full retail tariff is the avoided cost, regardless of how much is tax.
Denmark’s irradiance (900–1,050 kWh/m²/year) limits annual production. Combined with relatively high CAPEX, residential payback periods run 9–12 years. Denmark’s solar market is most active in agri-PV and large C&I rooftop, where scale and self-consumption optimization improve the economics.
Portugal and Greece: Rising Prices, Excellent Sun
Portugal and Greece both saw sharp electricity price increases in H1 2025 — Portugal +15.1%, Greece +26.9% — despite starting from below-EU-average levels. Portugal’s residential price reached approximately €0.23/kWh; Greece approximately €0.21/kWh.
Both markets offer irradiance of 1,400–1,900 kWh/m²/year — comparable to southern Spain and northern Italy. The combination of improving price economics and excellent solar resources makes both markets increasingly attractive in 2026.
Portugal’s residential payback benchmark sits at 5–8 years under the Autoconsumo scheme, which provides reasonable export compensation (approximately €0.08–0.10/kWh). Greece’s reformed virtual net metering scheme (updated 2024) offers similar credit structures.
Hungary and Bulgaria: Low Prices Limit Returns
Hungary (€0.10/kWh) and Bulgaria (€0.13/kWh) represent the EU’s lowest residential electricity prices. These rates reflect regulated tariff structures and historical energy policy choices.
Even with reasonable irradiance (Hungary: 1,200–1,400 kWh/m²/year; Bulgaria: 1,200–1,600 kWh/m²/year), residential solar payback periods of 15–20+ years make these markets very challenging for unsubsidized homeowner investment. Commercial solar is more viable due to CAPEX economies of scale.
The near-term risk for these markets is upward price pressure as regulated tariff distortions gradually unwind. A market moving from €0.10 to €0.15/kWh over 3–5 years will see solar ROI improve dramatically.
Price Components: Energy, Network, and Taxes
Understanding why prices differ across Europe requires looking beneath the headline tariff. Every household electricity bill contains three main components:
| Component | What It Covers | Share of EU Average Bill |
|---|---|---|
| Energy | Generation cost (wholesale power market) | 38–45% |
| Network | Grid transmission and distribution | 25–35% |
| Taxes and Levies | VAT, renewable levies, concession fees | 25–35% |
The Tax Multiplier Effect on Solar ROI
From a solar ROI perspective, all three components create savings value. When a solar system offsets 1 kWh of grid consumption, it avoids the full retail price — including taxes. This makes solar ROI calculations in high-tax markets particularly strong, because the solar system acts as a tax shield on every kWh of self-consumed production.
Germany’s 47–52% tax share means that a German homeowner avoiding €0.38/kWh of retail electricity is avoiding €0.18–0.20/kWh in taxes per kWh. No other common household investment achieves this effect at scale.
For the cost side of the solar investment, European solar VAT rates vary significantly across markets and affect the upfront price of the system itself.
Denmark’s Structural Peak
Denmark’s high electricity price with a 47.7% tax share — the EU’s highest proportion — also creates time-variable grid tariffs that peak during morning and evening demand hours. Solar systems paired with smart home management (EV charging, heat pump scheduling during midday) can bias production benefits toward these high-tariff periods and improve effective ROI beyond what static calculations suggest.
Netherlands’ Negative Tax Share
The Netherlands is the EU’s only country with a negative effective tax share for residential electricity in H1 2025 (-13.6%), reflecting government subsidies and energy allowances that reduce the net household bill below the pre-tax base rate. These subsidies suppress the retail price, reducing the per-kWh value of solar self-consumption. As Dutch government energy allowances reduce over coming years, residential prices will rise and solar returns will improve.
Commercial Solar: Different Electricity Price Dynamics
Non-household electricity prices in the EU averaged €0.1902/kWh in H1 2025 — 34% below the €0.2872/kWh residential average. Ireland held the highest non-household rate at €0.2726/kWh; Finland the lowest at €0.0804/kWh.
Despite lower per-kWh prices, commercial solar often delivers better ROI than residential. Three factors drive this:
Lower CAPEX per kWp. Commercial systems (50–500 kWp) benefit from economies of scale in equipment, installation, and engineering. Where a German residential system runs €1,200–1,800/kWp, a 200 kWp German C&I rooftop often prices at €800–1,050/kWp installed.
Higher self-consumption rates. A warehouse, factory, or commercial building running Monday–Friday during daylight hours achieves 40–70% self-consumption of solar production — versus the 25–35% typical in a residential home with occupants at work. Higher self-consumption means more value captured at the full commercial tariff.
Tax treatment. Commercial solar installations are depreciable assets. In Germany, Italy, France, Spain, and most EU markets, C&I solar can be depreciated over 10–20 years against taxable profits. Italy’s Superammortamento and Germany’s degressive depreciation (AfA) are examples of mechanisms that improve after-tax ROI beyond simple payback calculations.
The net result: C&I payback periods of 4–7 years in Germany and 3–6 years in Italy are achievable for well-structured projects — faster than most residential systems despite lower per-kWh electricity prices.
Model Solar ROI for Any European Market
SurgePV’s generation and financial tool calculates payback periods, NPV, and IRR for residential and commercial projects using country-specific electricity prices, CAPEX benchmarks, and incentive parameters.
Book a DemoNo commitment required · 20 minutes · Live project walkthrough
Self-Consumption Ratio: The Variable That Changes Everything
Of all the inputs in the solar ROI equation, self-consumption ratio receives the least attention and has the most impact on returns in low-export-tariff markets.
In Germany, the gap between the retail tariff (€0.38/kWh) and the export tariff (€0.082/kWh) is €0.298/kWh. Each percentage point increase in self-consumption rate improves annual savings by approximately €22 for a 6 kWp system producing 5,400 kWh/year. Raising self-consumption from 30% to 50% improves annual savings by €440 — a 48% improvement — without any change in system size or electricity price.
Self-consumption optimization strategies that work at residential scale:
Smart load shifting. Dishwashers, washing machines, and EV charging controlled by solar generation signals. A 7 kWh EV charge from midday solar production displaces €2.66 of grid electricity (at German rates) per charge event — roughly €700/year if charged daily.
Heat pump integration. A 4 kW air-source heat pump running on solar during peak production hours can consume 8–12 kWh per day, raising self-consumption from 30% to 55% during heating seasons.
Battery storage. A 10 kWh home battery raises self-consumption from 30–35% to 60–70% for a typical 6–8 kWp system. At German electricity prices, the annual savings improvement justifies battery payback of 8–12 years. In markets with very low export tariffs — Belgium after prosumer reform, Netherlands post-Saldering — batteries become financially attractive at current module and battery prices.
The solar design software used for site assessment should model actual load profiles to determine the realistic self-consumption rate before finalizing system size. Generic 30% assumptions understate returns for households with EV charging or heat pumps.
For country-specific guidance on self-consumption rules and compensation schemes, see our post on solar self-consumption rules across Europe.
Export Tariff Comparison Across Key EU Markets
| Country | Export Tariff | Type | Duration |
|---|---|---|---|
| Germany | €0.082/kWh (under 10 kWp) | EEG guaranteed feed-in | 20 years |
| France | €0.13–0.16/kWh | Obligation d’Achat (OA) | 20 years |
| Italy | €0.08–0.13/kWh | Scambio sul Posto | Ongoing |
| Spain | €0.05–0.07/kWh | Compensation tariff (PVPC linked) | Ongoing |
| Netherlands | €0.27/kWh equiv. (Saldering 2025, declining) | Net metering (1:1 offset, phasing out) | Until 2031 |
| Belgium | €0.05–0.08/kWh | Spot market (minus prosumer charge) | Ongoing |
| Poland | ~€0.06/kWh (80% of spot) | Prosumer buy-back | Ongoing |
| Portugal | €0.08–0.10/kWh | Autoconsumo scheme | Ongoing |
| Greece | €0.06–0.09/kWh | Virtual net metering (reformed 2024) | Ongoing |
Wide variance in export tariffs significantly affects ROI for systems with high export ratios. France’s €0.13–0.16/kWh guaranteed export rate is the most attractive in Western Europe; Germany’s 20-year guarantee provides certainty but is set below wholesale market levels. Both are far above what Spain, Poland, or Belgium offer for exports.
The strategic implication: in France, larger systems with higher export ratios are financially defensible. In Germany, Spain, Poland, and Belgium, system sizing should be matched to on-site consumption to maximize self-consumption value.
Projecting Returns in a Volatile Price Environment
Residential electricity prices across Europe have been volatile since 2021. The energy crisis pushed EU wholesale prices to 5–10× historical averages. Retail prices followed, though more slowly due to regulated retail structures. Since mid-2023, prices have moderated but remain above pre-crisis levels in most markets.
Renewable generation has materially affected wholesale prices. A 2026 analysis covering 19 EU countries found that renewable expansion reduced average electricity prices by 24.2% between 2023 and 2025. This dynamic — where more solar depresses the wholesale price on which export tariffs are sometimes based — is a structural feature of high-penetration solar markets.
For a 25-year solar investment, price trajectory matters enormously. Three scenarios for a 6 kWp German system (€9,000 system cost):
| Scenario | Price Assumption | Payback Year | 25-Year Net Return |
|---|---|---|---|
| Flat (real prices constant) | €0.38/kWh throughout | 9.7 years | €14,150 |
| Moderate escalation | +1.5%/year real | 8.1 years | €20,600 |
| High escalation | +3%/year real | 6.8 years | €29,800 |
| Price decline | -1%/year real | 12.4 years | €9,300 |
The same sensitivity analysis for Spain (€8,100 system cost):
| Scenario | Price Assumption | Payback Year | 25-Year Net Return |
|---|---|---|---|
| Flat | €0.26/kWh throughout | 6.4 years | €23,400 |
| Moderate escalation | +1.5%/year real | 5.5 years | €33,200 |
| High escalation | +3%/year real | 4.6 years | €47,100 |
| Price decline | -1%/year real | 8.1 years | €15,800 |
Key Takeaway: Self-Insurance Value
Beyond NPV calculations, a solar system provides real option value against future price increases. A homeowner who locks in a fixed-cost energy supply for 25 years is partially hedged against electricity market volatility — a benefit that does not appear in standard payback calculations but has real economic value, particularly in Eastern European markets with rapidly rising prices.
Countries with the most rapidly rising prices — Poland (+20% in H1 2025), Ireland (+25.9%), Greece (+26.9%), Luxembourg (+31.3%) — present a compelling forward-looking case. Current payback periods use today’s price. If even a fraction of these increases persists, solar installed in 2026 will look significantly better in retrospect.
How Incentives Modify the Country Picture
Raw electricity prices determine the value side of solar ROI. Incentives — tax credits, grants, feed-in premiums — operate on the cost side. The European solar incentives guide covers country-specific programs in detail; the summary below shows the payback impact for each major market.
| Country | Primary Incentive | Effective Cost Reduction | Payback Impact |
|---|---|---|---|
| Italy | 50% Detrazione Fiscale | 50% of system cost over 10 years | −3–4 years |
| Germany | No residential subsidy | — | — |
| Spain | IBI/ICIO municipal rebates | 20–50% of system cost (local) | −1–3 years |
| France | TVA 5.5% (reduced VAT) | ~15% cost reduction | −1 year |
| Belgium | Green certificates (Flanders/Wallonia) | €200–800/year for 10–15 years | −1–3 years |
| Netherlands | Saldering net metering (declining) | 1:1 grid offset (phasing out) | Temporary shortening |
| Poland | Mój Prąd (limited) | Variable per batch | −0.5–1 year |
| Portugal | Autoconsumo + regional grants | Variable | −1–2 years |
Italy’s 50% Detrazione Fiscale stands out as the EU’s most impactful residential solar incentive on a per-kWp basis. Combined with Italy’s high electricity price and high irradiance, it produces the EU’s best after-incentive residential ROI in central and southern regions. For the complete incentives picture across all EU markets, see the solar subsidies Europe 2026 tracker.
For European solar tax credits specifically, the picture varies significantly by country — Germany offers no residential credit while Italy effectively provides a 50% rebate.
Using Solar Software to Model Country-Specific ROI
The data in this article provides a market-level framework. Real project ROI depends on site-specific variables that market averages cannot capture: exact irradiance at the installation address, roof orientation and tilt, shading from adjacent structures, the customer’s actual load profile, and the specific tariff band they occupy. For more on this topic, see [Solar Shading Analysis Guide](/blog/solar-shading-analysis-guide).
Solar software built for professional use should combine:
- Location-specific irradiance from a calibrated database (PVGIS, Solargis, or equivalent)
- Shading analysis to determine actual yield reduction — our shadow analysis tool handles this at module level
- Load profile modeling to calculate self-consumption rates
- Country-specific tariff structures including retail price, export tariff, and prosumer charges
- Incentive parameters such as tax deduction schedules, grant amounts, and VAT rates
The output is a project-specific payback period, NPV, and IRR — not a country benchmark. Two houses 5 km apart in Germany can have 7-year and 11-year paybacks depending on roof orientation and daily energy usage patterns. Also see: Us Residential Solar Market Trends 2026.
For solar installers serving multiple European markets, solar proposal software that handles country-specific financial modeling in a consistent format makes it faster to generate investor-grade proposals across jurisdictions without rebuilding the calculation logic for each country.
Pro Tip: Site Assessment Before Financial Modeling
A shadow analysis for the specific roof surface changes the production estimate — and therefore the payback period — more than any other single input. Do not use generic country irradiance averages in client proposals without checking whether trees, neighboring buildings, or roof geometry reduce actual yield. A 20% shading loss on a German system adds 2+ years to payback.
Conclusion
Three things determine whether solar ROI in any European market is 5 years or 15:
- Electricity price: Every €0.01/kWh increase improves annual savings by roughly €16–22 on a standard 6 kWp residential system, shortening payback by 4–8 months.
- Irradiance: Spain’s 1,500+ kWh/m²/year advantage over Germany’s 900–1,000 kWh/m²/year translates into 60–70% more production per kWp — partially offsetting Germany’s price advantage.
- Self-consumption rate: In markets where export tariffs are low — Spain, Poland, Belgium post-reform — raising self-consumption from 30% to 50% improves annual savings by 30–40% without changing the system at all.
The strongest solar ROI markets in 2026 are those where high prices and high irradiance overlap: Italy and Portugal for residential investment with incentives; Spain for raw production value; Germany and Belgium for commercial systems optimized for self-consumption. The most interesting forward-looking opportunities are in rapidly repricing Eastern European markets — Poland, Greece, Romania — where today’s moderate ROI will look significantly stronger if price trends continue another 3–5 years.
For installers and advisors modeling these returns for clients, use site-specific tools rather than country averages, and present scenario analysis across flat, moderate, and high price-escalation assumptions. Solar delivers positive returns across a wide range of plausible European electricity futures — the analysis is about how fast and how much, not whether.
Frequently Asked Questions
Which European country has the highest electricity prices?
Germany has the highest residential electricity prices in the EU at €0.38/kWh (H1 2025, Eurostat). Belgium (€0.36/kWh) and Denmark (€0.35/kWh) rank second and third. These high prices make solar self-consumption especially valuable, though lower irradiance compared to southern Europe extends payback periods to 7–10 years.
How do electricity prices affect solar payback period in Europe?
Every €0.01/kWh increase in electricity price reduces the solar payback period by approximately 4–8 months for a typical 6 kWp residential system. A country paying €0.38/kWh (Germany) generates roughly 46% more annual savings from the same solar system than one paying €0.26/kWh (Spain). Irradiance amplifies or limits this effect — Germany’s lower sun exposure partially offsets its price advantage.
Where is solar ROI best in Europe?
Italy and Portugal offer the strongest combination of high electricity prices and high solar irradiance. Spain delivers the fastest payback periods — 4–7 years — driven by exceptional irradiance (1,400–1,800 kWh/m²/year) despite moderate electricity prices. Germany, despite having the EU’s highest electricity prices, sees 7–10 year paybacks because northern irradiance is 40–50% lower than Spanish levels.
Why are electricity prices so high in Germany?
Germany’s high electricity prices (€0.38/kWh) reflect a combination of renewable energy levies (Energieabgaben), concession fees, grid charges, and VAT. Taxes and levies account for approximately 45–52% of the German household electricity bill. The Energiewende transition required massive grid investment and early renewable subsidies, driving these levies higher from 2010–2022. A 2022 EEG levy cap reduced some charges, but retail prices remain the EU’s highest.
How does electricity price volatility affect long-term solar ROI projections?
Electricity price volatility introduces real uncertainty into 25-year solar projections. The most defensible approach models three scenarios: flat real prices, 1.5%/year real increase (historical EU average), and 3%/year increase (post-energy-crisis trajectory). A 6 kWp German system breaks even in 9.7 years at flat prices, 8.1 years with 1.5% annual increases, and 6.8 years with 3% annual increases.
Do commercial solar systems have better ROI than residential in Europe?
Commercial systems in the EU paid an average of €0.1902/kWh (H1 2025, Eurostat) — about 34% less than the residential average of €0.2872/kWh. However, commercial systems benefit from lower CAPEX per kWp, higher self-consumption rates (40–70%), and often accelerated depreciation tax treatment. Typical C&I payback periods in high-price markets like Germany and Italy range from 4–7 years.
Which European countries had the biggest electricity price increases recently?
In H1 2025 vs H1 2024, Luxembourg (+31.3%), Greece (+26.9%), Ireland (+25.9%), Poland (+20.0%), Denmark (+17.2%), and Portugal (+15.1%) saw the steepest residential price increases, according to Eurostat’s H1 2025 electricity price report. Rising prices improve solar ROI projections — every percentage point increase in electricity price shortens payback periods for systems installed today.