Quick Answer
Designing a residential solar system involves six steps: analyze historical electricity usage, assess roof condition and shading, size the system (typically 5–10 kW), select panels and inverter, design the layout, and prepare permit documentation. [Solar design software](/) automates calculations and generates NEC-compliant plans.
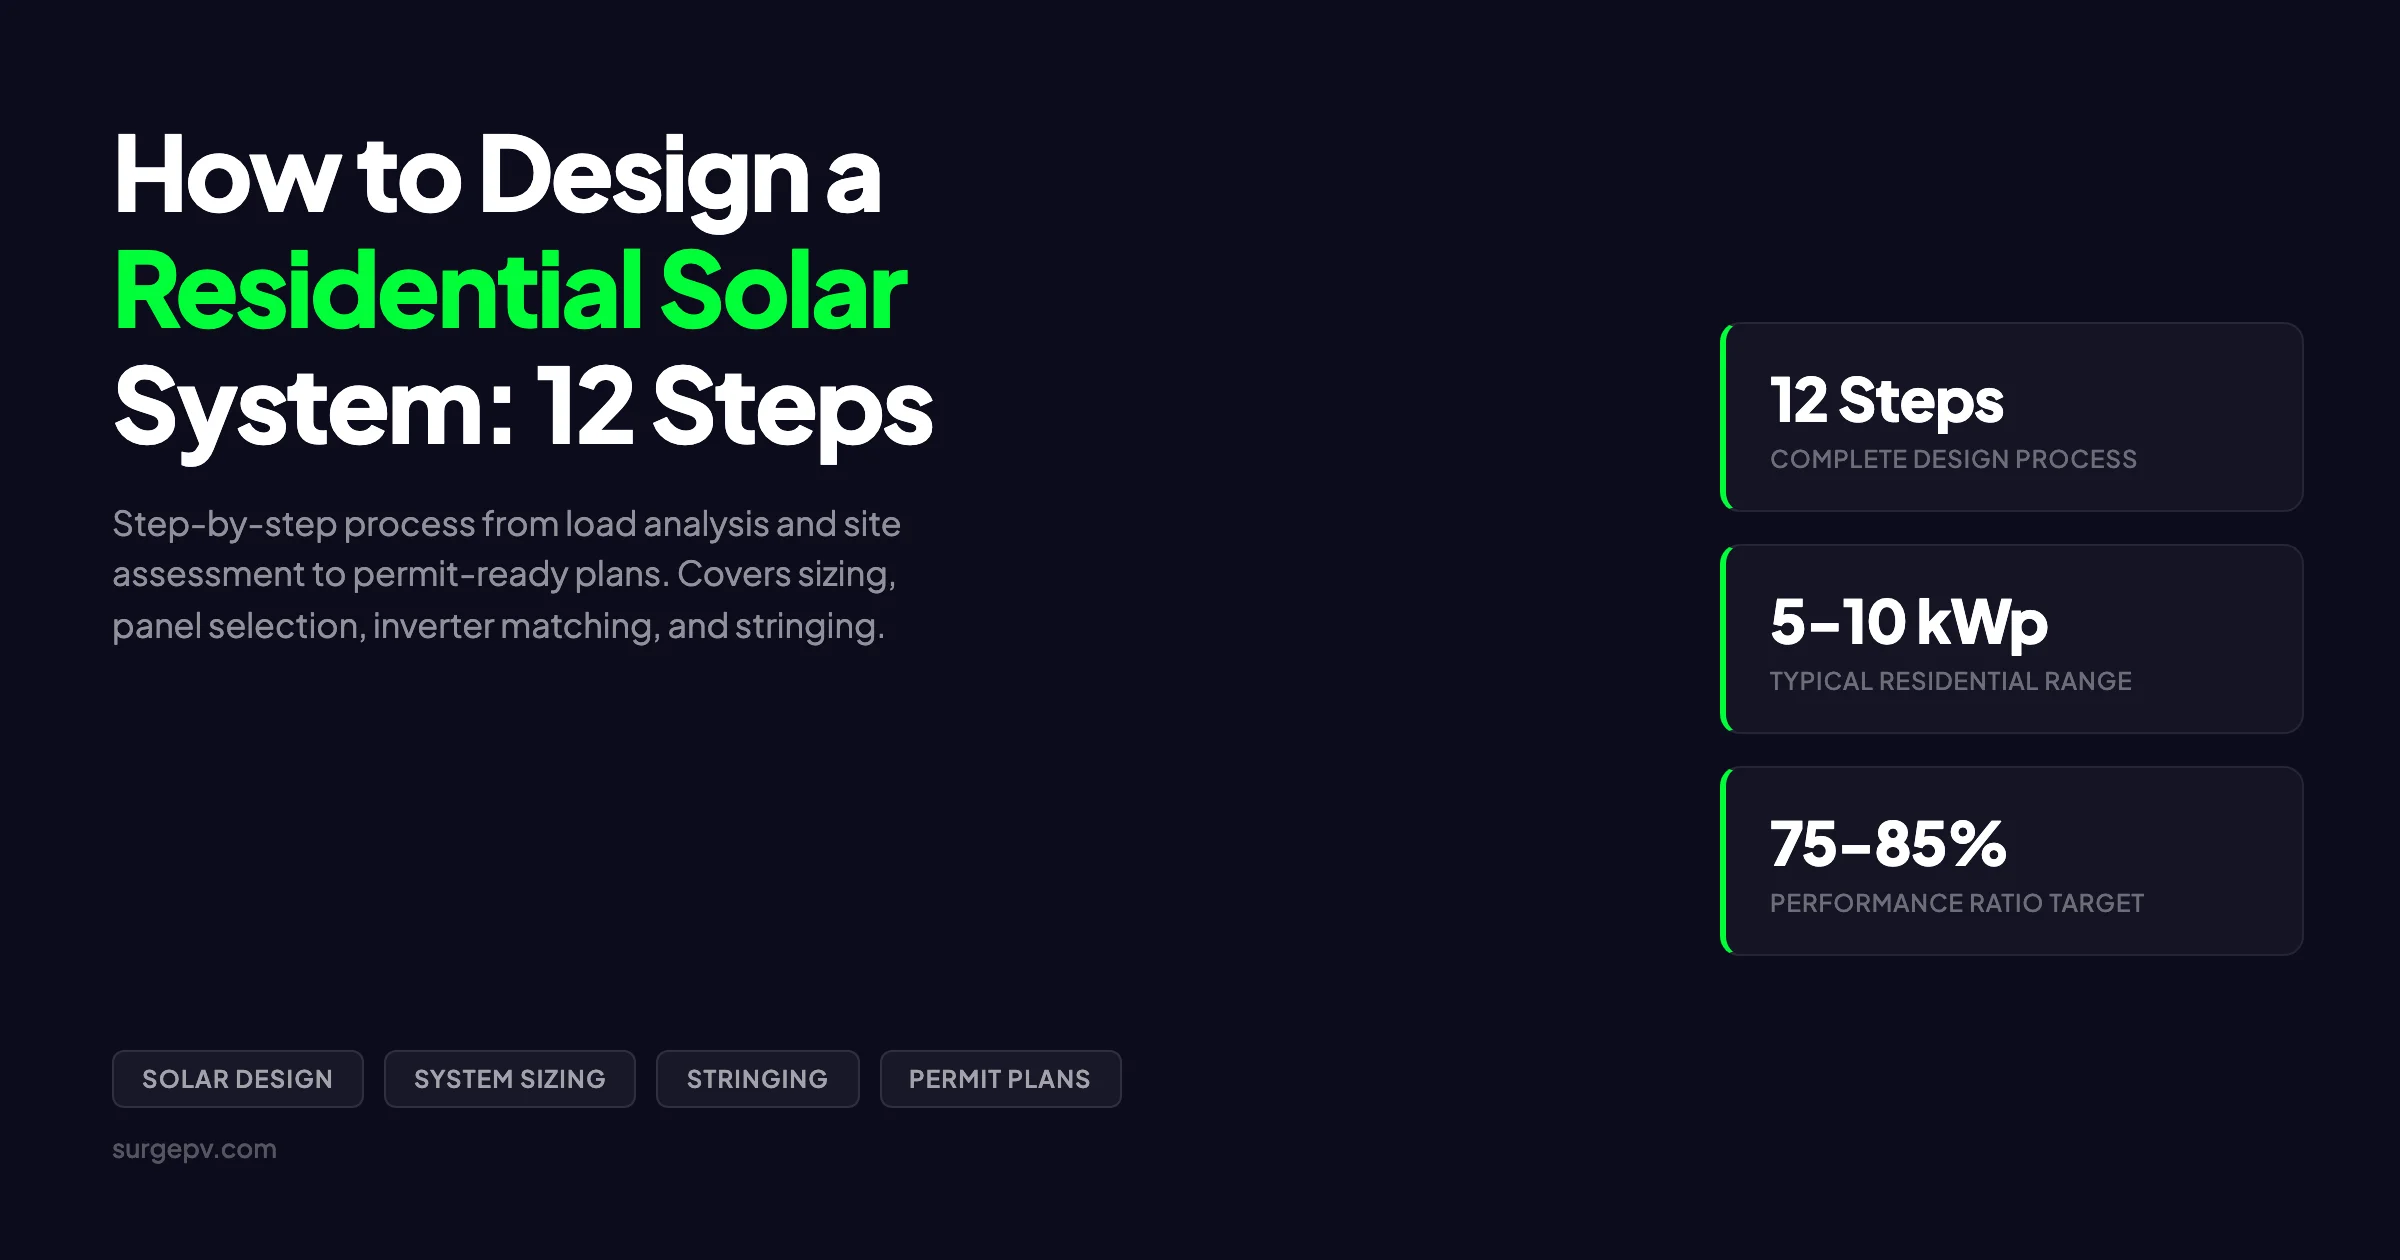
Designing a residential solar system follows a 12-step process that starts with reading the homeowner’s electricity bill and ends with a permit-ready plan set submitted to the local authority. If you are learning how to design a solar system for the first time, the core workflow covers load analysis, site assessment, shading analysis, system sizing, panel selection, layout design, inverter sizing, string configuration, optional battery storage, energy yield simulation, financial analysis, and permit documentation. A typical residential installation falls between 5 and 8 kWp, uses 12 to 20 panels, and takes an experienced designer 1 to 3 hours to complete manually. With solar design software, the same process takes under an hour. For more on this topic, see Adding Battery Storage Services.
Designing a residential solar system involves six steps: analyze historical electricity usage, assess roof condition and shading, size the system (typically 5–10 kW), select panels and inverter, design the layout, and prepare permit documentation. Solar design software automates calculations and generates NEC-compliant plans. Also see: Us Residential Solar Market Trends 2026. For United States-specific compliance details, see United States arizona/phoenix.
Designing a residential solar system involves six steps: analyze historical electricity usage, assess roof condition and shading, size the system (typically 5–10 kW), select panels and inverter, design the layout, and prepare permit documentation. Solar design software automates calculations and generates NEC-compliant plans.
TL;DR
Residential solar design follows 12 sequential steps. The core sizing formula is simple: divide annual kWh consumption by the local yield factor (kWh/kWp/year) to get the required array size in kWp. A typical home needs 5-10 kWp. Each step after sizing — panel selection, layout, inverter matching, stringing, simulation — refines the design toward a buildable, permit-ready system. Tools like SurgePV automate most of these steps, turning a multi-day manual process into a same-day deliverable.
For a direct comparison, see Arka 360 vs SurgePV.
What this guide covers:
- Gathering electricity bills and load data
- Conducting a site assessment
- Performing a shading analysis
- Calculating system size in kWp
- Selecting solar panels
- Designing the panel layout
- Sizing and selecting the inverter
- Configuring string design and wiring
- Adding battery storage (if required)
- Running energy yield simulation
- Preparing financial analysis and proposal
- Generating permit plans and submitting for approval
Each step includes the formulas, tables, and worked examples you need to complete a residential design from scratch.
What You Need Before You Start
Before opening any design tool, gather the following inputs. Missing any of these will stall the project mid-design.
| Input | Source | Why It Matters |
|---|---|---|
| 12 months of utility bills | Homeowner or utility portal | Establishes annual kWh baseline and seasonal peaks |
| Roof access or satellite imagery | Site visit, Google Earth, drone survey | Determines available area, orientation, and obstructions |
| Local building codes and fire setbacks | AHJ (Authority Having Jurisdiction) website | Dictates panel placement constraints and permit requirements |
| Equipment catalogs (panels, inverters) | Manufacturer or distributor datasheets | Provides electrical specs for sizing calculations |
| Local electricity rate schedule | Utility tariff sheet | Required for financial analysis and payback calculation |
| Irradiance data for the location | NREL PVWatts, Meteonorm, or PVGIS | Determines yield factor and expected annual production |
With these in hand, you can work through all 12 steps without stopping.
Step 1: Gather the Electricity Bill and Load Data
Every residential solar design starts with the same question: how much electricity does this home use per year?
Why 12 months of data matters. A single month tells you nothing about seasonal variation. Homes with electric heating spike in winter. Homes with air conditioning spike in summer. You need the full annual picture to size a system that offsets the right amount of consumption.
Pull the following from each monthly bill:
- Total kWh consumed — the primary sizing input
- Peak demand (kW) — relevant if the utility charges demand fees
- Time-of-use (TOU) rate structure — affects financial analysis and self-consumption value
- Net metering credits — determines how excess production is compensated
Add up 12 months of kWh to get the annual total. This is the number that drives your system size calculation in Step 4.
Plan for future loads. Ask the homeowner about any planned additions in the next 2 to 5 years. These change the sizing target significantly.
| Appliance | Typical Annual kWh | Impact on System Size |
|---|---|---|
| Central air conditioning | 2,000-3,500 kWh | +1.5-2.5 kWp |
| Electric vehicle (12,000 mi/year) | 3,500-4,500 kWh | +2.5-3.5 kWp |
| Heat pump (space heating) | 3,000-6,000 kWh | +2.0-4.5 kWp |
| Heat pump water heater | 1,500-2,500 kWh | +1.0-1.8 kWp |
| Pool pump | 2,000-3,000 kWh | +1.5-2.0 kWp |
| Electric cooking (induction) | 500-1,000 kWh | +0.4-0.7 kWp |
If the homeowner plans to add an EV charger next year, size the system for the combined load now. Adding panels later costs more than getting it right the first time.
Pro Tip
When the homeowner cannot find 12 months of bills, most US utilities offer online portals with downloadable usage history. Green Button data exports provide 15-minute interval data, which is even better for sizing accuracy. For a deep dive on financial metrics, see our guide on solar NPV, IRR, and payback calculations.
Step 2: Conduct a Site Assessment
The site assessment answers three questions: where can panels go, how much space is available, and what direction does the roof face?
Roof orientation (azimuth). The compass direction the roof faces determines how much solar energy it receives. In the Northern Hemisphere, due south (180 degrees azimuth) captures the most annual irradiance. But most roofs do not face perfectly south, and that is fine — the production loss from moderate deviations is smaller than many installers expect.
| Roof Orientation | Azimuth (degrees) | Annual Production vs South-Facing |
|---|---|---|
| Due South | 180 | 100% |
| South-Southwest | 195-210 | 97-99% |
| South-Southeast | 150-165 | 97-99% |
| Southwest | 225 | 92-95% |
| Southeast | 135 | 92-95% |
| Due West | 270 | 80-85% |
| Due East | 90 | 80-85% |
| Due North | 0/360 | 50-65% |
Tilt angle. The optimal tilt roughly equals the site latitude. A roof at 30 degrees in a 35-degree latitude zone loses about 1-2% compared to the theoretical optimum. Flat roofs allow adjustable tilt racking. Steep roofs (over 45 degrees) lose meaningful production in summer when the sun is high.
Available area. Measure the usable roof area in square meters. A standard 440 W residential panel occupies about 2.2 m² (2.0 m x 1.1 m). Subtract space for setbacks, vents, skylights, and access pathways. A 50 m² roof with 30% exclusions leaves 35 m² usable, which fits roughly 15-16 panels.
Measurement methods:
- Tape measure and inclinometer — cheap, slow, requires roof access
- Drone survey — fast, produces orthomosaic images, good for complex roofs
- LIDAR — highest accuracy, available in many urban areas via public datasets
- Satellite imagery — fast for initial assessment, less accurate for tilt measurement
Structural check. Verify the roof can support the additional load. Solar panels add 12-15 kg/m² (dead load). Most roofs built to modern code handle this without reinforcement, but older structures or roofs with existing damage need an engineer’s review.
For a complete explanation of solar angles and their effect on production, see our guide to azimuth, tilt, and zenith angles.
Step 3: Perform a Shading Analysis
Shading is the single biggest variable that separates a good design from a bad one. A shadow covering 10% of a panel’s surface can reduce that panel’s output by 30-50% because of how cells are wired in series within the module.
Why shading damage is disproportionate. In a standard 60 or 72-cell panel, cells are connected in series strings. When one cell is shaded, it becomes a resistor instead of a generator. The bypass diodes limit the damage, but they knock out an entire cell string — typically one-third of the panel. One shaded cell can eliminate 33% of a panel’s output, not just the 1.4% of area it covers.
What to map. Walk the roof or fly a drone and document every obstruction:
- Trees — deciduous trees with seasonal leaf cover change shading patterns dramatically between summer and winter
- Chimneys and flues — cast sharp, moving shadows throughout the day
- Dormers and roof protrusions — create fixed shade zones
- Neighboring buildings — tall structures to the south (in the Northern Hemisphere) are the biggest concern
- Utility poles and wires — thin but persistent line shadows
Seasonal variation. The sun sits lower in the sky during winter. An object that casts no shadow in June may shade half the array in December. A proper shading analysis models the sun path across all 12 months, not just a single snapshot.
Analysis methods:
- Sun path diagrams — manual, plots obstruction angles against the sun’s path
- Solar Pathfinder — fisheye lens device used on-site
- LIDAR-based 3D modeling — generates accurate shade maps from point cloud data
- Software-based analysis — solar shadow analysis software like SurgePV generates hour-by-hour shade maps from 3D roof models, automatically calculating annual losses per panel position
If shading losses exceed 15-20% for a given panel position, remove that panel from the layout. It is better to install fewer unshaded panels than to fill every available space with partially shaded ones.
For a detailed breakdown of how shading affects energy output, read how shading affects solar panels.
Step 4: Calculate System Size in kWp
This is the step where the design gets its number. The formula is straightforward:
System Size (kWp) = Annual Consumption (kWh) / Yield Factor (kWh/kWp/year)
The yield factor represents how many kWh each installed kWp produces per year at your specific location. It depends on solar irradiance, temperature, and system losses.
| Region | Typical Yield Factor (kWh/kWp/year) |
|---|---|
| Northern Europe (UK, Scandinavia) | 800-1,000 |
| Central Europe (Germany, France, Poland) | 1,000-1,200 |
| Southern Europe (Spain, Italy, Greece) | 1,200-1,500 |
| US Northeast | 1,100-1,300 |
| US Southeast | 1,300-1,500 |
| US Southwest (Arizona, Nevada) | 1,600-1,900 |
| Australia | 1,400-1,800 |
| India | 1,300-1,700 |
| Middle East | 1,600-2,000 |
Worked example. A home in North Carolina consumes 10,500 kWh per year. The local yield factor is approximately 1,400 kWh/kWp/year.
- Base system size: 10,500 / 1,400 = 7.5 kWp
- Add 10% design margin for degradation and real-world losses: 7.5 x 1.10 = 8.25 kWp
- This is the target DC array capacity
The 10% margin accounts for panel degradation over the first few years (typically 0.4-0.5% per year), soiling losses, and any minor shading that the analysis may underestimate. Some designers use 15% if the roof has partial shading or the homeowner plans to add loads.
Offset targets. Not every homeowner wants 100% offset. Some utilities cap net metering credits, making production beyond 100% less valuable. In those cases, design to 90-95% offset. In markets with generous feed-in tariffs, oversizing to 110-120% can make financial sense.
Pro Tip
Solar design software pulls irradiance data automatically from sources like Meteonorm, PVGIS, and NSRDB. Instead of looking up yield factors manually, the software calculates them from the exact coordinates and applies all site-specific derating. For irradiance fundamentals, see our guide to GHI, DNI, and DHI.
Step 5: Select Solar Panels
Panel selection determines how many modules you need, how they fit on the roof, and how they perform over 25 years.
Key specifications to compare:
| Specification | What It Means | Residential Range |
|---|---|---|
| Wattage (Wp) | Power output at Standard Test Conditions | 400-450 W |
| Efficiency (%) | Power per unit area | 20-23% |
| Temperature coefficient (Pmax) | Power loss per degree C above 25C | -0.29 to -0.40%/C |
| Voc (open circuit voltage) | Maximum voltage at no load | 37-52 V |
| Isc (short circuit current) | Maximum current at no load | 11-14 A |
| Dimensions | Physical panel size | ~2.0 m x 1.1 m |
| Weight | Per panel | 20-25 kg |
| Warranty (product) | Defect coverage | 15-30 years |
| Warranty (performance) | Output guarantee | 25-30 years at 80-87.4% |
Monocrystalline PERC vs N-type TOPCon:
| Feature | Mono PERC | N-type TOPCon |
|---|---|---|
| Efficiency | 20-21.5% | 21.5-23% |
| Temperature coefficient | -0.35 to -0.40%/C | -0.29 to -0.34%/C |
| Degradation (year 1) | 2% | 1% |
| Annual degradation | 0.55% | 0.40% |
| Low-light performance | Good | Better |
| Cost per Wp | Lower | 5-10% higher |
| Best for | Budget-conscious projects | Hot climates, limited roof space |
N-type panels cost more upfront but deliver more energy per square meter over the system lifetime, especially in hot climates where the lower temperature coefficient matters.
How many panels? Divide the kWp target by the individual panel wattage.
- Target: 8.25 kWp
- Panel: 440 W (0.44 kWp)
- Count: 8.25 / 0.44 = 18.75 → round to 19 panels
- Actual array: 19 x 0.44 = 8.36 kWp
If 19 panels do not fit the roof, try a higher-wattage panel (450 W or 460 W) or adjust the target. Physical fit drives the final panel count more often than electrical calculations do.
For more on panel technology, read half-cut vs full-cell solar panels and how solar panels work.
Step 6: Design the Panel Layout
Layout design translates the sizing calculation into a physical arrangement on the roof. This step is where code compliance, structural limits, and aesthetic preferences intersect.
Fire code setbacks. The International Fire Code (IFC) and local AHJ requirements dictate minimum clearances. Common requirements:
- Ridge setback: 36 inches (914 mm) from the roof ridge
- Eave setback: 18 inches (457 mm) from the eave edge
- Hip and valley setback: 18 inches from hips and valleys
- Access pathway: 36-inch clear path from eave to ridge on at least one side
- Fire department access: 3-foot perimeter pathway around the array on steep roofs
These setbacks reduce the usable roof area significantly. A roof that looks like it fits 25 panels may only accommodate 18 after setbacks.
Landscape vs portrait orientation. Panels can be mounted in landscape (long side horizontal) or portrait (long side vertical). Portrait is more common on residential pitched roofs because it uses racking rails more efficiently and often fits more panels between setback boundaries. Landscape may work better on flat or low-slope roofs.
Row spacing for multi-plane roofs. If panels are mounted on a flat section with tilt racks, space rows to prevent inter-row shading. The standard rule: the gap between rows should equal at least 2x the panel height multiplied by the tangent of the tilt angle at the winter solstice sun altitude. In practice, this means 1.5 to 2.5 meters between rows at mid-latitudes.
How software handles layout. Solar design software automates panel placement by importing a 3D roof model, applying all setback rules, checking structural load limits, and placing the maximum number of panels in the highest-irradiance positions. Manual layout on a CAD drawing takes 30 to 60 minutes per roof. Software does it in seconds.
For a step-by-step walkthrough of layout techniques, see the solar panel layout design guide. For more on the design tools available, visit our solar designing page.
Design Residential Solar Systems in Minutes
SurgePV automates panel layout, shading analysis, string configuration, and proposal generation. Go from satellite image to permit-ready design in a single session.
Book a DemoNo commitment required · 20 minutes · Live project walkthrough
Step 7: Size and Select the Inverter
The inverter converts DC power from the panels into AC power for the home and grid. Sizing it correctly determines how much energy the system actually delivers.
DC/AC ratio. The ratio of DC array capacity to AC inverter capacity is the single most important inverter sizing metric. Industry practice keeps this between 0.8 and 1.2. Read Inverter Selection Solar Design Guide for a complete walkthrough.
- 1.0 ratio (e.g., 8 kWp array, 8 kW inverter): conservative, no clipping, slightly underused inverter capacity on cloudy days
- 1.1-1.2 ratio (e.g., 8 kWp array, 7 kW inverter): standard residential practice, allows slight clipping during peak hours in exchange for better morning/evening harvest
- 0.8-0.9 ratio (e.g., 8 kWp array, 9-10 kW inverter): oversized inverter, used when future panel additions are planned
Inverter types compared:
| Feature | String Inverter | Microinverter | Hybrid Inverter |
|---|---|---|---|
| Installed at | Wall-mounted, ground level | Behind each panel | Wall-mounted |
| DC/AC conversion | Central (one unit) | Panel-level | Central + battery interface |
| Shading tolerance | Low — weakest panel limits string | High — each panel independent | Low to medium |
| Monitoring | String-level | Panel-level | String + battery level |
| Typical cost | Lowest | 15-30% premium | 20-40% premium |
| Best for | Unshaded, uniform roofs | Complex roofs, multiple orientations | Battery-ready systems |
| Typical warranty | 10-15 years | 25 years | 10-15 years |
Key electrical checks. Before finalizing the inverter, verify these parameters from the datasheet:
- Max DC input voltage — the string open-circuit voltage (Voc) at the coldest expected temperature must not exceed this
- MPPT voltage range — the string operating voltage (Vmpp) must stay within this window at all temperatures
- Max DC input current per MPPT — total string current connected to each MPPT must not exceed this
- Number of MPPT inputs — determines how many independent string groups the inverter can optimize
Worked example. For our 8.36 kWp array (19 panels at 440 W):
- A 7 kW string inverter gives a DC/AC ratio of 8.36 / 7.0 = 1.19 — within range
- An 8 kW string inverter gives 8.36 / 8.0 = 1.05 — also within range
- Either works. The 7 kW unit is cheaper and wastes about 1-2% of annual production to clipping
Temperature derating. In hot climates where ambient temperatures regularly exceed 40C, inverters derate their output. A 7 kW inverter might deliver only 6.3 kW at 50C ambient. Check the derating curve in the datasheet and consider slight oversizing (lower DC/AC ratio) in these conditions.
When to use microinverters. If the roof has 3 or more orientations, significant partial shading, or panels split across separate roof planes, microinverters eliminate the string mismatch problem entirely. Each panel operates at its own maximum power point. The cost premium is often justified by the 5-15% production gain on complex roofs.
For detailed inverter sizing calculations, read the solar inverter sizing guide.
Step 8: Configure String Design and Wiring
String design is where electrical engineering meets practical installation. Getting it wrong causes inverter faults, power loss, or safety hazards.
Series vs parallel. Panels connected in series form a string. Voltage adds up across the string while current stays the same. Strings connected in parallel share an MPPT input. Current adds up across parallel strings while voltage stays the same.
- Series string: 10 panels at 37.5 V Vmpp each = 375 V string voltage
- Parallel strings: 2 strings of 10 panels each at 11.5 A Isc = 23 A total current to the MPPT
The MPPT voltage window. This is the non-negotiable constraint. Every string must produce a voltage between the inverter’s Vmin (minimum MPPT voltage) and Vmax (maximum MPPT voltage) across all operating temperatures.
Temperature changes voltage. Cold panels produce higher voltage. Hot panels produce lower voltage. You must calculate both extremes:
- Cold extreme (Voc at minimum temperature): Voc,string = Voc,STC x N x [1 + TempCoeff(Voc) x (Tmin - 25)]
- Hot extreme (Vmpp at maximum temperature): Vmpp,string = Vmpp,STC x N x [1 + TempCoeff(Vmpp) x (Tmax - 25)]
Where N is the number of panels in the string, Tmin is the lowest expected cell temperature (often -10C to -20C depending on climate), and Tmax is the highest expected cell temperature (often 65C to 75C).
Worked example. Using a 440 W panel with Voc = 41.5 V, Vmpp = 34.8 V, temperature coefficient of Voc = -0.28%/C:
- Inverter MPPT range: 150-600 V, Max Voc: 650 V
- At -10C: Voc per panel = 41.5 x [1 + (-0.0028 x (-35))] = 41.5 x 1.098 = 45.57 V
- Max panels per string (voltage limit): 650 / 45.57 = 14.26 → 14 panels max
- At 70C: Vmpp per panel = 34.8 x [1 + (-0.0028 x (45))] = 34.8 x 0.874 = 30.42 V
- Min panels per string (MPPT min): 150 / 30.42 = 4.93 → 5 panels minimum
So each string can have between 5 and 14 panels. For 19 panels, valid configurations include:
| Configuration | Strings | Panels per String | Voc at -10C | Vmpp at 70C |
|---|---|---|---|---|
| 2 strings (10 + 9) | 2 | 10, 9 | 456 V, 410 V | 304 V, 274 V |
| 3 strings (7 + 6 + 6) | 3 | 7, 6, 6 | 319 V, 274 V | 213 V, 183 V |
The 2-string configuration is simpler and keeps voltages well within the MPPT window. This is the better choice if the inverter has 2 MPPT inputs.
Common mistakes:
- Mixing panels of different orientations on the same string — the shaded or east-facing panels drag down the entire string
- Exceeding max Voc in cold weather — can damage the inverter permanently
- Unequal string lengths on the same MPPT — causes mismatch losses of 2-5%
For a complete stringing walkthrough with more examples, see the solar panel stringing and wiring guide. You can also read about auto-stringing and how solar software handles this calculation automatically.
Step 9: Add Battery Storage if Required
Not every residential system needs a battery. But when the homeowner wants backup power, higher self-consumption, or time-of-use savings, storage changes the design.
When batteries make financial sense:
- Backup power — the homeowner wants lights and refrigeration during grid outages
- Self-consumption — the feed-in tariff is much lower than the retail electricity rate, so storing and using solar energy is worth more than exporting it
- TOU arbitrage — electricity costs 3x more during evening peak hours than during midday; the battery charges at midday rates and discharges at peak rates
- Off-grid — no grid connection exists; the battery is mandatory
Sizing formula:
Battery Capacity (kWh) = Critical Load (kW) x Backup Hours / Depth of Discharge (DoD)
Example: 2 kW critical load (lights, fridge, router) x 8 hours backup / 0.9 DoD = 17.8 kWh. A 20 kWh battery covers this with margin.
Common residential battery sizes:
| Battery | Usable Capacity | Continuous Output | Chemistry |
|---|---|---|---|
| 5 kWh unit | 4.5 kWh | 2.5 kW | LFP |
| 10 kWh unit | 9.0 kWh | 5.0 kW | LFP |
| 13.5 kWh unit | 12.2 kWh | 5.0 kW | NMC/LFP |
| 15 kWh unit | 13.5 kWh | 5.0 kW | LFP |
AC-coupled vs DC-coupled. AC-coupled batteries connect on the AC side of the inverter. They work with any existing solar inverter and are simpler to retrofit. DC-coupled batteries connect on the DC side, sharing the solar inverter (which must be a hybrid type). DC-coupled systems are more efficient (one fewer conversion step) and better for new installations.
Compatibility. The battery must match the inverter’s voltage range and maximum charge/discharge rate. A 48 V battery bank does not work with a high-voltage hybrid inverter expecting 300-500 V DC input. Always verify the manufacturer’s compatibility list.
For more on system architectures, read on-grid vs off-grid vs hybrid solar systems. For UK-specific battery guidance, see battery solar system design for the UK. For United Kingdom-specific compliance details, see United Kingdom comparisons/mcs-vs-non-mcs.
Step 10: Run Energy Yield Simulation
Simulation converts the physical design into a production forecast. It answers the question: how many kWh will this system actually produce in year 1, and over 25 years?
What the simulation models:
- Irradiance data — Typical Meteorological Year (TMY) datasets for the exact coordinates, including GHI, DNI, and DHI components
- Shading losses — hour-by-hour shade factors from the 3D model built in Step 3
- Temperature losses — panel derating based on ambient temperature and mounting configuration (roof-mounted panels run hotter than ground-mounted)
- Soiling losses — dust, pollen, bird droppings. Typical residential: 2-5% annually
- Wiring losses — DC cable resistance losses, typically 1-2%
- Inverter efficiency — conversion losses, typically 96-98% weighted efficiency
- Degradation — 0.4-0.55% per year for the first 25 years
Performance ratio. The ratio of actual AC output to theoretical DC output under STC conditions. A well-designed residential system achieves a performance ratio of 75-85%. Values below 75% indicate excessive shading, poor orientation, or equipment issues.
Simplified yield formula:
Annual Yield (kWh) = Installed kWp x Peak Sun Hours (kWh/m²/day) x 365 x Performance Ratio
For our 8.36 kWp system in North Carolina (PSH = 4.5, PR = 0.80):
- Annual yield = 8.36 x 4.5 x 365 x 0.80 = 10,990 kWh
- This covers the homeowner’s 10,500 kWh consumption with a small surplus
Why simulation matters. Customers make a $15,000-$30,000 investment based on your production estimate. If the real output falls 20% short, you lose credibility and may face warranty claims. A proper simulation using validated meteorological data and site-specific shading gives production estimates within 5% of measured output. The NREL PVWatts calculator is a free starting point, but professional solar design software uses more granular data and models panel-level shading.
Simulation also satisfies bankability requirements if the project involves third-party financing. Lenders expect energy yield reports compliant with standards like IEC 61724.
For a deeper dive into what affects the performance ratio, read the solar performance ratio guide. To see how SurgePV handles simulation and financial modeling, visit the generation and financial tool page.
Step 11: Prepare Financial Analysis and Proposal
The financial analysis turns kWh production into dollar savings and determines whether the project makes economic sense for the homeowner.
Key financial metrics:
| Metric | What It Tells You | Target Range (Residential) |
|---|---|---|
| Simple payback period | Years to recoup the investment from energy savings | 5-10 years |
| Net Present Value (NPV) | Total lifetime value of the investment in today’s dollars | Positive = good investment |
| Internal Rate of Return (IRR) | Annualized return on the solar investment | 8-15% |
| Levelized Cost of Energy (LCOE) | Cost per kWh over system lifetime | Lower than grid rate |
Inputs for the financial model:
- System cost (equipment + installation): $2.00-$3.50/W in the US, EUR 1.00-1.80/W in Europe
- Annual energy production from simulation (Step 10)
- Electricity rate and annual escalation (typically 2-4% per year)
- Self-consumption ratio (how much solar energy the home uses directly vs exports)
- Feed-in tariff or net metering credit rate
- Available incentives (state rebates, tax credits, grants)
- Panel degradation rate (0.4-0.55% per year)
- O&M cost ($10-$20/kW/year)
- Discount rate for NPV calculation (typically 4-6%)
Worked example. Our 8.36 kWp system in North Carolina:
- System cost: 8.36 kW x $2.80/W = $23,408
- Year 1 production: 10,990 kWh
- Electricity rate: $0.12/kWh, escalating 3% per year
- Self-consumption: 70% at retail rate, 30% at net metering credit ($0.04/kWh)
- Year 1 savings: (10,990 x 0.70 x $0.12) + (10,990 x 0.30 x $0.04) = $923 + $132 = $1,055
- Simple payback: $23,408 / $1,055 = ~22 years (before incentives)
- With applicable state/local incentives, the payback drops substantially
The proposal document packages this analysis into a format the homeowner can understand. A strong proposal includes:
- Monthly bill comparison (before vs after solar)
- Cumulative savings graph over 25 years
- Environmental impact (CO2 avoided, equivalent trees planted)
- Equipment specifications and warranty summary
- Installation timeline and process overview
- Financing options (cash, loan, lease, PPA)
Solar proposal software generates these documents automatically from the design data, complete with the homeowner’s name, address, and customized financials. A polished, data-backed proposal closes more deals than a spreadsheet printout. See our guide on Solar Software Poland for more.
For a full breakdown of financial calculations, read the solar NPV, IRR, and payback guide. For more on financing structures, see the solar financing options guide.
Step 12: Generate Permit Plans and Submit for Approval
The design is not done until the AHJ (Authority Having Jurisdiction) and the utility approve it. This step produces the documentation they require.
A standard residential permit plan set includes:
- Site plan — aerial view showing the property, roof outline, panel locations, and setbacks to scale
- Roof plan — detailed view of panel layout with dimensions, setback measurements, and access pathways marked
- Electrical single-line diagram — shows the DC array, string configuration, inverter, AC disconnect, meter, and point of interconnection
- Equipment specification sheets — datasheets for panels, inverter, racking, and battery (if applicable)
- Structural attachment detail — shows how the racking mounts to the roof structure (lag bolt pattern, flashing, waterproofing)
- Fire setback diagram — documents compliance with IFC or local fire code setback requirements
- Electrical load calculation — verifies the main service panel can support the solar backfeed (NEC 705.12 bus bar rating check)
Code compliance. All residential solar installations in the US must comply with NEC 690 (Solar Photovoltaic Systems). If battery storage is included, NEC 710 (Standalone Systems) or NEC 706 (Energy Storage Systems) also applies. Key NEC 690 requirements include rapid shutdown (within 30 seconds of initiating shutdown, conductors within the array boundary must drop below 80 V within 30 seconds), equipment grounding, and overcurrent protection.
Utility interconnection. Separate from the building permit, you must apply to the utility for interconnection approval. This application typically requires the system single-line diagram, inverter specification sheet, and proof of insurance. Processing times range from 1 week to 3 months depending on the utility.
How software helps. Generating a permit plan set manually in CAD takes 2 to 4 hours per project. Professional solar design tools auto-generate the site plan, roof plan, single-line diagram, and fire setback documentation directly from the design model. This cuts documentation time to 15 to 30 minutes.
For related compliance requirements, see the solar safety compliance checklist and NTP, PTO, and COD solar project milestones. The US Department of Energy’s guide to planning a home solar system provides a homeowner-facing overview of the permitting process.
Common Residential Solar Design Mistakes
These mistakes show up in permit rejections, underperforming systems, and unhappy customers.
| Mistake | Impact | How to Avoid |
|---|---|---|
| Ignoring shading from nearby trees | 10-30% production loss, angry customer | Run a full shading analysis (Step 3) for all 12 months |
| Incorrect string configuration | Inverter faults, shutdowns, voided warranty | Calculate Voc at minimum temperature and Vmpp at maximum temperature for every string |
| Undersized inverter (DC/AC ratio over 1.3) | Excessive clipping, 5-10% energy loss | Keep DC/AC ratio between 0.8 and 1.2 |
| Not accounting for future loads | System undersized within 2-3 years | Ask about EV, heat pump, and pool plans before sizing |
| Skipping the structural check | Roof damage, liability issues, permit rejection | Verify dead load capacity before finalizing layout |
| Wrong fire setbacks | Permit rejection, redesign required | Check local AHJ requirements, not just IFC defaults |
| Using stale irradiance data | Inaccurate production forecast | Use TMY data from validated sources (Meteonorm, NSRDB, PVGIS) |
| Overselling production | Customer distrust, potential legal claims | Use conservative simulation assumptions and disclose uncertainty range |
Conclusion
Residential solar design follows a clear 12-step sequence. Here is what to do next:
- Start with the electricity bill. Every design decision flows from the annual kWh number. Get 12 months of data before touching any design tool.
- Run proper shading analysis. It is the difference between a system that produces as promised and one that underperforms by 20%. Do not skip it.
- Use software for speed and accuracy. Manual calculations work for learning, but professional projects need automated stringing, simulation, and permit documentation. SurgePV handles all 12 steps in a single platform.
Frequently Asked Questions
How many solar panels do I need for a residential system?
The number of panels depends on your annual energy consumption and the panel wattage. Divide your annual kWh by the location-specific yield factor (typically 1,200-1,800 kWh/kWp/year) to get the required kWp. Then divide by the individual panel wattage. A typical US home using 10,500 kWh/year in a 1,400 kWh/kWp zone needs about 7.5 kWp, which is 17 panels at 440 W each.
What is the best roof orientation for solar panels?
In the Northern Hemisphere, due south (180 degrees azimuth) is optimal. Southeast and southwest orientations (135-225 degrees) still capture 85-95% of maximum annual output. East or west facing roofs lose 10-20% production but can be viable with higher-efficiency panels. In the Southern Hemisphere, due north is optimal.
How do I size a solar inverter for a residential system?
The inverter should be sized between 0.8x and 1.2x the total DC array capacity. A common ratio is 1:1. For a 7.5 kWp array, a 7-8 kW inverter works. In hot climates, slight undersizing (0.9x) accounts for derating. In cooler climates with low irradiance, oversizing to 1.1x captures more energy from diffuse light.
What is solar panel stringing and why does it matter?
Stringing is how you electrically connect panels in series and parallel to match the inverter’s voltage and current windows. Incorrect stringing causes power loss, inverter shutdowns, or safety hazards. Each string must stay within the inverter’s MPPT voltage range (Vmin to Vmax) across all temperature extremes, from the coldest morning to the hottest afternoon.
Can I design a solar system myself or do I need software?
You can design a small residential system manually using the formulas in this guide. But for accuracy, speed, and permit-ready documentation, solar design software is standard practice. Tools like SurgePV automate shading analysis, stringing calculations, energy yield simulation, and financial projections, reducing a multi-day manual process to under an hour.
What size solar system do I need for a 2,000 sq ft house?
House size alone does not determine system size. Energy consumption does. A 2,000 sq ft home in the US typically uses 8,000-12,000 kWh/year. At 1,400 kWh/kWp yield, that requires 5.7-8.6 kWp, or roughly 13-20 panels at 440 W each. Homes with electric vehicles, heat pumps, or pools may need 30-50% more capacity.


