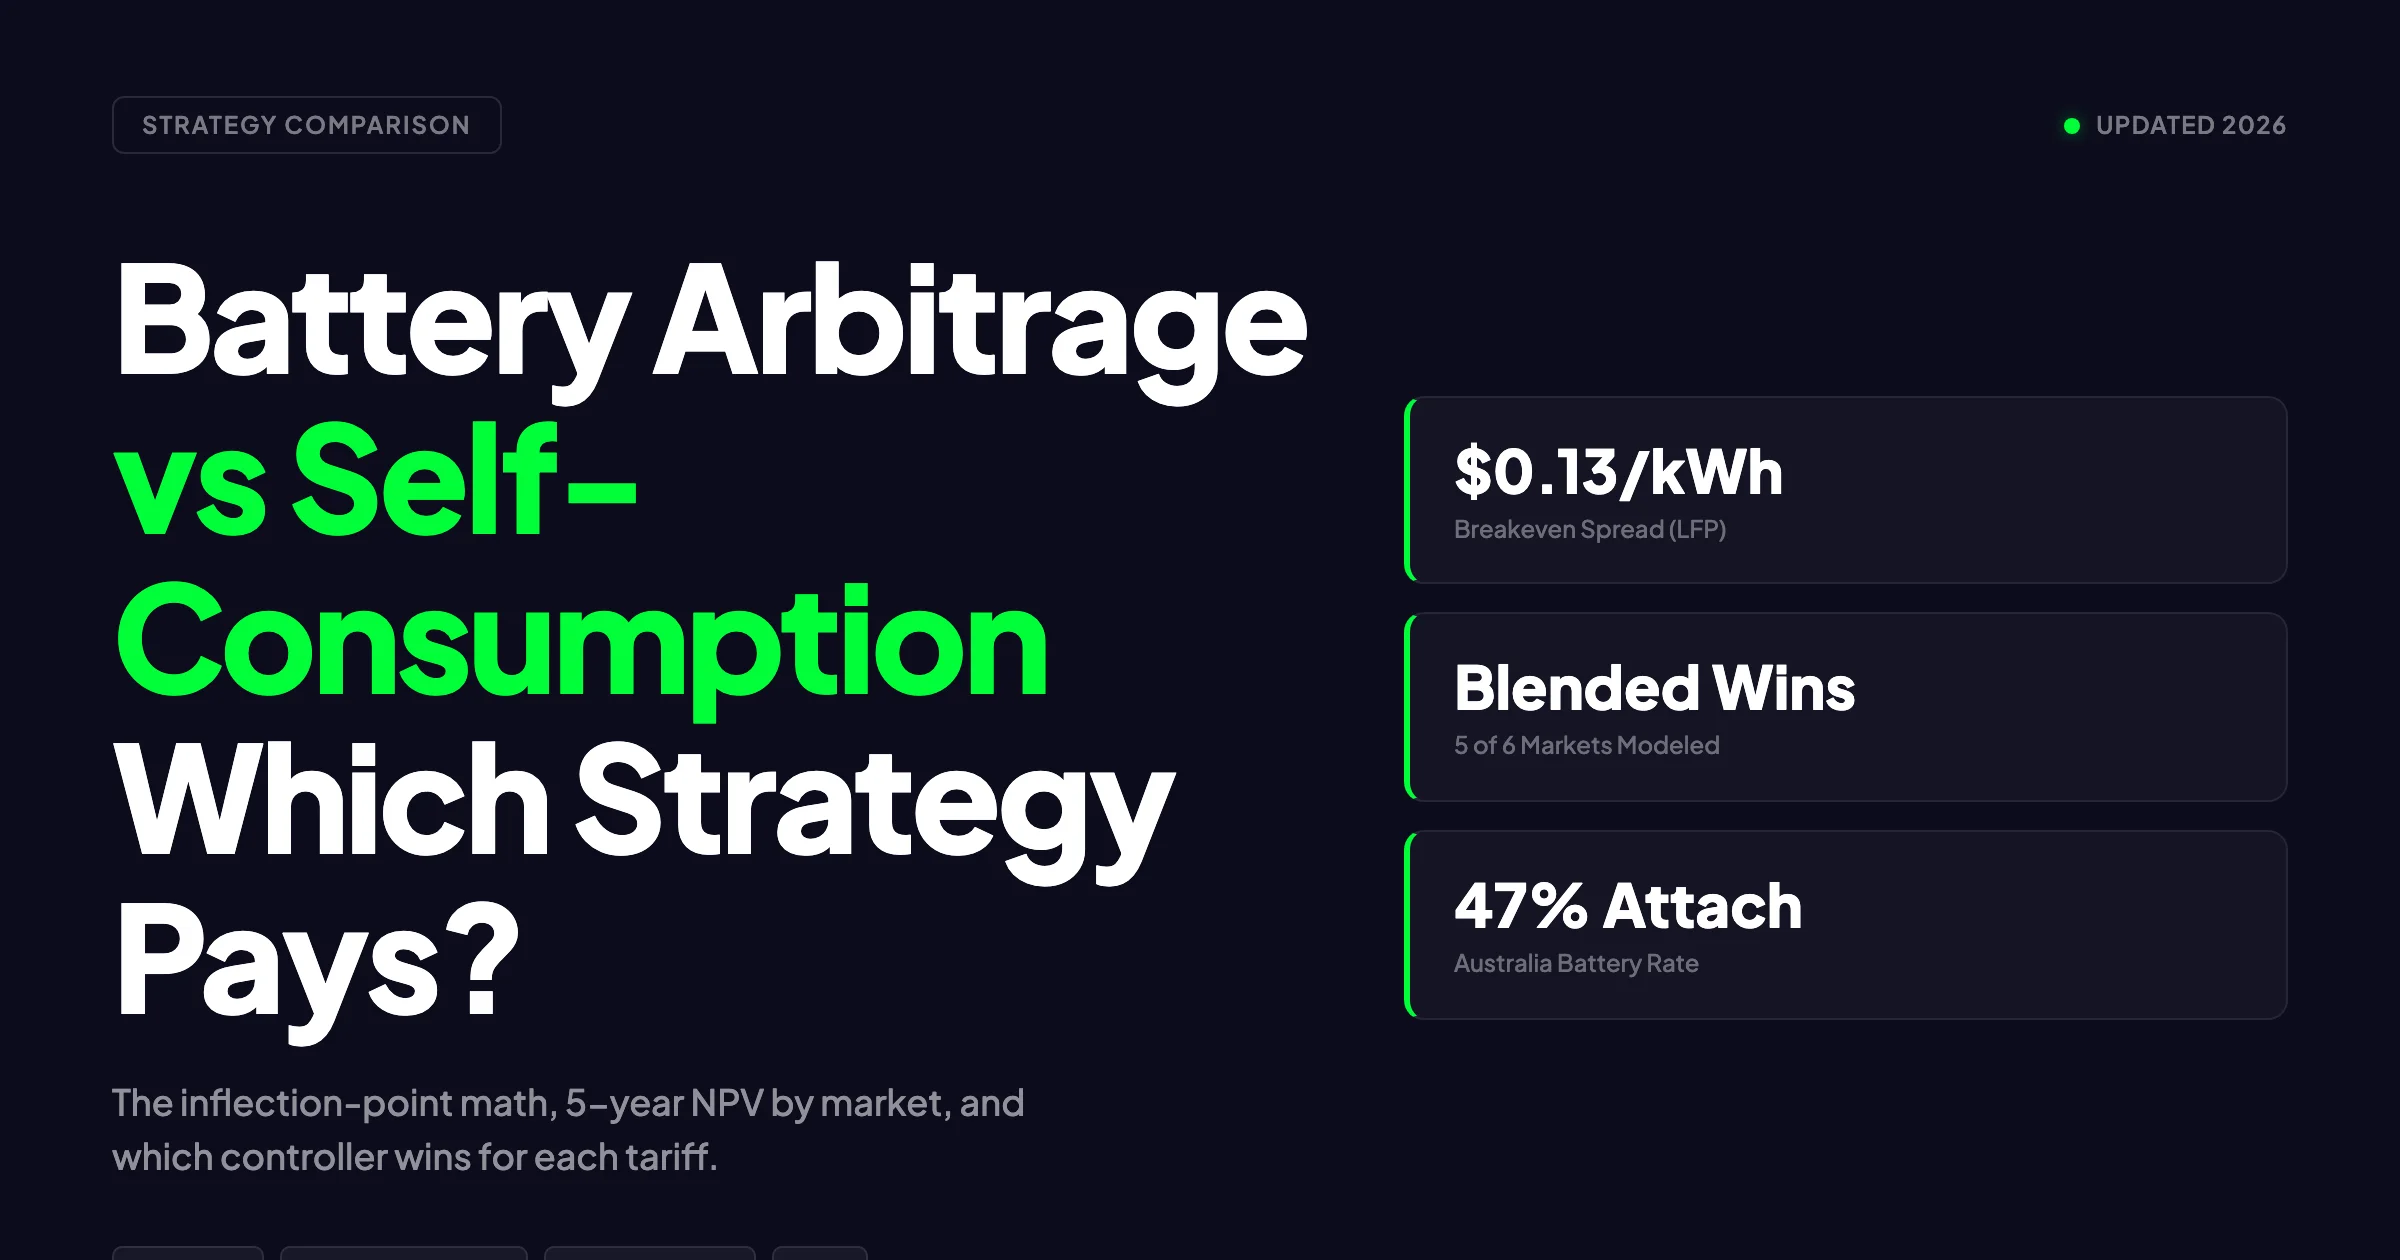
Quick Answer
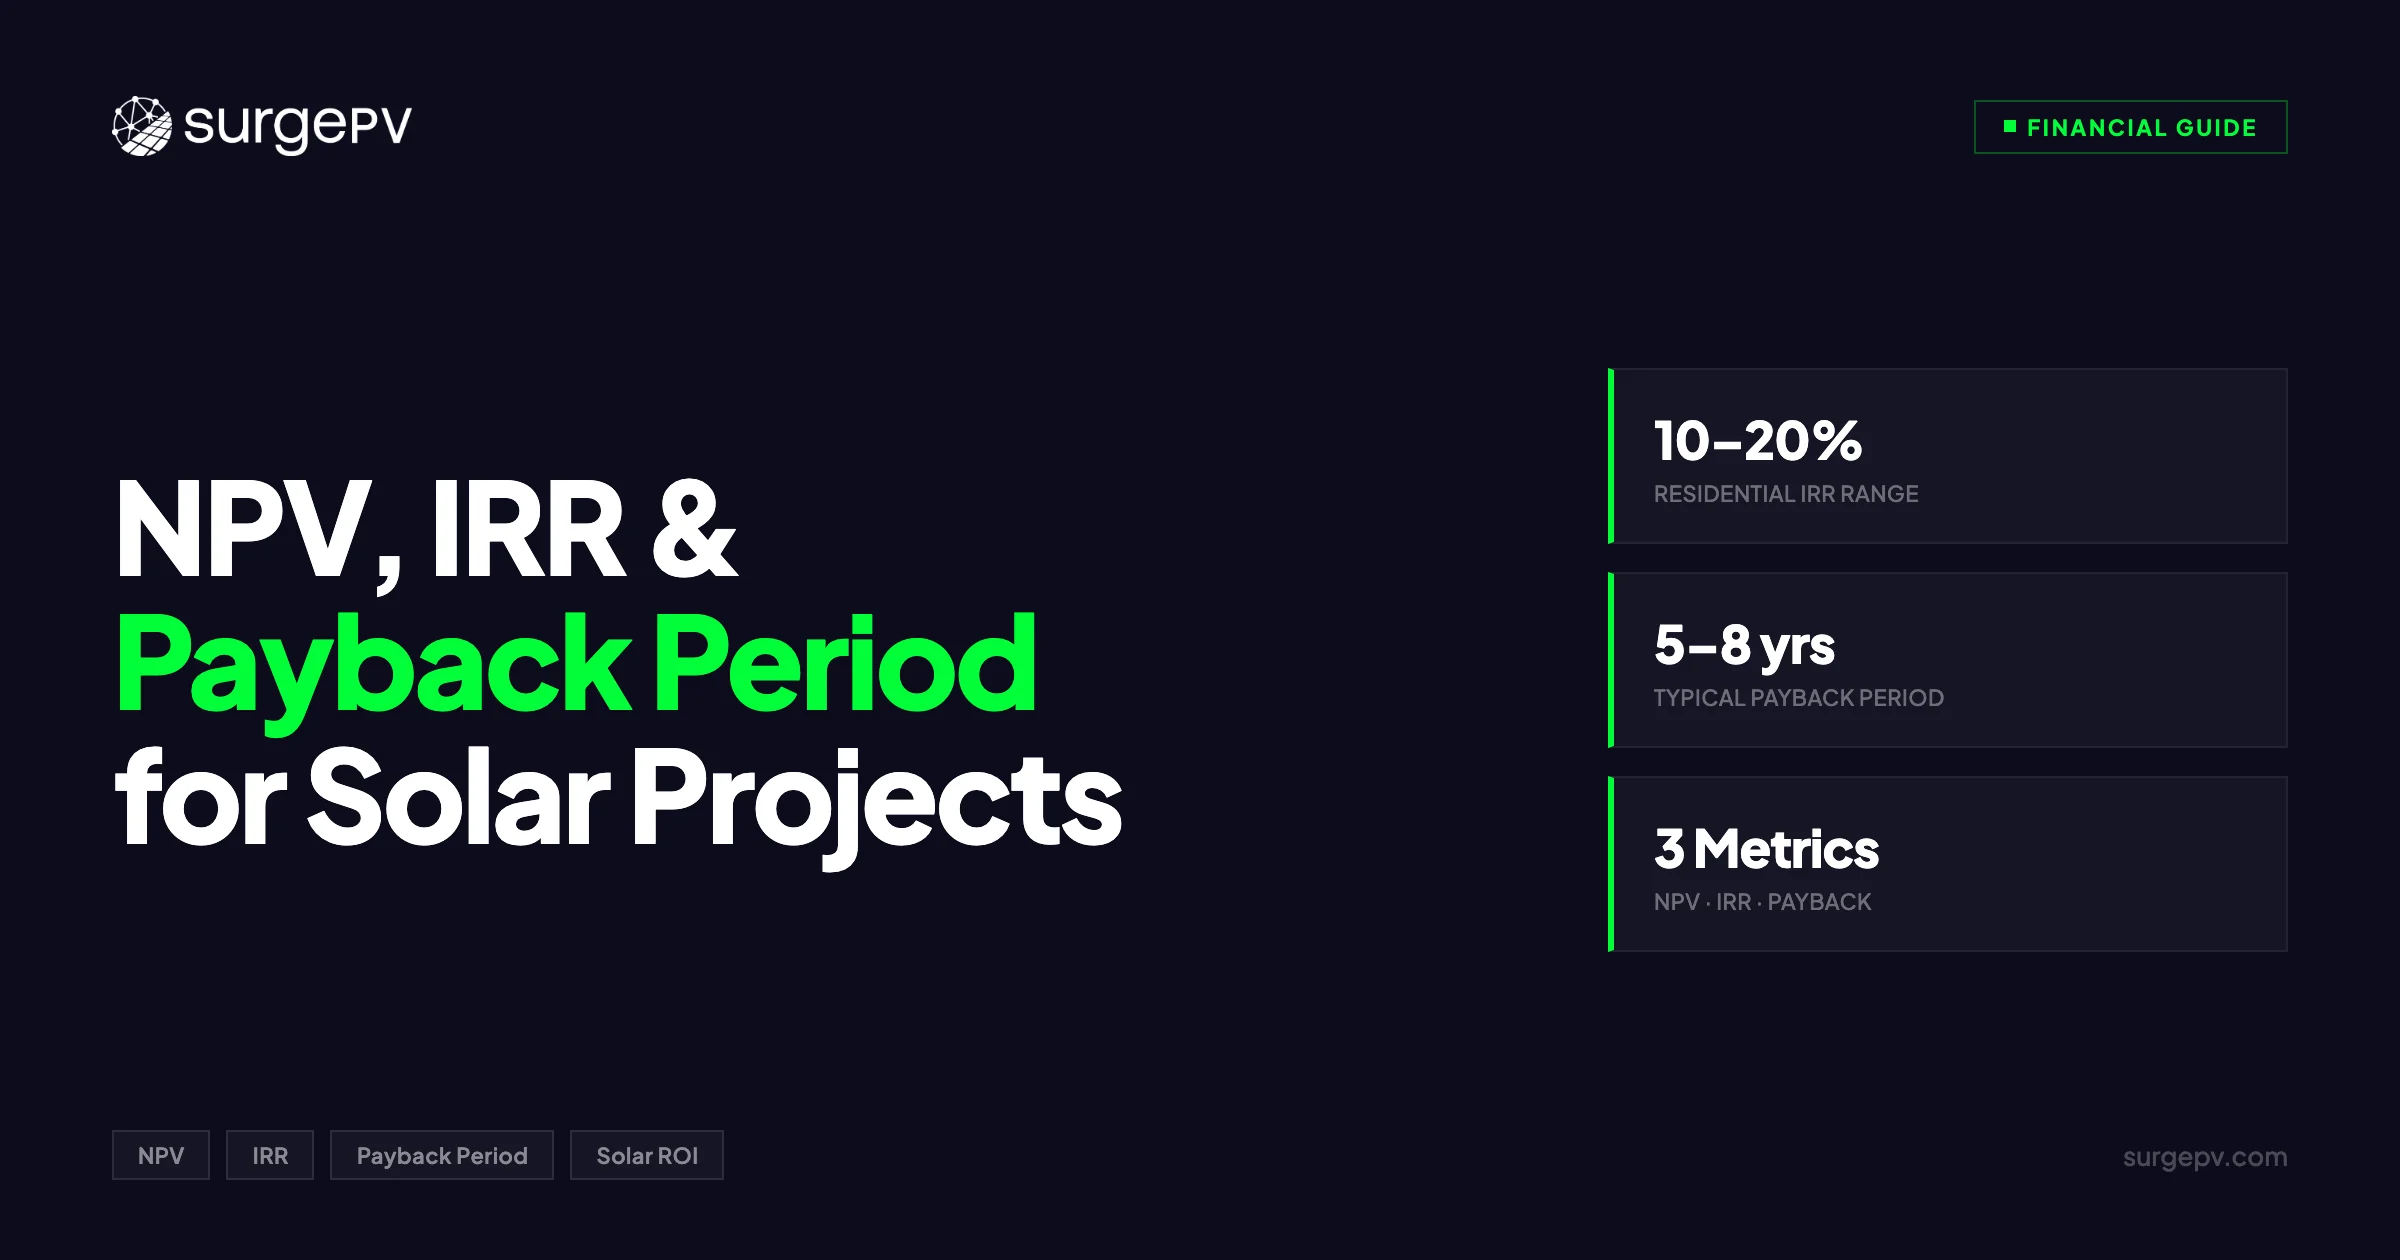
Solar project financial metrics: NPV measures total lifetime value in today's dollars, IRR is the annualized rate of return, and payback is years to break even. A typical 6 kWp residential system has a 5–8 year payback, 15–25% IRR, and €15,000–€30,000 NPV over 25 years.
Solar customers do not buy panels. They buy financial outcomes. A homeowner wants to know when the system pays for itself.
Solar project financial metrics: NPV measures total lifetime value in today’s dollars, IRR is the annualized rate of return, and payback is years to break even. A typical 6 kWp residential system has a 5–8 year payback, 15–25% IRR, and €15,000–€30,000 NPV over 25 years.
A commercial CFO needs to prove the investment beats alternative uses of capital. An investor wants to compare solar against a bond portfolio or a real estate fund.
The difference between closing a sale and losing it often comes down to which financial metric you present, how clearly you present it, and whether the numbers hold up to scrutiny. This guide covers the three metrics that matter most in solar finance: simple payback period, Net Present Value (NPV), and Internal Rate of Return (IRR). Each section includes the formula, a worked example, and guidance on when to use it.
TL;DR — Solar Financial Metrics
Simple payback: 5–8 years residential, 4–7 years commercial in most European markets. NPV over 25 years: €8,000–€20,000 for a typical 6 kWp residential system. IRR: 10–20% residential, 8–15% commercial. The metric you choose depends on the audience. Homeowners respond to payback. CFOs need NPV. Investors want IRR and DSCR.
For Europe-specific compliance details, see Europe solar compliance.
What this guide covers:
- Why financial metrics win solar sales more than technical specs
- Simple payback period: formula, worked examples, and limitations
- Net Present Value: year-by-year cash flow modeling with discount rates
- Internal Rate of Return: interpretation, benchmarks, and common ranges
- Sensitivity analysis: how production variance changes financial outcomes
- Presenting the right metric to the right audience
Chapter 1: Why Financial Metrics Matter for Solar Sales
Most solar proposals lead with technical specifications. Panel wattage, inverter efficiency, estimated annual production in kWh. These numbers matter for system design. They do not close sales.
Customers make purchasing decisions based on money. Specifically, they want answers to three questions:
- How long until it pays for itself? (Payback period)
- How much total value does it create over its lifetime? (NPV)
- What annual return does it generate on my investment? (IRR)
Different audiences prioritize different metrics. Here is the breakdown:
| Audience | Primary Metric | Secondary Metrics | Why |
|---|---|---|---|
| Homeowners | Payback period | Monthly savings, total savings | Simple, intuitive, answers “when do I break even?” |
| Commercial property owners | NPV | IRR, payback | Need to justify capital allocation to boards |
| CFOs and finance teams | IRR | NPV, DSCR | Compare against cost of capital and other investments |
| Banks and lenders | DSCR | IRR, NPV | Must verify loan repayment capacity |
| Institutional investors | IRR | LCOE, NPV, cash-on-cash | Portfolio-level return benchmarking |
Pro Tip
Lead with the metric your customer cares about. A homeowner who hears “your IRR is 14.2%” will glaze over. The same homeowner who hears “the system pays for itself in 6.5 years, then saves you €1,800 every year for the next 18 years” will sign the contract. Match the language to the audience.
The quality of your financial analysis depends entirely on the accuracy of your production estimates. A 10% overestimate on annual generation translates directly into overstated savings, shorter projected payback, and inflated IRR.
When the customer’s real-world numbers fall short of the proposal, trust evaporates. Accurate solar design software paired with bankable simulation engines is the foundation of any credible financial projection.
Chapter 2: Simple Payback Period
The Formula
Simple payback period is the most intuitive financial metric in solar. The formula:
Payback Period = Net System Cost / Annual Net Savings
Net system cost means the total installed cost per watt (or per kWp) minus any upfront incentives, grants, or tax credits received immediately. Annual net savings include avoided electricity purchases plus any feed-in tariff revenue, minus ongoing costs like insurance or maintenance.
Residential Worked Example
Consider a residential installation in central Germany: Also see: Germany solar subsidies. For the latest details on Germany, see Community Solar Projects Germany.
| Parameter | Value |
|---|---|
| System size | 8 kWp |
| Total installed cost | €12,000 |
| Annual production | 8,400 kWh (1,050 kWh/kWp) |
| Self-consumption rate | 35% |
| Self-consumed electricity | 2,940 kWh |
| Grid electricity price | €0.34/kWh |
| Annual avoided cost | €1,000 |
| Exported electricity | 5,460 kWh |
| Feed-in tariff | €0.081/kWh |
| Annual feed-in revenue | €442 |
| Annual O&M cost | €120 |
| Net annual savings | €1,322 |
Simple payback = €12,000 / €1,322 = 9.1 years
Add a battery (increasing self-consumption to 65%):
| Parameter | Without Battery | With Battery |
|---|---|---|
| Self-consumed kWh | 2,940 | 5,460 |
| Avoided electricity cost | €1,000 | €1,856 |
| Exported kWh | 5,460 | 2,940 |
| Feed-in revenue | €442 | €238 |
| O&M cost | €120 | €180 |
| Net annual savings | €1,322 | €1,914 |
| System cost | €12,000 | €18,500 |
| Simple payback | 9.1 years | 9.7 years |
The battery increases annual savings by €592 but adds €6,500 to the system cost. It extends payback slightly but improves economics over the full 25-year system life because more savings are locked in against future electricity price increases.
Commercial Worked Example
A 120 kWp system on a manufacturing facility in the Netherlands:
| Parameter | Value |
|---|---|
| System size | 120 kWp |
| Total installed cost | €108,000 (€900/kWp) |
| Annual production | 120,000 kWh |
| Self-consumption rate | 80% |
| Avoided electricity cost (€0.22/kWh) | €21,120 |
| Feed-in revenue (24,000 kWh × €0.07) | €1,680 |
| Annual O&M | €1,800 |
| Net annual savings | €21,000 |
| Simple payback | 5.1 years |
Commercial systems typically achieve shorter payback because of higher self-consumption rates and lower per-kWp installation costs at scale.
Limitations of Simple Payback
Simple payback is easy to calculate and easy to explain. It is also incomplete. Here is what it ignores:
- Time value of money. A euro saved in Year 1 is worth more than a euro saved in Year 15.
- Cash flows after payback. A system with 6-year payback generates 19 more years of savings on a 25-year life. Simple payback ignores all of it.
- Electricity price escalation. If grid prices rise 3% annually, savings grow each year. Simple payback assumes flat prices.
- Panel degradation. Output drops 0.4–0.5% per year. Simple payback assumes flat production.
- Financing costs. If the customer takes a loan, interest payments affect actual cash flows.
For homeowners comparing two similar quotes, simple payback works well enough. For any decision involving significant capital, you need NPV and IRR.
Chapter 3: Net Present Value (NPV)
The Formula
NPV answers a different question than payback: “What is the total value this project creates, in today’s money?”
NPV = -Initial Investment + Sum of [Cash Flow in Year t / (1 + r)^t] for t = 1 to n
Where:
- r = discount rate (your required return or opportunity cost)
- t = year number
- n = project life (typically 25 years for solar)
A positive NPV means the project creates value above your required return. A negative NPV means it destroys value. An NPV of zero means you earn exactly your discount rate.
Discount Rate Explained
The discount rate is the single most consequential assumption in any NPV calculation. It represents the return you could earn on an alternative investment of similar risk.
| Investor Type | Typical Discount Rate | Rationale |
|---|---|---|
| Homeowner (cash purchase) | 3–5% | Opportunity cost of savings account or bonds |
| Homeowner (financed) | Loan interest rate | Direct cost of capital |
| Small business | 6–8% | WACC or alternative investment return |
| Corporate | 8–10% | Weighted average cost of capital |
| Infrastructure fund | 5–7% | Low-risk, long-duration asset class |
A 1% change in discount rate can shift NPV by €2,000–€4,000 on a residential system over 25 years. Always state your discount rate explicitly in proposals. Hiding it makes your analysis less credible.
Year-by-Year Cash Flow Table
Using the residential example from Chapter 2 (€12,000 system, €1,322 Year 1 savings), with 3% electricity price escalation, 0.5% annual degradation, and a 5% discount rate:
| Year | Production (kWh) | Annual Savings (€) | Discount Factor | Present Value (€) | Cumulative PV (€) |
|---|---|---|---|---|---|
| 0 | — | -12,000 | 1.000 | -12,000 | -12,000 |
| 1 | 8,400 | 1,322 | 0.952 | 1,259 | -10,741 |
| 2 | 8,358 | 1,354 | 0.907 | 1,228 | -9,513 |
| 3 | 8,316 | 1,387 | 0.864 | 1,198 | -8,315 |
| 5 | 8,234 | 1,455 | 0.784 | 1,141 | -6,039 |
| 10 | 8,029 | 1,662 | 0.614 | 1,020 | -1,050 |
| 11 | 7,989 | 1,700 | 0.585 | 994 | -56 |
| 12 | 7,949 | 1,739 | 0.557 | 969 | 913 |
| 15 | 7,831 | 1,863 | 0.481 | 896 | 3,548 |
| 20 | 7,637 | 2,116 | 0.377 | 798 | 7,726 |
| 25 | 7,448 | 2,403 | 0.295 | 709 | 11,340 |
NPV at 5% discount rate = €11,340
The system costs €12,000 today and generates €11,340 in value above the 5% return threshold over 25 years. Total undiscounted savings exceed €40,000.
The discounted payback (when cumulative PV turns positive) occurs in Year 12, versus Year 9 for simple payback. That gap is the time value of money at work.
Choosing the Right Discount Rate
The correct discount rate depends on who is making the decision and what they would do with the money otherwise.
For homeowners paying cash, use the return they could earn on a safe investment. European government bonds yield 2.5–3.5% and savings accounts offer 2–3%. Using 3–5% is reasonable. Also see: European Solar Incentives.
For homeowners taking a loan, the discount rate should match or exceed the loan interest rate. If the loan charges 4.5%, use 4.5% as the minimum discount rate. Any positive NPV at that rate means the solar investment beats the cost of borrowing.
For commercial entities, use the company’s weighted average cost of capital (WACC). Most mid-sized companies operate with WACC of 7–10%. If NPV is positive at the company’s WACC, the project creates shareholder value.
Key Takeaway
NPV is the gold standard for investment analysis because it accounts for the time value of money and shows absolute value creation. But it requires choosing a discount rate, which introduces subjectivity. Always present NPV at two or three discount rates so clients can see how the economics shift under different assumptions.
The generation and financial tool in SurgePV calculates NPV automatically using bankable production data and user-defined discount rates. This removes the spreadsheet work and ensures every proposal includes financially rigorous projections. For a direct comparison, see Arka 360 vs SurgePV.
Chapter 4: Internal Rate of Return (IRR)
Definition
IRR is the discount rate that makes NPV equal to zero. In plain terms, it is the annualized return the solar project generates on the capital invested.
If a project has an IRR of 14%, it means the cash flows (savings and revenue) represent a 14% annual return on the initial investment, accounting for the timing of those cash flows.
How to Interpret IRR
The decision rule is straightforward:
- IRR > cost of capital = the project creates value. Proceed.
- IRR = cost of capital = the project breaks even on a risk-adjusted basis. Marginal.
- IRR < cost of capital = the project destroys value. Reject or restructure.
For a homeowner with a 4.5% solar loan, a project IRR of 14% means they earn 9.5 percentage points above their cost of capital. For a corporation with 8% WACC, the same project earns 6 points above threshold.
Worked Example
Using the same residential system (€12,000 cost, €1,322 Year 1 savings, 3% electricity escalation, 0.5% degradation, 25-year life):
The IRR is the rate r that solves:
0 = -12,000 + 1,322/(1+r) + 1,354/(1+r)^2 + 1,387/(1+r)^3 + … + 2,403/(1+r)^25
Solving iteratively (or using a spreadsheet/financial calculator): IRR = 12.8%
This means the homeowner earns a 12.8% annual return on the €12,000 investment. Compare that to a 3% savings account or a 7% equity portfolio, and the solar system looks competitive, especially given the low risk profile (the sun does not default).
Common IRR Ranges by Segment
| Segment | Typical IRR Range | Key Drivers |
|---|---|---|
| Residential (Europe, cash) | 10–20% | Electricity price, self-consumption rate, system cost |
| Residential (Europe, financed) | 8–15% | Loan interest rate reduces effective return |
| Commercial (Europe) | 8–15% | Higher self-consumption, lower $/kWp, longer decision cycles |
| Utility-scale | 7–12% | PPAs, auction prices, financing structure |
| Community solar | 6–10% | Shared economics, cooperative structure |
Markets with high electricity prices (Germany, Italy, Belgium) consistently produce higher IRR than markets with low prices (Spain, Portugal) despite Spain and Portugal having better irradiance. This counterintuitive result exists because solar economics are driven more by what you avoid paying than by how much you produce. Also see: solar panel ROI in Italy. Also see: Spain net metering.
IRR vs. NPV: When to Use Which
| Metric | Strength | Weakness |
|---|---|---|
| IRR | Easy to compare across projects of different sizes | Does not show absolute value; can give misleading results with unconventional cash flows |
| NPV | Shows total value creation in currency terms | Requires choosing a discount rate; hard to compare projects of different sizes |
Use IRR when comparing projects of different sizes or when speaking with investors who think in terms of percentage returns. Use NPV when you need to show the total financial benefit of a specific project. Use both when presenting to sophisticated audiences.
Pro Tip
Never present IRR without also showing the assumptions behind it. An IRR of 18% built on optimistic production estimates and aggressive electricity price escalation is less credible than an IRR of 12% built on P90 production data and conservative price assumptions. Credibility closes more sales than impressive numbers.
Chapter 5: Sensitivity Analysis — How Uncertainty Affects Financial Projections
Why Sensitivity Analysis Matters
Every solar financial projection is built on assumptions: annual production, electricity price trajectory, system degradation rate, discount rate. None of these are certain. Sensitivity analysis shows how changes in key assumptions affect the financial outcome.
For solar installers, sensitivity analysis protects your credibility. If you present a single-point IRR of 14% and the customer’s accountant asks “what if production is 10% lower?”, you need an answer.
It also builds trust. Showing a range of outcomes signals that you understand risk and are not overselling.
Production Variance and IRR
The most impactful variable in solar financial analysis is production. Every other cash flow derives from it. Here is how production variance affects IRR for the €12,000 residential example:
| Production Variance | Annual kWh | Year 1 Savings (€) | IRR | NPV at 5% (€) |
|---|---|---|---|---|
| +15% | 9,660 | 1,538 | 16.1% | 15,200 |
| +10% | 9,240 | 1,461 | 15.0% | 13,810 |
| +5% | 8,820 | 1,391 | 13.9% | 12,570 |
| Base case | 8,400 | 1,322 | 12.8% | 11,340 |
| -5% | 7,980 | 1,252 | 11.6% | 10,090 |
| -10% | 7,560 | 1,183 | 10.4% | 8,850 |
| -15% | 7,140 | 1,113 | 9.2% | 7,580 |
A 10% production shortfall reduces IRR by 2.4 percentage points and cuts NPV by €2,490. That is not trivial. It is the difference between a compelling investment and a marginal one.
P50 vs. P90 Production Estimates
Professional solar finance uses probability-weighted production estimates:
- P50: the production level expected to be exceeded 50% of the time. This is the median estimate. Half the time, actual production will be higher; half the time, lower.
- P90: the production level expected to be exceeded 90% of the time. This is the conservative estimate. Only in 10% of years will production fall below this level.
The gap between P50 and P90 is typically 5–8% for a well-characterized site. Banks and institutional investors require P90 estimates for financing decisions.
Residential proposals often use P50, which is fine, but stating it explicitly builds credibility.
| Estimate | Production (kWh) | IRR | Payback (years) |
|---|---|---|---|
| P50 (median) | 8,400 | 12.8% | 9.1 |
| P75 | 8,064 | 11.8% | 9.5 |
| P90 (conservative) | 7,812 | 10.9% | 9.9 |
Key Takeaway
Simulation accuracy is not a technical detail. It is a financial variable. A simulation engine that consistently overestimates production by 5% is effectively inflating IRR by 1–2 percentage points on every proposal you send. Over hundreds of installations, that erodes customer trust and generates warranty complaints. Use validated simulation tools with documented bias margins.
Electricity Price Sensitivity
The second most impactful variable is future electricity prices. No one can predict these with certainty, but the range of reasonable assumptions matters:
| Annual Price Escalation | Year 10 Price (€/kWh) | Year 20 Price (€/kWh) | 25-Year NPV at 5% (€) |
|---|---|---|---|
| 1% | 0.375 | 0.414 | 7,260 |
| 2% | 0.414 | 0.505 | 9,180 |
| 3% (base case) | 0.457 | 0.614 | 11,340 |
| 4% | 0.503 | 0.746 | 13,780 |
| 5% | 0.554 | 0.903 | 16,530 |
At 1% annual escalation, NPV drops to €7,260. At 5%, it rises to €16,530. The difference between conservative and optimistic price assumptions is larger than the system cost itself. This is why stating your price escalation assumption is non-negotiable in professional proposals.
Multi-Variable Sensitivity Matrix
Sophisticated analysis tests multiple variables simultaneously. Here is a two-variable matrix showing IRR at different production levels and electricity price escalation rates:
| 1% Escalation | 2% Escalation | 3% Escalation | 4% Escalation | |
|---|---|---|---|---|
| Production -10% | 7.2% | 8.7% | 10.4% | 12.1% |
| Production -5% | 8.3% | 9.9% | 11.6% | 13.4% |
| Base production | 9.4% | 11.0% | 12.8% | 14.6% |
| Production +5% | 10.4% | 12.1% | 13.9% | 15.8% |
| Production +10% | 11.4% | 13.1% | 15.0% | 17.0% |
Even in the worst-case corner (production -10%, 1% price escalation), IRR is 7.2% — still above most homeowners’ cost of capital. That is a powerful selling point: the investment holds up across a wide range of outcomes.
Generate Bankable Financial Projections in Minutes
SurgePV’s generation and financial tool produces NPV, IRR, and payback calculations from validated simulation data. Every proposal includes sensitivity analysis your customers can trust.
Book a DemoNo commitment required · 20 minutes · Live project walkthrough
Chapter 6: Presenting Financial Analysis to Different Audiences
The same solar project requires different financial narratives depending on who is across the table. Getting this wrong is the fastest way to lose a deal you should have won.
Homeowners: Lead with Payback, Support with Savings
Homeowners think in monthly and annual terms. They want concrete, personal numbers.
What to present:
- Simple payback period (“Your system pays for itself in 6.5 years”)
- Monthly savings (“You save €150 per month on electricity, starting immediately”)
- Total 25-year savings (“Over the system lifetime, you save €42,000”)
- Comparison to doing nothing (“Without solar, you will pay €58,000 in electricity over 25 years at current escalation rates”) See our guide on Agricultural Solar Case Study for more. For France-specific information, see Floating Solar Farms France.
What to skip:
- NPV (requires explaining discount rates, which creates confusion)
- IRR (percentage returns do not resonate with non-financial audiences)
- LCOE (too abstract)
What to have ready if asked:
- Year-by-year savings table (some homeowners are financially sophisticated)
- Battery add-on economics (payback with and without storage)
- Financing comparison (cash vs. loan, monthly payment vs. savings)
For more on structuring homeowner conversations, see our guide on solar sales conversion.
Commercial Property Owners: Lead with IRR and NPV
Commercial decision-makers compare solar against other uses of capital: facility upgrades, equipment purchases, financial investments. You need to speak their language.
What to present:
- IRR compared to their cost of capital (“Your project IRR is 13.2%, well above your 8% WACC”)
- NPV (“The project creates €47,000 in value above your required return over 25 years”)
- Simple payback as supporting context (“Payback in 5.1 years, with 20 years of additional savings”)
- Tax implications (depreciation (MACRS) benefits, any applicable grants)
What to include in the written proposal:
- Year-by-year cash flow table with discount factors
- Sensitivity analysis at three production levels
- Electricity price escalation assumptions with source
- Maintenance cost schedule See Solar Operations and Maintenance for detailed guidance.
Investors and Lenders: Lead with IRR, DSCR, and LCOE
Institutional investors and banks require a different level of rigor. They evaluate solar alongside infrastructure funds, bonds, and private equity. Your financial analysis must be bankable.
Required metrics:
- IRR: Primary return metric. Present at P50 and P90 production levels.
- DSCR (Debt Service Coverage Ratio): Net operating income divided by debt service. Lenders require minimum 1.2x, often 1.3x. If your project shows 1.4x DSCR, lead with it.
- LCOE (Levelized Cost of Energy): Total lifetime cost divided by total lifetime production. If LCOE is €0.05/kWh against a grid price of €0.30/kWh, that margin tells the profitability story instantly.
- NPV: Absolute value metric for portfolio allocation decisions.
- Cash-on-cash return: Annual cash flow divided by equity invested. Relevant when projects use leverage.
What investors expect in documentation:
- Independent energy yield assessment (not just your software output)
- Equipment datasheets with warranty terms
- O&M contract details and cost escalation schedule
- Insurance coverage and deductible structure
- Grid connection agreement and export terms
Pro Tip
When presenting to investors, use P90 production for your base case and P50 as the upside scenario. This reversal from typical sales presentations signals that you understand bankable finance. Investors notice, and it builds credibility faster than any metric can.
How SurgePV Automates Financial Reporting
Building year-by-year cash flow tables, calculating NPV at multiple discount rates, and running sensitivity analyses manually takes hours. For a busy installation company running 10–20 proposals per week, that is not sustainable.
The generation and financial tool in solar design software from SurgePV automates the entire financial analysis workflow:
- Production simulation feeds directly into financial models — no manual data entry
- NPV, IRR, and payback calculated automatically from system design parameters
- Sensitivity tables generated at user-defined production and price scenarios
- Professional reports formatted for homeowners, commercial clients, or investors
- Solar proposal software packages the technical design and financial analysis into a single branded document
The result: every proposal includes rigorous financial analysis without requiring a finance team. That consistency is what separates companies that close at 25–30% from those stuck at 15%.
For a deeper look at how financing structure affects these metrics, see the solar financing options guide. And for strategies on growing your installation business, explore our solar business growth strategies.
Free Tool
Try our payback period calculator to model simple and discounted payback for any residential or commercial solar project.
Further Reading
Explore our complete financial modeling guide for chapters covering NPV, IRR, LCOE, sensitivity analysis, and investor-ready reporting.
Frequently Asked Questions
What is a good IRR for a solar project?
Residential solar projects typically achieve IRR of 10–20% depending on electricity prices, system cost, and local incentives. Commercial projects range from 8–15%. Utility-scale projects target 7–12%. An IRR above your cost of capital or discount rate means the project creates value. In European markets with electricity prices above €0.25/kWh, residential IRR regularly exceeds 12%.
How do you calculate payback period for solar panels?
Divide the net system cost (after incentives) by the annual electricity savings. For a €12,000 system generating €1,800 in annual savings, simple payback is 6.7 years. For more accuracy, use discounted payback that accounts for the time value of money, electricity price escalation, and panel degradation of 0.4–0.5% per year. The generation and financial tool calculates both simple and discounted payback automatically from your system design.
What is NPV in solar energy projects?
Net Present Value is the sum of all future cash flows from a solar project, discounted back to today’s value, minus the initial investment. A positive NPV means the project generates more value than it costs. For a typical 6 kWp residential system in Europe, NPV over 25 years ranges from €8,000 to €20,000 depending on electricity prices and discount rate. NPV is the preferred metric for commercial decision-makers because it shows absolute value creation.
How does the discount rate affect solar project NPV?
A higher discount rate reduces the present value of future savings, lowering NPV. At a 3% discount rate, a residential solar project might show NPV of €18,000 over 25 years. At 8%, that same project might show €9,000. Homeowners typically use 3–5%. Commercial entities use 6–10%. The choice of discount rate often matters more than a 5% difference in production estimates, which is why stating it explicitly in proposals builds credibility.
What financial metrics do solar investors look at?
Professional solar investors evaluate IRR as the primary return metric, DSCR (Debt Service Coverage Ratio) for bankability with a minimum of 1.2x, LCOE for competitiveness against grid prices, NPV for absolute value creation, and cash-on-cash return for equity yield. They also require P90 production estimates rather than P50, which typically reduces projected output by 5–8%. For more on structuring investor-ready proposals, see our guide on marketing for solar installers.