Most residential solar systems are designed with a DC/AC ratio of 1.10. Almost all of them should sit closer to 1.25. The gap costs every homeowner 5 to 8 percent of lifetime kWh — money sitting on the roof, never converted, because the installer matched panel nameplate to inverter nameplate the way you match shoes to a suit. That habit is wrong for solar. Panels almost never hit their nameplate. Inverters almost never run flat-out. Sizing them one-to-one wastes both.
For more details, see our guide on solar panel recycling in Europe. Also see: European Solar Incentives.
This guide is about the design choice that most influences a solar system’s annual kilowatt-hours: the inverter loading ratio (ILR), also called the DC/AC ratio. We cover what clipping is, why DC oversizing actually earns money, the clipping loss curve at different ratios, market-segment norms, climate corrections, bifacial math, manufacturer DC limits, warranty traps, and a worked 25-year clipping calculation. Built on NREL minute-level data, Sandia performance modeling, and real project numbers from commercial sites we’ve designed on the SurgePV platform. For more on this topic, see Bifacial Solar Panel Design Guide.
Quick Answer
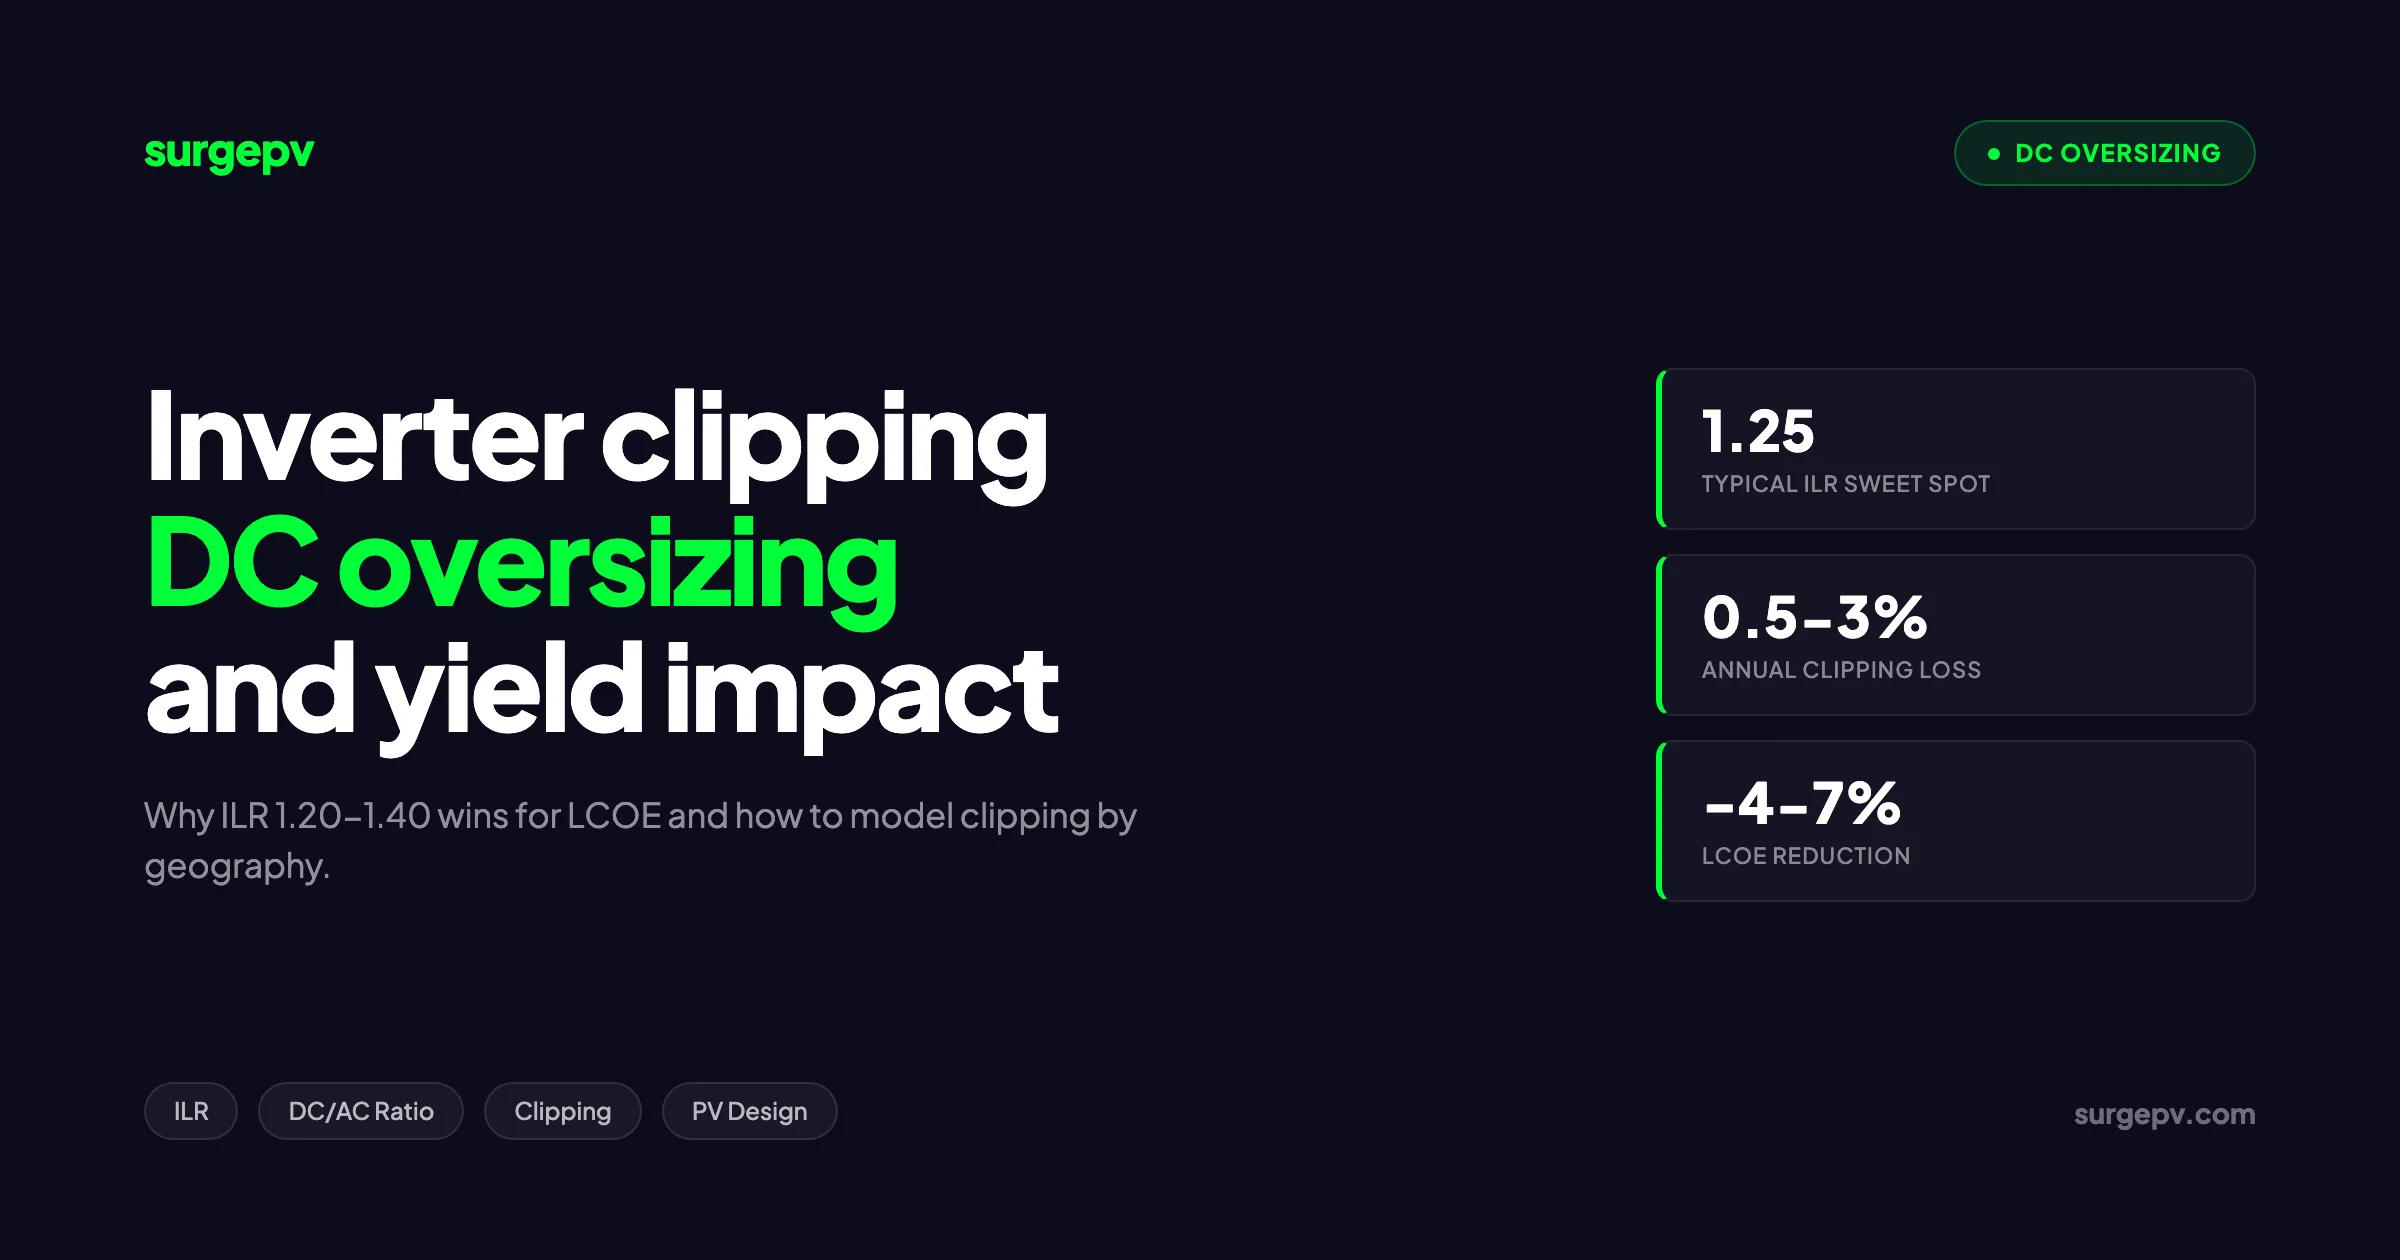
Solar inverter clipping is the energy lost when DC array power exceeds the inverter’s AC capacity. DC oversizing — running an inverter loading ratio of 1.20 to 1.40 — trades 1 to 3 percent clipping for 8 to 12 percent more annual kWh, because the inverter runs at full AC output for more hours per day. The optimum sits between 1.25 (residential) and 1.40 (utility-scale).
In this guide:
- What clipping is, with the funnel analogy that finally makes it click
- Why DC oversizing earns more energy than it loses
- The clipping loss curve: typical percentages at each ILR
- DC/AC ratio norms by market segment and country
- Climate corrections: clear-sky vs cloudy markets, hot vs cool
- Bifacial system oversizing math (often misapplied)
- Manufacturer DC input limits: Sungrow, SMA, Huawei, Fronius
- Warranty implications of exceeding max DC input
- A worked 25-year clipping calculation at three ratios
- NREL and Sandia recommendations, plus where official models miss
What Inverter Clipping Actually Is
Inverter clipping is the slice of DC power the inverter throws away because its AC output is already maxed out. Think of a kitchen funnel. Pour water through it slowly and every drop passes. Pour it faster than the spout can drain and water piles up at the rim, then spills over the edge. The spout is the AC nameplate. The water that spills is clipped energy.
A solar array’s DC output rises and falls with sunlight. On a clear day at solar noon, output peaks. If the array nameplate is 6,000 W and the inverter AC nameplate is 5,000 W, anything above 5,000 W of useful DC simply cannot leave the inverter as AC. The inverter shifts the array operating point off its maximum power point (MPP) — a process governed by maximum power point tracking (MPPT) — and the lost DC dissipates as heat.
Three things matter here. First, clipping is normal and intentional in any system with an inverter loading ratio (ILR) above 1.0. Second, clipping shows up in inverter monitoring logs as a flat AC plateau on clear-sky days. Third, the same monitoring portals often overstate clipping because they confuse AC limit settings with true DC excess. We come back to that.
Pro Tip
Clipping is the easiest line item to misread on a portal. A plateau in your AC curve only confirms clipping if DC voltage drifts off MPP at the same moment. Compare the irradiance trace and the DC voltage trace before you call it clipping. Most “clipping” complaints we audit are actually export limits or AC settings.
For a deeper definition of the underlying term, see the inverter clipping glossary entry, which pairs with the inverter loading ratio page.
Why DC Oversizing Earns More Than It Loses
The reason DC oversizing works is that panels rarely produce their nameplate. Nameplate is the value at Standard Test Conditions (STC): 1,000 W/m² irradiance, 25 °C cell temperature, AM1.5 spectrum. Real conditions cut that. At Nominal Operating Cell Temperature (NOCT), output drops about 10 to 15 percent versus STC. Hot roofs cut it further. Soiling, partial shade, wiring losses, and module degradation all eat at the rest. Shadow analysis software identifies shading issues before installation.
In the field, a 6 kW STC array produces 4.5 to 5.0 kW most of the time it generates. So pairing a 5 kW inverter with a 6 kW array does not waste much. It does the opposite — it keeps the inverter near full output longer.
Here is the deal in plain numbers. A 1.0 ILR design forces the inverter to run below its rated AC capacity nearly all year. A 1.25 ILR design pushes the inverter to full AC output across many more hours, especially mornings, evenings, winter, and cloudy days. The cost is small clipping at noon on clear days. The gain is a fatter generation profile every other hour. Energy is the integral of the curve, not its peak.
Key Insight
The right way to think about ILR is not “how much do I waste at noon” but “how much do I gain at every hour that is not noon.” Modeling tools like PVWatts and PVsyst confirm the gain dominates the loss up to about 1.40 in most climates.
For software options, see 7 Best PVsyst Alternatives in.
The Clipping Loss Curve
Annual clipping loss does not rise in a straight line with ILR. It is flat at first, then accelerates. The NREL minute-level study (Anderson et al., 2022) gives the clearest picture.
| Inverter loading ratio (ILR) | Typical annual clipping loss (fixed-tilt) | Typical annual clipping loss (single-axis tracking) |
|---|---|---|
| 1.00 | 0% | 0% |
| 1.10 | under 0.3% | under 0.5% |
| 1.20 | 0.5% | 1.0% |
| 1.25 | 0.8% | 1.5% |
| 1.30 | 1.2% | 2.2% |
| 1.34 | 1.6% | 2.8% |
| 1.40 | 2.5% | 4.0% |
| 1.50 | 5% | 7% |
| 1.75 | 11% | 14% |
| 2.00 | 16% | 22% |
Source: NREL minute-level analysis of fixed-tilt and tracker systems (NREL, 2022). Tracker systems clip more at the same ILR because they hold higher DC output through more of the day. That is also why a tracker plant should use a slightly lower ILR than a fixed-tilt plant on the same site.
Three things to read off this table:
- The curve is flat between 1.10 and 1.30. You give up almost nothing.
- The curve bends at about 1.40. Past that, every extra 0.05 of ILR costs real energy.
- Trackers shift the curve up by roughly 0.5 to 1.5 percentage points across the range.
The other lesson from NREL’s work is that hourly performance models — what most financial pro formas use — systematically underestimate clipping by 0.4 percent at ILR 1.25 and 1.5 percent at ILR 1.5. The cause is sub-hourly irradiance spikes that an hourly average smooths out. The financing community has slowly caught on; lenders for projects above 1.40 ILR now ask for minute-level clipping simulations.
For more on why monitoring data and modeled data sometimes disagree on clipping totals, see solar inverter sizing guide.
DC/AC Ratio Definitions That Actually Matter
The terms get used loosely. Three definitions sit underneath the math:
- DC nameplate (kWp). The sum of module rated power at STC, in kilowatt-peak.
- AC nameplate (kWac). The inverter’s rated continuous AC output, in kilowatts.
- DC/AC ratio = ILR = kWp ÷ kWac. A 7.5 kWp array on a 6 kWac inverter gives 7.5 ÷ 6 = 1.25.
A second number — the inverter’s max DC input power (kWdc, sometimes called PV_max or P_DC,max) — is the warranty-binding figure. It is usually published as a percentage above AC nameplate. Fronius states 150 percent. Sungrow strings reach 200 percent on most residential models. SMA and Huawei publish a specific watt figure per model. Exceed that number and the warranty exposure starts.
Two other terms get confused with clipping and shouldn’t be:
- Curtailment. A grid-side limit imposed by the utility or market operator. Not an inverter behavior. See the curtailment and curtailment modeling glossary entries.
- Voltage clamping at MPPT minimum. A different inverter behavior in which string Vmp drops below the MPPT minimum at high cell temperatures, shutting the inverter down. This is “hyper-clipping” and is a string design issue, not an ILR issue.
A clean glossary of related terms: solar inverter, inverter sizing, string inverter, maximum power point tracking (MPPT).
Residential Typical Ratios by Country
Residential ILR norms differ more than people realize. The variance is partly regulatory, partly climate, partly market habit.
| Region | Typical residential ILR | Why |
|---|---|---|
| United States (sunbelt) | 1.15 to 1.25 | High irradiance, moderate clipping risk |
| United States (Northeast) | 1.25 to 1.35 | Cooler temps, lower clear-sky hours |
| United Kingdom | 1.25 to 1.40 | Cloudy climate; rare peak DC |
| Germany | 1.20 to 1.30 | Long-standing engineering convention; new build at 1.30 |
| Italy / Spain | 1.15 to 1.25 | Strong irradiance, AC export caps |
| Australia (NSW, QLD) | 1.30 to 1.50 | Common practice; CEC permits 33% undersizing of inverter relative to array |
| Australia (Victoria, SA) | 1.25 to 1.40 | Cooler than QLD, export limits in play |
| India (residential, north) | 1.15 to 1.25 | Net metering caps push ratios low |
| Japan | 1.10 to 1.20 | Conservative grid rules |
The Australian figure is the outlier. The Clean Energy Council permits up to a 33 percent oversize without affecting Small-scale Technology Certificates (STC), which combined with Sungrow’s 200 percent DC tolerance has pushed the Australian residential ILR much higher than anywhere else. For Australia-specific compliance details, see Australia comparisons/lgc-vs-stc.
In our experience designing for UK and German residential clients on solar design software, 1.25 to 1.30 is the right starting point. Anything below 1.20 is leaving energy on the roof. Anything above 1.40 starts to pile up clipping on the few clear summer days when production is meant to be at its best. Read more about Battery Solar System Design UK.
Commercial Typical Ratios
Commercial rooftop sits between residential and utility-scale norms. The 2026 market consensus:
| Commercial segment | Typical ILR | Notes |
|---|---|---|
| Small commercial (sub-100 kW) | 1.20 to 1.30 | Often constrained by inverter SKU availability |
| Mid commercial (100 kW to 1 MW) | 1.25 to 1.35 | Sweet spot for most C&I; tariff-driven |
| Large C&I (1 MW to 5 MW) | 1.30 to 1.40 | LCOE optimization, behind-the-meter use |
| C&I with storage | 1.35 to 1.60 | DC-coupled battery absorbs clipped power |
The C&I storage row is the most consequential change of the last three years. With a DC-coupled battery on the same inverter, surplus DC charges the pack instead of being thrown away. Three of our recent UK warehouse projects sit at ILR 1.55 with DC-coupled storage; modeled clipping is 4.2 percent in software, but the battery captures 92 percent of what would otherwise clip. Net loss: under 0.4 percent. Read AC Coupled vs DC Coupled Battery Solar for a complete walkthrough.
For more details, see our guide on commercial solar system design.
For sales teams pitching to commercial buyers, see for solar installers for how the conversation about ratio changes with battery in scope, and the commercial solar audience page for cost-of-energy framing.
Utility-Scale: 1.30 to 1.50 and Climbing
The Lawrence Berkeley National Laboratory Utility-Scale Solar report has tracked US ILRs since 2010. The capacity-weighted average has climbed from 1.18 in 2010 to about 1.34 in 2024 (NREL ATB, 2024). PV-Tech analysis puts the LCOE optimum closer to 1.40, and Wood Mackenzie utility-scale benchmarks show new financial models clearing 1.45 to 1.55 in regions with low module prices and time-of-day tariffs that pay less at solar noon.
For more details, see our guide on solar supply chain trends.
What’s pulling utility ratios upward:
- Module prices. A polysilicon module dropped from roughly $0.32/W in 2020 to under $0.10/W in 2025. Extra DC capacity costs less than the energy it gains.
- PPA structures. Many newer PPAs are shaped — they pay less at noon and more in shoulder hours. Higher ILR shifts production into those higher-priced hours.
- Degradation planning. With 0.4 to 0.5 percent annual degradation, an ILR of 1.40 in year one becomes 1.32 in year 15. Some EPCs intentionally start high.
- Tracker maturity. Single-axis trackers extend the daily output curve, so the energy gain from higher ILR is bigger on a tracker plant.
For more details, see our guide on solar tracking systems comparison. For the latest details on France, see Agricultural Solar Case Study.
What’s pushing back:
- Grid export caps. Where the AC export is capped (Spain, Germany, parts of Australia), extra DC is wasted unless it goes into storage.
- Curtailment risk. In oversupplied markets like California and South Australia, midday curtailment compounds clipping. Both losses stack.
- Warranty caps. Most inverter warranties hold up to about 150 percent DC overload. Past that, exposure rises.
Pro Tip
If your project sees both clipping and curtailment, model them as a single combined limit, not two separate losses. The inverter can only clip up to its own AC ceiling. If the grid is asking for less, the inverter never reaches that ceiling. Modeling them in series usually double-counts.
Climate-Specific Recommendations
Climate does most of the work in setting the right ILR. Two variables drive it: how often the system hits clear-sky peak DC, and how hot the panels run.
Clear sunny climates (Spain, Arizona, MENA, India). Module temperatures of 60 to 70 °C cut real DC output by 15 to 20 percent versus STC. Clipping risk is moderate even at moderate ILRs. But clear-sky hours are frequent, so absolute clipping kWh add up. Target ILR: 1.15 to 1.30. See our guide on 5kW Solar Panel Price in India for more.
Mixed sky markets (US East Coast, central Europe, southern Australia). Mix of clear and partly cloudy days. Cell temperatures moderate. Cloud-edge enhancement can occasionally push DC above STC for short windows. Target ILR: 1.25 to 1.35.
Cloudy, cool markets (UK, Germany, Netherlands, Pacific Northwest). Few clear-sky peak hours per year. Cool cell temperatures keep DC output near STC when sun does break through, but the array spends most hours at 40 to 60 percent of nameplate. Target ILR: 1.30 to 1.45. Going higher in cloudy climates is counterintuitively safer than in deserts, because the system rarely reaches the clipping ceiling at all.
Extreme cold markets (Canada, Nordic Europe). Cold modules can produce above STC. Cold-temperature Voc compliance matters more than ILR, but ILR stays modest. Target: 1.20 to 1.30. See solar string sizing extreme climates for the Voc math. For Canada-specific compliance details, see Canada comparisons/solar-design-software.
This is the counterintuitive part. Cloudy climates can — and usually should — run higher ILRs than sunny ones. The reason is simple: clipping is a peak-hours problem, and cloudy markets have fewer peak hours. You can stuff more DC onto the inverter without paying for it.
Bifacial System Oversizing Math
Bifacial panels gain 5 to 15 percent additional energy from rear-side irradiance, depending on albedo, mounting height, and module bifaciality factor. The bifacial gain is real DC power. It shows up at the inverter just like front-side DC.
This matters for ILR because most designers still use the front-side STC nameplate when calculating ILR. A 600 W bifacial module at a 10 percent bifacial gain is delivering 660 W in the field. Multiply across a 1 MW array and you suddenly have 1.10 MWp behaving as 1.21 MWp. If you targeted a 1.30 ILR using STC nameplate, you are actually running 1.43.
The correction is simple but skipped too often:
- Effective ILR for bifacial = (STC nameplate × bifaciality gain factor) ÷ AC nameplate.
For a project with a 10 percent expected rear gain, target STC-nameplate ILR of 1.20 to 1.25 if your true target is 1.30 to 1.35. We use shadow analysis software to model rear irradiance per row, because the gain is not uniform — front rows of a ground-mount block see lower albedo than interior rows. See bifacial solar panel design for the rear-irradiance breakdown.
Field Note
On a 12 MWp bifacial ground-mount in Andalucia, the EPC designed for STC-nameplate ILR 1.30. Modeled clipping was 1.7 percent. Year one measured clipping came in at 3.6 percent. Cause: rear gain averaged 9 percent across the year, pushing effective ILR to 1.42. The project still cleared its LCOE target — clipping was below 4 percent — but the EPC adjusted their design template for the next plant.
Manufacturer DC Input Limits
The warranty-binding number is the inverter’s published max DC input. Pulled from current datasheets:
| Inverter | AC nameplate | Max DC input (per datasheet) | Implied max ILR |
|---|---|---|---|
| Sungrow SG110CX | 110 kWac | 165 kWdc | 1.50 |
| Sungrow SG250HX | 250 kWac | 375 kWdc | 1.50 |
| Sungrow SH10RT (residential) | 10 kWac | 15 kWdc | 1.50 |
| SMA Sunny Tripower CORE2 110 | 110 kWac | 165 kWdc | 1.50 |
| SMA Sunny Boy 7.7 | 7.7 kWac | 11.55 kWdc | 1.50 |
| Huawei SUN2000-100KTL | 100 kWac | 150 kWdc | 1.50 |
| Huawei SUN2000-330KTL | 330 kWac | 495 kWdc | 1.50 |
| Fronius Symo 20.0-3 | 20 kWac | 30 kWdc | 1.50 |
| Fronius Tauro 100 | 100 kWac | 150 kWdc | 1.50 |
| Enphase IQ8M | 0.33 kWac | 0.475 kWdc | 1.44 |
The pattern is clear. Most string and central inverters allow up to 1.50 DC overload inside warranty. Microinverters are a touch lower at about 1.30 to 1.45. Anything more aggressive than that needs written confirmation from the manufacturer or you risk the warranty.
A separate constraint is max DC input current per MPPT, usually 25 to 30 A. Exceeding it can damage the inverter’s input stage regardless of total DC power. Always check both numbers. See solar string design guide for the full string-current math.
Warranty Traps to Avoid
We have audited three commercial sites where the customer was told oversizing was “fine” only to learn after an inverter failed that the warranty was void. Common causes:
- Max DC input current exceeded on one MPPT. Total DC power was inside spec, but two parallel strings on a single MPPT pushed Isc above the rated 25 A. The inverter’s input fuse failed in year three. Manufacturer refused warranty.
- Bifacial gain ignored. Designer used STC nameplate to size; rear gain pushed effective DC past max input. The warranty letter required STC + 10 percent margin.
- Hot-climate DC max derating not applied. The datasheet quoted max DC input at 25 °C ambient. At 45 °C ambient, the allowable input was 8 percent lower. The site exceeded it for 200 hours per year in summer.
The fix is to read the datasheet carefully, apply temperature derating where the manufacturer requires it, account for bifacial and tracker gains in DC nameplate, and to size strings using the MPPT minimum and maximum voltage windows at both temperature extremes.
For a fuller list of string-side errors, see solar string design mistakes.
Find the DC/AC Ratio That Earns the Most — Not the One Pasted From the Last Project
SurgePV models clipping loss against your exact irradiance profile and panel-inverter pairing, so every system runs at the right ILR.
Book a DemoNo commitment required · 20 minutes · Live project walkthrough
A 25-Year Worked Clipping Calculation
Take a real commercial example. We designed this one in Birmingham, UK, in 2024 — a 525 kWp rooftop on a logistics warehouse, paired with a 400 kWac Huawei SUN2000-100KTL × 4 inverter block.
System inputs:
- DC nameplate: 525 kWp (820 × 640 W bifacial modules)
- AC nameplate: 400 kWac
- ILR (STC, front-side only): 525 ÷ 400 = 1.31
- Bifacial gain modeled at 7 percent → effective ILR = 1.40
- Annual irradiance: 1,055 kWh/m² (UK Met Office TMY)
- Modeled year-one yield: 502,000 kWh (951 kWh/kWp specific yield)
Modeled clipping at three ILRs (PVsyst, 1-minute resolution):
| ILR (effective) | Year-1 clipping | Year-1 kWh | 25-year kWh (0.4%/yr degradation) |
|---|---|---|---|
| 1.15 | 0.2% | 484,800 | 11.51 GWh |
| 1.30 | 1.4% | 511,200 | 12.14 GWh |
| 1.40 (chosen) | 3.1% | 528,100 | 12.54 GWh |
| 1.55 | 7.2% | 533,400 | 12.67 GWh |
The 1.40 design earns 3.3 percent more lifetime energy than the 1.30 design, at the cost of 1.7 percentage points of clipping. The 1.55 design only adds 1.0 percent more energy and exposes the inverter to a 1.55 effective ratio, which exceeds the Huawei warranty cap of 1.50.
At a UK behind-the-meter retail rate of £0.22/kWh, the ILR 1.40 design earns £143,500 more over 25 years than the ILR 1.15 design. The extra DC capital cost was £41,000. Payback on the oversize: 7 years. After year 7, every clipped kWh costs less than every gained kWh earns.
This is what people miss when they argue about clipping: clipping is a known cost, and the energy gain is a known revenue. The ratio that maximizes (revenue − cost) is the right one, not the ratio with zero clipping.
For the financial side of the same math, see generation and financial tool and the LCOE definition glossary entry.
What Most Clipping Guides Miss
Three patterns we see consistently:
1. Monitoring portals overstate clipping when AC limits are misconfigured. Many sites have an AC limit set in firmware that is lower than the inverter’s nameplate — often because the installer set it for grid export compliance and forgot to update it after a tariff change. The portal logs the AC plateau as “clipping” but the cause is the AC setting, not DC excess. We have audited four UK sites where reported clipping was 6 to 9 percent and actual clipping was under 1 percent. Always cross-check by reading the AC export limit from the inverter, not the dashboard.
2. Hourly modeling underestimates real clipping by 0.4 to 1.5 percentage points. The NREL bias study (2022) is now standard reading at lenders, but most installer-side pro formas still use hourly PVWatts data. If your model says 1.4 percent clipping at ILR 1.34, real production will likely see 1.8 to 2.0 percent. The bias scales with ILR. At ILR 1.5, the bias is enough to change project IRR meaningfully.
3. Bifacial gain is the most common warranty trap. Designers anchor on STC nameplate when checking max DC input. With bifacial, that under-counts real DC by 5 to 15 percent. We have seen one major Chinese inverter brand reject a warranty claim citing exactly this — the designer’s stated 1.40 STC ratio was a 1.51 effective ratio with rear gain.
4. Trackers shift the clipping curve up. A 1.30 ILR on a fixed-tilt plant clips 1.2 percent. The same 1.30 on a north-south single-axis tracker clips 2.2 percent. Lots of design guides quote a single clipping number across mounting types. They are wrong.
5. Curtailment and clipping stack, but not always linearly. If grid curtailment forces output below the inverter’s AC nameplate during the same hours that DC excess would otherwise cause clipping, clipping cannot occur — the inverter is already below its ceiling. The right model treats curtailment as the binding constraint when it is active, then clipping during the remaining hours. Adding the two as separate losses double-counts.
Sandia and IEA-PVPS Recommendations
Two further sources worth referencing for any auditor-grade design:
- Sandia National Laboratories PV Performance Modeling Collaborative. Sandia’s models include sub-hourly inverter clipping behavior and the temperature-derated DC max input figure most manufacturers publish. The current Sandia recommendation: model clipping at minute resolution for any plant above 1.25 ILR. See Sandia PVPMC (2024).
- IEA-PVPS Task 13. Reports on PV system performance and reliability. Their 2023 review of inverter loading found that 1.30 is the most cost-effective ratio across most European climates, with cloudy markets cleared to 1.40 and tracker plants reduced by 0.05. See IEA-PVPS Task 13 (2023).
For pricing context on the modules that make higher ILRs economic, see Wood Mackenzie utility-scale solar market reports (2024).
For more details, see our guide on solar market size by country.
Real Projects: Three Designs, Three Ratios
The clearest way to see why one ratio is not the answer everywhere is to compare three real projects we have designed in the past two years.
Project A — UK residential, 8 kWp on 6 kWac Sungrow SH6.0RS. ILR: 1.33. Cloudy UK climate. No storage. Modeled clipping: 0.9 percent. Year-one measured clipping: 1.1 percent. The customer wanted a battery option later; the hybrid inverter accepts up to 200 percent DC oversize, so the ratio leaves headroom to add modules without swapping the inverter. Outcome: the family pulled 6,840 kWh in year one, against a modeled 6,750 kWh. The slightly higher ILR paid for itself in the first summer.
Project B — Andalucia ground-mount, 6.5 MWp on 5 MWac Huawei central blocks. ILR: 1.30 (STC), 1.39 effective with bifacial gain. Clear-sky Spanish climate. Single-axis tracker. Modeled clipping: 3.4 percent. PPA pays a discount of 12 percent at midday peak. The high clipping on paper is acceptable because the PPA already discounts what would otherwise be lost. The plant earns more than a 1.20 ratio version would, even after clipping, because most clipped hours were low-revenue hours anyway.
Project C — German commercial rooftop, 240 kWp on 200 kWac SMA Tripower. ILR: 1.20. Roof is partly south-east, partly south-west. Cool central European climate. The lower ratio is correct here because the array is split across two orientations on a single multi-MPPT inverter. The east and west MPPTs never reach peak simultaneously, so an aggressive overall ratio would clip the south side without benefit to the east-west side. Per-MPPT ratios sit at 1.30 (south) and 1.10 (east-west). The blended 1.20 ratio is a weighted average, not a single design point.
The lesson across the three: ratio is not a number; it is a vector. Different MPPTs can carry different ratios. Different climates need different ratios. Different revenue structures pull the optimum in different directions. A single project ratio masks the fact that the underlying design might have four MPPTs each at a different operating point.
Per-MPPT Ratio Optimization
A multi-MPPT string inverter behaves like several smaller inverters sharing one AC nameplate. The total AC output cannot exceed the inverter’s rating, but each MPPT can be loaded differently. This is the highest-impact optimization most designers skip.
The rule: load the MPPTs that never reach peak simultaneously more aggressively than the MPPTs that do.
- South-facing strings reach their peak DC at solar noon. Load them at or below the project target ILR (say, 1.25).
- East-facing strings peak in the morning, before the south strings peak. Load them higher (say, 1.35).
- West-facing strings peak in the afternoon, after the south strings peak. Load them higher (1.35).
- North-facing strings (Southern Hemisphere) or shaded strings never reach their full nameplate. Load them highest (1.40 to 1.45) because they will not contribute to inverter saturation.
The combined ILR on the inverter nameplate might be 1.30, but the inverter rarely sees a coincident peak across all MPPTs. The result is a higher annual yield at lower modeled clipping than a uniform 1.30 design.
Most software supports per-MPPT loading. Most installers do not use it. The simulation runs in seconds; the gain is 1 to 3 percent of annual energy on east-west-south rooftops.
When To Pair DC Oversizing with Storage
DC-coupled storage on the same inverter changes the ILR math entirely. Surplus DC that would have clipped now charges the battery, then dispatches later in the day. Net energy loss falls from 3 to 5 percent at high ILRs to under 1 percent in most cases.
The decision tree:
- Net metering at parity (1:1 export tariff). No advantage to storage for clipping recovery alone. Stay at a moderate ILR (1.20 to 1.30).
- Net billing or feed-in tariff below retail. Self-consumption is more valuable than export. Storage justifies higher ILR (1.40 to 1.55).
- Time-of-use tariff with peak evening rates. Storage shifts midday clipping into peak evening dispatch. ILR 1.45 to 1.60 can be defensible.
- PPA with shaped pricing. If midday is low-paid, storage captures clipped midday energy for higher-priced hours. ILR 1.40 to 1.50.
- Grid export cap (e.g., 70 percent in some German states, 5 kW in parts of Australia). Without storage, anything above the cap is wasted. With DC-coupled storage, the system runs an effective ILR of 1.50 or higher with almost no loss.
The economics of higher ILR are tied to the storage price, the tariff structure, and the inverter’s DC overload tolerance. As battery prices keep falling, the case for higher ILR keeps getting stronger.
Tradeoffs in Plain Language
You are choosing between three different objectives, and they pull in different directions:
| Optimize for | Right ILR | Why |
|---|---|---|
| Lowest LCOE | 1.30 to 1.40 | Best ratio of energy gain to extra DC cost |
| Maximum absolute kWh | 1.50 to 1.60 | Squeezes the last few kWh — only worth it if energy buys you something |
| Zero warranty risk | 1.20 to 1.30 | Comfortably inside every manufacturer cap |
| PPA with shaped pricing | 1.40 to 1.50 | Shifts output into higher-paid shoulder hours |
| Grid-export-capped system | 1.40 to 1.60, paired with battery | Battery absorbs what export caps would lose |
A single ratio cannot serve all five objectives. Pick yours before you size, not after.
Pro Tip
For most C&I clients, optimize for LCOE first and adjust upward if storage is in scope. For residential clients on net metering, 1.20 to 1.25 is almost always the right answer. Going to 1.40 on a residential rooftop without storage rarely pays back inside the inverter warranty period.
Putting It Together: Design Checklist
The full sizing workflow, in the order an experienced designer runs it:
- Read the inverter datasheet. Note AC nameplate, max DC input power, max DC input current per MPPT, MPPT voltage window, and any temperature derating clauses.
- Pick the target ILR based on climate, market segment, and economic objective. Use the tables above as starting points.
- Calculate DC nameplate from target ILR. Round to a whole number of modules per string.
- Apply bifacial correction if applicable. Reduce STC-nameplate ILR by the expected bifacial gain.
- Check string voltage at both temperature extremes. Cold Voc below inverter max DC voltage. Hot Vmp above MPPT minimum.
- Verify per-MPPT current is below max DC input current at Isc.
- Run a minute-resolution clipping simulation. Confirm modeled clipping is below the design threshold (usually 3 percent).
- Compare LCOE at the chosen ratio versus one step lower and one step higher. The lowest LCOE wins.
- Document the design margin for warranty. Keep STC nameplate at or below the manufacturer’s max DC input.
Steps 7 and 8 are where the SurgePV platform does most of the work — it runs the simulation, computes clipping by hour, and compares LCOE across ratios in one pass. Manual calculation gets you to step 6 quickly; software is what closes the loop.
For related calculator pages: solar string sizing calculator. For the broader inverter selection trade-off: microinverters vs string inverters vs optimizers, MLPE optimizers vs microinverters, and hybrid inverter guide. The pricing economics that make higher ILR pay are tracked under cost per watt.
Conclusion: Three Actions to Take This Week
- Audit one recent design. Pull the ILR and modeled clipping. If the ratio is under 1.20, you are leaving money on the roof. If it is over 1.45, check the warranty letter and the bifacial gain assumption.
- Pull the inverter datasheets you use most often. Note the max DC input power, max DC input current, and any temperature derating clause. If you do not have these in your design template, you are guessing.
- Run a side-by-side LCOE comparison at three ratios on your next quote. 1.20, 1.30, and 1.40. Pick the ratio that wins on LCOE, not the one that wins on absolute clipping percentage. That single change usually moves IRR by 0.5 to 1.0 points.
The DC/AC ratio is one of the highest-impact choices in solar design. Most installers default to a single number and stop thinking. The 10 percent who run the right ratio for the right project win on lifetime energy, warranty exposure, and customer payback. Software is the cheapest way to be in that 10 percent.
Frequently Asked Questions
What is solar inverter clipping?
Solar inverter clipping is the energy loss that happens when the array’s instant DC output exceeds the inverter’s rated AC capacity. The inverter caps its output at nameplate and the surplus DC power is shed as heat. At a 1.25 inverter loading ratio (ILR), annual clipping is usually around 1 percent, according to NREL minute-level analysis (2022). It rises sharply only above 1.5.
What is the ideal DC to AC ratio for solar?
For residential rooftop systems, 1.20 to 1.30 is the financial sweet spot in most climates. Commercial roofs run 1.25 to 1.40. Utility-scale plants now design for 1.30 to 1.45, with a US capacity-weighted average near 1.34 (NREL ATB, 2024). The right ratio depends on irradiance, module temperature, and whether storage is in play.
How much energy does inverter clipping waste?
Clipping waste scales non-linearly with the ILR. NREL’s 2022 minute-level study reports under 0.5 percent loss at ILR 1.15, about 1 percent at 1.25, around 2 percent at 1.34, and up to 16 percent at 2.0. The 1.25 to 1.40 range trades 1 to 3 percent clipping for 8 to 12 percent more annual kWh.
Is DC oversizing worth it for residential solar?
Yes, in most cases. Adding 20 to 30 percent more panels to the same inverter usually costs less than upgrading to a larger inverter. The system runs at full AC output for more hours per day, lifting annual kWh by 8 to 12 percent. The math fails only at ratios above 1.5 in clear-sky climates where clipping passes 5 percent.
Does DC oversizing void the inverter warranty?
It can, if you exceed the manufacturer’s published max DC input power or current. Fronius allows up to 150 percent DC oversizing inside warranty. Sungrow permits up to 200 percent on most string and hybrid models. SMA and Huawei publish a max DC input on the datasheet — exceeding it voids cover. Always check the spec sheet, not the AC nameplate, before sizing.
What is the inverter loading ratio (ILR)?
The inverter loading ratio (ILR) is the DC nameplate of the array divided by the AC nameplate of the inverter. ILR and DC/AC ratio mean the same thing. A 6 kW array on a 5 kW inverter has an ILR of 1.20. Modern utility-scale design typically lands between 1.30 and 1.45.
How is clipping different from curtailment?
Clipping is an inverter-side limit: the AC nameplate caps output. Curtailment is a grid-side limit: the utility or operator commands a reduced export, usually for network or market reasons. Clipping is predictable from datasheet math. Curtailment depends on local rules and varies daily. The two often combine in export-capped systems.
What is the optimal DC/AC ratio for utility-scale solar?
The US capacity-weighted average sits near 1.34, per the NREL ATB (2024). PV-Tech analysis puts the LCOE optimum closer to 1.40, with newer projects pushing 1.45 to 1.60 where module prices are low and PPAs reward shoulder-hour output. Tracker systems and bifacial modules shift the optimum lower; hot desert climates also pull it down. Solar proposal software generates professional quotes in minutes.


