Quick Answer
The global solar market added 450 GW in 2025, reaching 2.2 TW total installed capacity. China leads with 660 GW total, followed by the EU (406 GW) and US (200 GW). Annual investment exceeded $300 billion. Forecast: 5.5 TW by 2030 under current policies.
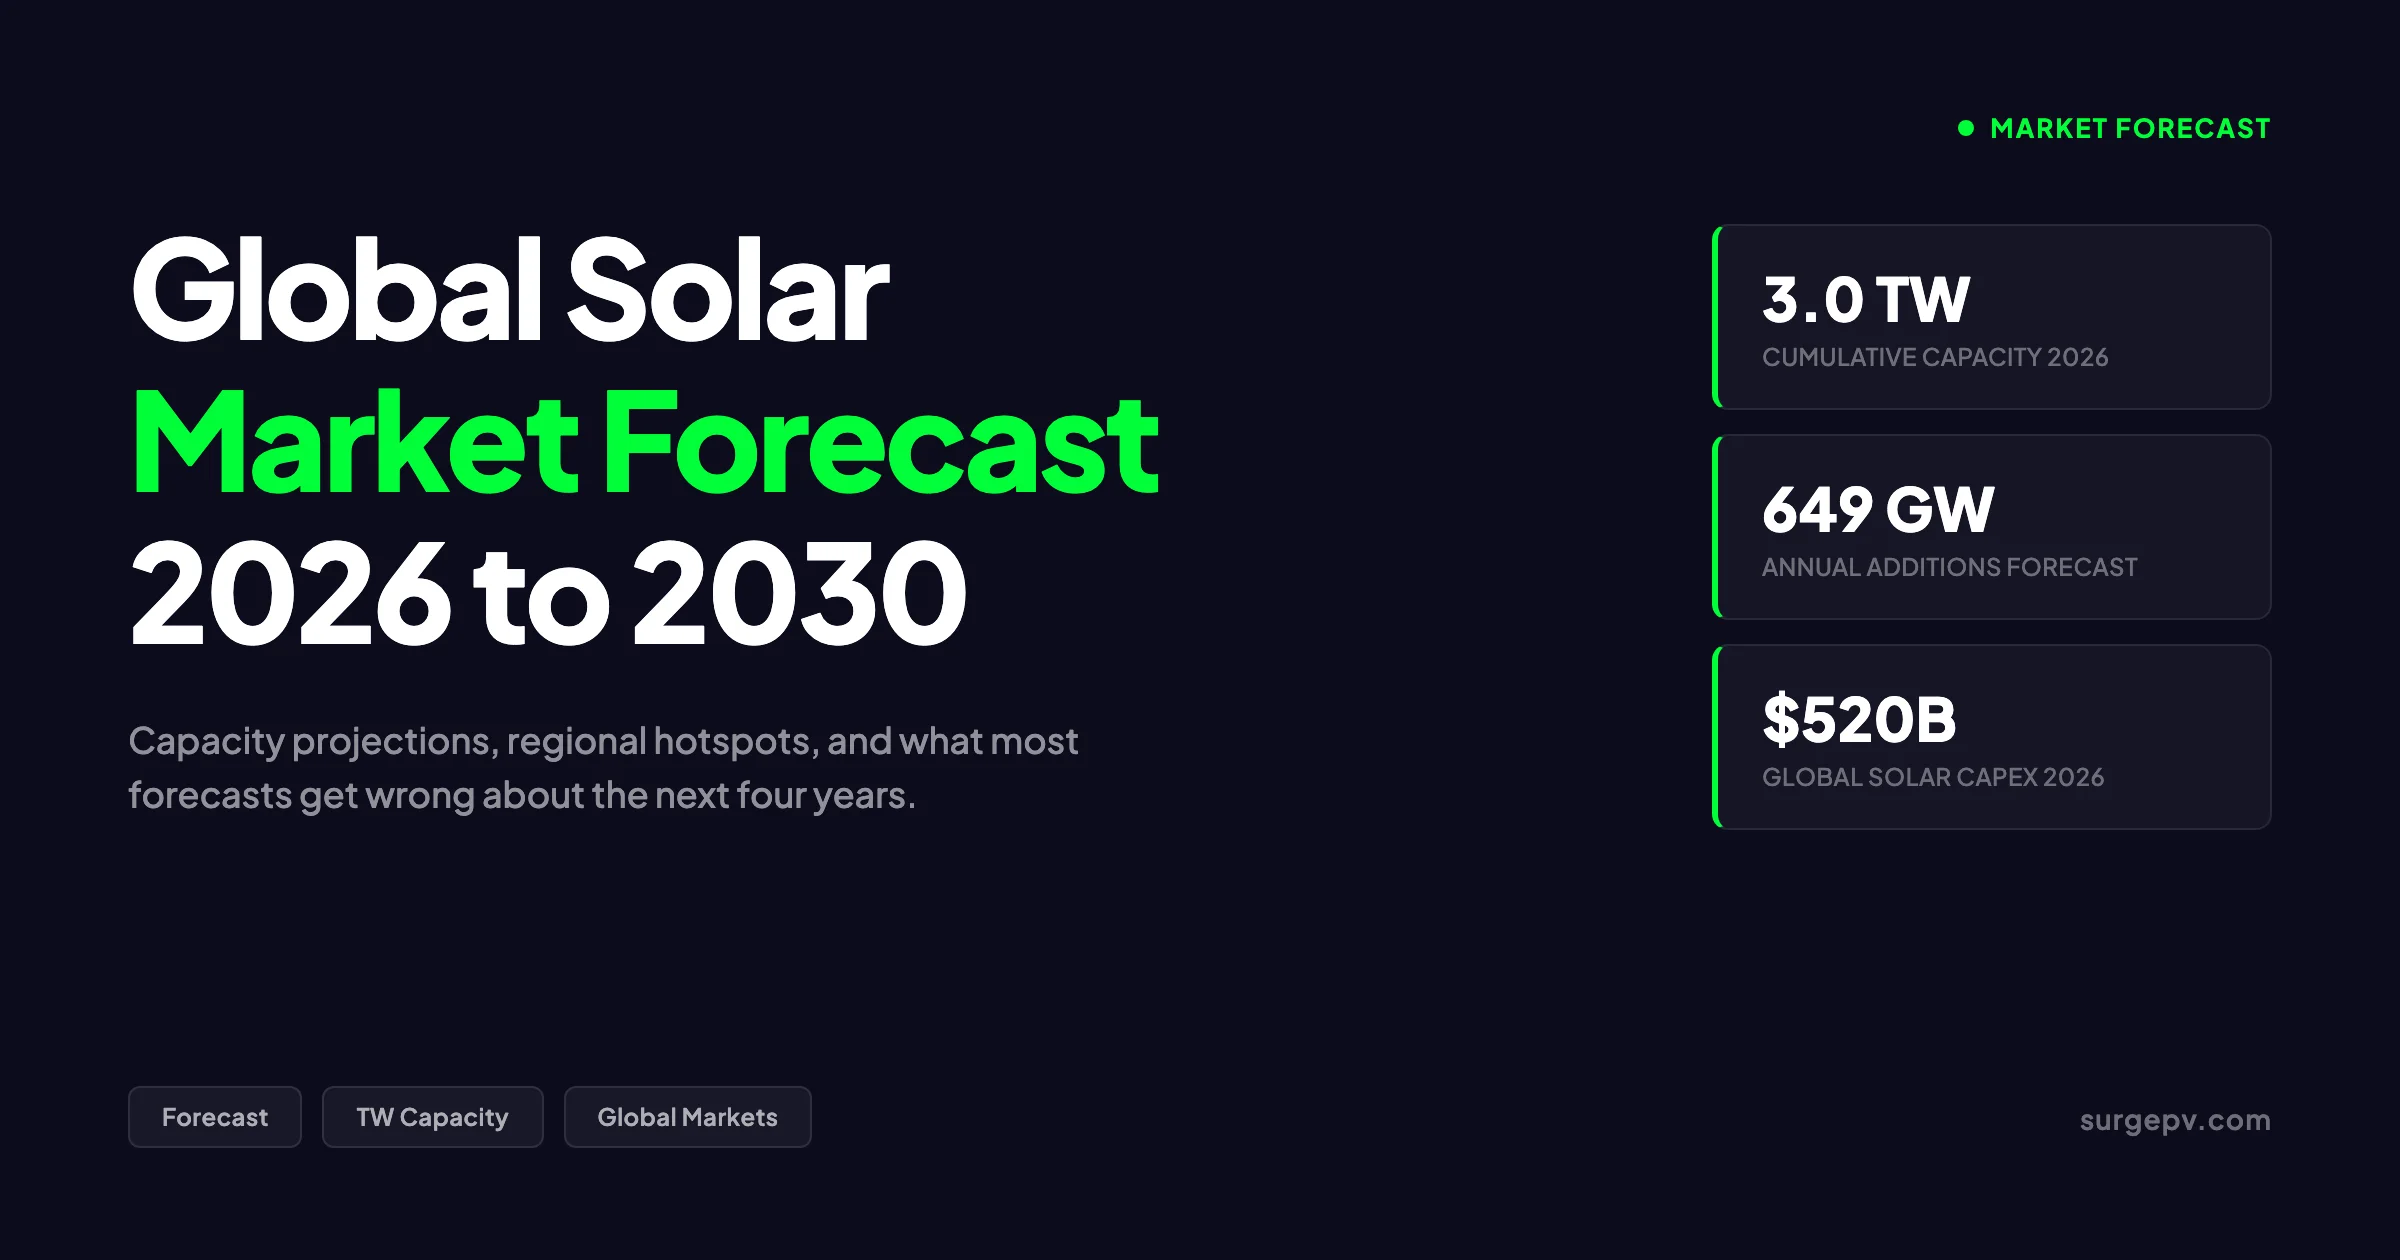
The global solar industry will install 649 GW of new capacity in 2026, push cumulative installations past 3 TW, and record its first annual contraction in modern history, according to BloombergNEF’s December 2025 outlook. That single sentence captures the contradiction at the heart of this market. Solar is bigger than ever, growing faster than every competing technology, and slowing for the first time in two decades.
The global solar market added 450 GW in 2025, reaching 2.2 TW total installed capacity. China leads with 660 GW total, followed by the EU (406 GW) and US (200 GW). Annual investment exceeded $300 billion. Forecast: 5.5 TW by 2030 under current policies.
This guide covers the full picture for the global solar market forecast 2026: capacity projections by region, demand drivers shaping deployment, supply-side constraints, investment trends, and what most published forecasts get wrong about the next four years. The numbers come from IRENA, the IEA, BloombergNEF, SolarPower Europe, Wood Mackenzie, NREL, and SEIA. The interpretation comes from running commercial project pipelines through this transition.
Quick Answer — Global Solar Market Forecast 2026 to 2030
BloombergNEF forecasts 649 GW of additions in 2026 (a 0.9% decline), recovering to 688 GW in 2027 and 743 GW by 2028. The IEA projects 4,600 GW of new renewable capacity from 2025 to 2030, with solar PV taking nearly 80% of that. China leads with 321 GW in 2026; India overtakes the US in second place. Cumulative global solar capacity passes 3 TW in 2026 and is on track for 6 to 7 TW by 2030.
In this guide:
- Current snapshot of global solar capacity and 2025 outturn data
- Forecast 2026 to 2030: capacity projections by region with named sources
- Regional hotspots across Asia, Europe, Americas, Middle East, and Africa
- Demand drivers shaping growth through 2030
- What most market forecasts get wrong about solar
- Supply-side constraints and grid bottlenecks
- Investment and capex trends shaping the next four years
- Practical implications for installers, developers, and manufacturers
Global Solar Market Snapshot 2026
The starting point for any forecast is current capacity. The 2025 data is now in, and the numbers reset what we know about scale.
Cumulative Installed Capacity Year End 2025
| Source | Cumulative PV Capacity | New Additions 2025 | YoY Growth |
|---|---|---|---|
| IEA PVPS Snapshot 2026 | 2,974 GW | 698 GWp | 16% |
| IRENA Renewable Capacity Statistics 2026 | 2,392 GW (AC basis) | 511 GW | 27% |
| BloombergNEF | 2,900+ GW | 655 GW | n/a |
| SolarPower Europe | 2,200 TW threshold passed 2024 | 600 GW (2024) | n/a |
Source variance is a function of definition. IEA PVPS reports DC nameplate capacity. IRENA reports AC capacity per its standardised methodology. BloombergNEF includes off-grid and behind-the-meter where IRENA does not. The figures are not directly comparable, but the direction is identical.
A few facts deserve emphasis. Solar accounted for 75% of all new renewable capacity added in 2025, according to IRENA (2026). Solar overtook wind globally for the first time. Thirty-five countries now exceed 10% theoretical PV penetration of electricity demand, up from 27 in 2024 and just 18 in 2023.
Top 10 National Markets — Annual Additions 2025
| Rank | Country | 2025 Additions (GW) | Cumulative (GW) |
|---|---|---|---|
| 1 | China | 372 | 1,242 (Feb 2026) |
| 2 | United States | 50 | 280 |
| 3 | India | 47 | 110 |
| 4 | Brazil | 17 | 60 |
| 5 | Germany | 16 | 110 |
| 6 | Spain | 9 | 41 |
| 7 | Saudi Arabia | 7 | 18 |
| 8 | Italy | 9 | 41 |
| 9 | Australia | 6 | 39 |
| 10 | Japan | 6 | 92 |
Sources: BloombergNEF Outlook 2026, Mercom India, IRENA. National numbers vary by reporting authority. Italy 2025 estimate per Terna. For Italy-specific information, see Commercial Rooftop Solar Case Study Italy.
China alone accounted for roughly 57% of new global capacity in 2025. The top five markets together took 78% of all installations. Concentration matters because it makes the global forecast sensitive to policy shifts in a small number of capitals.
Pro Tip — Track Both DC and AC Numbers
When comparing forecasts, always check whether the source uses DC or AC capacity. The ratio is typically 1.2 to 1.3, meaning a 100 GWdc forecast translates to roughly 80 GWac. Wood Mackenzie reports DC. IRENA reports AC. Confusing the two has cost developers real money in EPC contract negotiations.
Global Solar Market Forecast 2026 to 2030: Capacity Projections by Region
The headline 2026 number is a contraction. The longer-term trajectory is acceleration. Both can be true.
Global Solar Additions Forecast 2025 to 2030
| Year | BNEF (GW) | IEA Renewables 2025 (GW) | SolarPower Europe (GW) | Source Notes |
|---|---|---|---|---|
| 2025 (actual) | 655 | 670 | 600 (2024 baseline) | First three queries cite SP Europe 2024 number |
| 2026 | 649 | 720 | 770 | BNEF projects first contraction |
| 2027 | 688 | 780 | 830 | Recovery year |
| 2028 | 743 | 830 | 870 | Sustained growth resumes |
| 2029 | 800 | 880 | 930 | SP Europe medium case peak |
| 2030 | 860 | 950 | 1,000+ | TW per year crossed |
Sources: BloombergNEF Outlook (2026), IEA Renewables 2025, SolarPower Europe Market Outlook.
The spread between forecasters is wide. By 2030, BNEF and SolarPower Europe disagree by 140 GW per year. The gap reflects different assumptions about Chinese deployment after the 15th five-year plan and about US policy reversals.
Regional Share of New Additions 2026
| Region | 2026 Forecast Additions (GW) | Share of Global | Change vs 2025 |
|---|---|---|---|
| Asia-Pacific (excl China) | 95 | 14.6% | +18% |
| China | 321 | 49.5% | -14% |
| Europe (EU + UK + Norway) | 80 | 12.3% | -8% |
| North America | 54 | 8.3% | -16% |
| Latin America | 38 | 5.9% | +12% |
| Middle East | 28 | 4.3% | +28% |
| Africa | 14 | 2.2% | +18% |
| Rest of World | 19 | 2.9% | +5% |
Author analysis based on BNEF and IRENA regional data, May 2026.
China shrinks. Everyone else grows. The non-China world installed 251 GW in 2024, will deploy 283 GW in 2025, and reaches 308 GW in 2026 per BNEF. This is the structural story most headlines miss.
Cumulative Capacity Trajectory to 2030
| Year | Cumulative GW (Global) | Cumulative GW (China) | China Share |
|---|---|---|---|
| 2025 | 2,974 | 1,200 | 40.3% |
| 2026 | 3,620 | 1,520 | 42.0% |
| 2027 | 4,300 | 1,820 | 42.3% |
| 2028 | 5,040 | 2,130 | 42.3% |
| 2029 | 5,830 | 2,440 | 41.8% |
| 2030 | 6,690 | 2,750 | 41.1% |
Calculated from BNEF additions data plus IRENA 2025 baseline. Capacity figures are DC nameplate.
By 2030, cumulative global solar capacity exceeds 6.6 TW. The IEA accelerated case pushes that closer to 7.1 TW. Both numbers assume no major manufacturing disruption from a tariff escalation cycle.
Regional Hotspots: Asia, Europe, Americas, Middle East, and Africa
Five regional stories define the global solar market forecast 2026 and beyond. Each runs on different policy logic.
China: The Dominant Market in Transition
China deployed 372 GW in 2025 and slows to 321 GW in 2026. The deceleration is policy-driven, not demand-driven. The 14th five-year plan target of 1,200 GW combined wind and solar was hit two years early. The 15th plan, expected in late 2026, will reset targets but is unlikely to repeat the 2024 to 2025 surge.
Cumulative Chinese solar capacity reached 1,242 GW in February 2026 per Mercom India (2026). China alone holds half of all operational solar worldwide. The new 2035 NDC targets 3.6 TW of combined wind and solar capacity, which implies a return to elevated deployment in the late 2020s.
| Year | China Annual Additions (GW) | Driver |
|---|---|---|
| 2023 | 217 | Module price collapse |
| 2024 | 277 | Distributed solar surge |
| 2025 | 372 | Pre-grid-fee rush |
| 2026 | 321 | Policy moderation |
| 2027 | 340 | 15th plan implementation |
| 2030 (forecast) | 380 | NDC trajectory |
Sources: BNEF, NEA China, author estimates for 2027 to 2030.
The contrarian read: China’s 2026 deployment number is likely overstated by 8 to 12% due to grid curtailment in Inner Mongolia, Qinghai, and Xinjiang. Provincial curtailment rates exceeded 7% in Q1 2026 per State Grid data. Installed capacity is not delivered energy.
India: The Next Growth Engine
India adds 50 GW in 2026 and overtakes the US as the world’s second-largest solar market per BloombergNEF (2026). The country installed 27 GWdc in the first seven months of 2025, well ahead of its 32 GWdc annual target for the 2030 path.
| Year | India Annual Additions (GW) | Key Driver |
|---|---|---|
| 2024 | 26 | PM-KUSUM rural rooftop |
| 2025 | 47 | Utility-scale ramp |
| 2026 | 50 | PLI manufacturing online |
| 2030 (target) | 60+ | 345 GWdc cumulative goal |
Wood Mackenzie upgraded its 10-year India utility-scale PV outlook by 52% in late 2025. India’s domestic module manufacturing capacity reached 125 GW per year, exceeding near-term domestic demand. This creates export pressure that will reshape the global module trade through 2030. For installers tracking this market, see our analysis of solar market size by country and the 5 kW solar panel price in India.
Europe: Mature Markets, Slowing Growth
The EU hit its 2025 target of 400 GW with 406 GW total fleet capacity per SolarPower Europe (2025). The 2030 target of 750 GW now sits at risk. SP Europe’s medium scenario projects 718 GW by 2030, a 32 GW shortfall.
The European story is residential market contraction. Germany installed 16 GW in 2025, down from 17.5 GW peak. Italy dropped to 9 GW from 11 GW. Spain and France held steady at 9 to 8 GW respectively. Rooftop solar declined as energy crisis pressure eased and member states cut subsidies. Utility-scale held up. Also see: France solar feed-in tariffs. For France-specific information, see Agricultural Solar Case Study.
| Country | 2024 (GW) | 2025 (GW) | 2026 Forecast (GW) | 2030 Target (GW) |
|---|---|---|---|---|
| Germany | 17.5 | 16 | 15 | 215 |
| Spain | 8 | 9 | 10 | 76 |
| France | 7 | 8 | 9 | 100 |
| Italy | 11 | 9 | 9 | 80 |
| Poland | 5 | 5 | 6 | 30 |
| Netherlands | 4 | 3 | 3 | 35 |
Sources: SolarPower Europe Market Outlook 2025-2029, national regulators.
For deeper European context, see our guides to European solar incentives, solar energy policies in Europe, and electricity prices and solar ROI across Europe.
North America: Policy Reversal in the US
US solar installations fall 14% to 44 GW in 2026 per BNEF, the steepest decline of any major market. The One Big Beautiful Bill Act introduced foreign entity of concern restrictions and accelerated the phase-out of investment and production tax credits. Projects starting construction after December 31, 2025 face tighter eligibility rules.
| Period | US Solar Outlook (GWdc) | Change vs Pre-OBBBA |
|---|---|---|
| 2025-2030 base case | 246 | -4% |
| 2025-2030 low case | 202 | -18% |
| 2025-2030 high case | 280 | +6% |
Source: Wood Mackenzie US Solar Market Insight.
Canada continues its slow expansion, with Alberta and Ontario the main growth markets. Mexico’s market remains constrained by the CFE-led grid policy framework but private commercial and industrial deployment is recovering.
Middle East: The Fastest Growing Region
Middle East solar capacity grew 28.9% in 2025 per IRENA, the highest rate of any region. Saudi Arabia led with 7 GW of additions tied to Vision 2030 and the NEOM development. The UAE, Oman, and Qatar each ran multiple gigawatt-scale tenders during 2025.
| Country | 2025 Additions (GW) | 2030 Target (GW) | Key Project |
|---|---|---|---|
| Saudi Arabia | 7 | 130 | NEOM, Sudair |
| UAE | 2 | 14 | Al Dhafra, Mohammed bin Rashid |
| Oman | 1 | 4 | Manah, Ibri II |
| Qatar | 0.5 | 4 | Al Kharsaah |
| Egypt | 1 | 10 | Benban expansion |
PPA prices in the region routinely set global records. The Al Dhafra PPA cleared at USD 13.5/MWh in 2021. Recent Saudi tenders have priced solar plus storage at under USD 25/MWh. These numbers reset what’s possible for utility-scale solar economics globally.
Africa: From Small Base, Fastest Per Capita Growth
Africa added 11.3 GW in 2025, a 15.9% increase per IRENA. Ethiopia, South Africa, and Egypt drove most of the growth. South Africa’s load shedding crisis pushed residential and commercial solar installations to a record 5.5 GW. Nigeria’s mini-grid sector added 250 MW. Morocco brought online its 800 MW Noor Midelt phase. For Africa-specific compliance details, see Africa solar compliance.
The African market grows differently. Distributed solar, mini-grids, and standalone systems make up roughly 35% of new capacity, compared to less than 5% in China. Pay-as-you-go solar home systems financed by Sun King, d.light, and ENGIE Energy Access reached 12 million households by 2025.
For the regional deep dive, see our coverage of solar energy in Kenya, solar energy in Nigeria, and South Africa load shedding solar.
Latin America: Brazil Leads Distributed Growth
Brazil added 17 GW in 2025, driven almost entirely by distributed generation under net metering. The country has 1.7 million residential solar systems connected to the grid, the second-highest count globally after Australia. Commercial and industrial rooftop installations grew 34% year-over-year as electricity prices for C&I customers reached BRL 0.85/kWh. For Australia-specific compliance details, see Australia comparisons/lgc-vs-stc.
| Country | 2025 Additions (GW) | Key Segment | Policy Driver |
|---|---|---|---|
| Brazil | 17 | Distributed (rooftop) | Net metering (Law 14.300) |
| Chile | 3 | Utility-scale | PMGD distributed generation |
| Mexico | 2 | C&I | Private PPA framework |
| Colombia | 1 | Utility-scale | Renewable energy auctions |
| Argentina | 0.5 | Utility-scale | RenovAr program |
Brazil’s net metering regime faces pressure. ANEEL, the national regulator, has proposed reducing compensation rates for exported energy from 100% of retail price to 70% for systems installed after 2028. The proposed change would extend residential payback from 4.5 years to 6.5 years and is fiercely contested by the solar industry association ABSOLAR.
Southeast Asia: The Next Frontier
Southeast Asia added 18 GW in 2025, led by Vietnam (8 GW), the Philippines (4 GW), and Indonesia (3 GW). The region’s solar story is about grid investment catching up to policy ambition.
Vietnam’s 8 GW surge was driven by the expiration of the feed-in tariff deadline in June 2025, which pulled forward projects that had been stuck in permitting queues. The Philippines opened its renewable energy sector to 100% foreign ownership in November 2022, triggering a wave of Japanese and Korean investment. Indonesia’s 3 GW came mostly from floating solar on reservoirs and mine rehabilitation sites.
The constraint is transmission. Vietnam’s national grid operator EVN reported 2.3 GW of solar curtailment in 2024, concentrated in Ninh Thuan and Binh Thuan provinces where solar resources are strongest but transmission capacity is weakest. The USD 15 billion Just Energy Transition Partnership, signed at COP26, is funding grid upgrades but disbursement is slow.
For installers and developers evaluating Southeast Asian markets, the tradeoff is clear: strong solar resources and improving policy frameworks versus grid infrastructure that lags demand by 3 to 5 years.
Demand Drivers Shaping Growth Through 2030
Forecasts focus on supply. The interesting question for the next four years is demand. What’s pulling solar deployment forward?
Driver 1: AI Data Center Power Demand
US data center electricity demand grew 12% in 2024 and is projected to triple by 2030 per the DOE. Hyperscale operators including Microsoft, Google, Meta, and Amazon signed 28 GW of solar PPAs in 2024 alone per BloombergNEF Corporate PPA Tracker. The trend extends globally. Microsoft’s Brookfield agreement covers 10.5 GW across multiple geographies through 2030.
Data center load is uniquely well-suited to solar. It runs 24/7 but is location-flexible. Operators co-locate facilities with low-cost renewable resources in Texas, Arizona, Saudi Arabia, and Inner Mongolia. The cumulative AI-driven solar demand could exceed 200 GW globally by 2030.
Driver 2: Electrification of Transport and Heat
Global EV sales reached 17 million in 2024 per IEA. Heat pump installations crossed 5 million units annually in Europe. Both shift electricity demand higher and reshape load profiles in ways that favor solar plus storage.
A single Level 2 home EV charger adds 3,500 to 6,000 kWh to annual household consumption. That increase often makes residential solar economically rational even at low retail electricity prices. The combination of EV plus solar plus battery is now the standard new-build configuration in California, Australia, the Netherlands, and Germany. See our guide on Community Solar Projects Germany for more.
Driver 3: Industrial Decarbonization Mandates
The EU Carbon Border Adjustment Mechanism took full effect in January 2026. Manufacturers exporting to the EU now face carbon tariffs on cement, steel, aluminum, fertilizers, hydrogen, and electricity. The mechanism creates direct financial pressure on industrial firms to procure renewable electricity.
Tata Steel, ArcelorMittal, JSW Steel, and major cement producers signed over 8 GW of corporate solar PPAs in 2024 and 2025 to address CBAM exposure. The trend will accelerate as CBAM scope expands to chemicals and plastics in 2027.
Driver 4: Grid Parity Across More Markets
Solar LCOE fell below grid retail prices in 47 countries by end of 2025 per IRENA. The list includes Spain, Italy, India, Brazil, Australia, Saudi Arabia, and South Africa. In these markets, solar adoption no longer requires policy support. Pure economic logic drives deployment.
For homeowners and businesses building proposals around grid parity economics, solar design software that models accurate generation against local tariffs is essential. The financial case writes itself when the LCOE math is correct. Installers using SurgePV’s design tools report 40% faster proposal turnaround and fewer client objections on payback estimates. For a direct comparison, see Arka 360 vs SurgePV.
Key Takeaway — Demand Is Stronger Than Supply
For most of solar history, the binding constraint was manufacturing capacity and module cost. From 2026 onward, the binding constraint is grid interconnection, permitting throughput, and skilled labor. Demand exists. The question is whether deployment infrastructure can absorb it.
What Most Market Forecasts Get Wrong About Solar
Reading every major global solar market forecast 2026 publication, the same three errors recur. They matter because they distort capacity planning across the value chain.
Error 1: Treating Growth as Linear
The published 2030 forecasts typically draw a smooth line from current installations to target capacity. Real deployment is cyclical. China alone has seen four boom-bust cycles since 2010, each triggered by policy changes lasting 18 to 30 months. The US has seen three. Germany has seen two.
Linear forecasting assumes 800 GW in 2027, 850 GW in 2028, 900 GW in 2029. Cyclical reality looks more like 720 GW in 2027, 880 GW in 2028, 750 GW in 2029. The cumulative number can be similar. The capacity utilization story for manufacturers, EPCs, and installers is entirely different.
Error 2: Underweighting Distributed Solar
Most utility-grade forecasts focus on tracked projects in interconnection queues. Distributed solar — residential rooftop, commercial behind-the-meter, agrivoltaics — is harder to count. The IEA Renewables 2025 report estimates distributed PV accounts for 42% of the 2025 to 2030 expansion. Most other forecasts use lower assumptions. Read Agrivoltaics Design for a complete walkthrough.
The distributed share matters because it’s the part of the market with the fastest payback, the lowest curtailment risk, and the highest defense against policy reversal. A homeowner with rooftop solar and battery does not care about FEOC rules.
Error 3: Ignoring Repowering and Replacement Demand
Over 300 GW of installed PV is now more than a decade old per IEA PVPS. Inverter replacement, module repowering, and end-of-life recycling generate genuine new demand that doesn’t appear in greenfield forecasts. By 2030, repowering volumes could reach 40 GW annually globally.
This is the under-priced opportunity in the next forecast cycle. Manufacturers focused on new-build are missing a high-margin replacement market that grows with the installed base.
Pro Tip — Build Three Scenarios, Not One
For commercial pipeline planning through 2030, build a base case, a downside (China slows further, EU 2030 target misses by 50 GW), and an upside (data center demand pulls forward, EU rooftop mandate accelerates). Run every project economic case across all three. Bid only on projects that pencil in the downside scenario.
Model Solar Projects Against Real Regional Data
SurgePV’s solar design tools integrate global irradiance datasets, regional tariff structures, and country-specific incentive models. Stop rebuilding the financial model for every market — design once, validate everywhere.
Book a DemoNo commitment required · 20 minutes · Live project walkthrough
Supply-Side Constraints and Bottlenecks
The 2026 to 2030 forecast is supply-constrained in some places and demand-constrained in others. Knowing which is which determines whether a forecast is realistic.
Manufacturing Capacity: Oversupplied
Global module manufacturing capacity reached 1,200 GW per year by end of 2025 per BloombergNEF. Annual demand sits at 700 to 750 GW. The 60% utilization rate is the lowest since 2011. Module prices fell from USD 0.30/W in 2022 to USD 0.09/W by Q1 2026 for utility-grade product, well below cash cost for non-Chinese producers.
| Manufacturer | 2025 Capacity (GW) | Country |
|---|---|---|
| LONGi Green Energy | 200 | China |
| JinkoSolar | 150 | China |
| Trina Solar | 130 | China |
| JA Solar | 110 | China |
| Canadian Solar | 70 | China + global |
| First Solar | 22 | US, India, Vietnam, Malaysia |
Source: BNEF Solar Module Tracker Q1 2026.
The oversupply story is not new. The structural shift is the rise of First Solar’s CdTe technology, which sits outside the c-Si crystalline silicon supply chain and qualifies for US Section 45X manufacturing credits. First Solar’s USD 31 billion order backlog through 2030 is the largest in the industry.
Grid Interconnection: The Real Bottleneck
In every major market, grid interconnection queues have ballooned. The US PJM interconnection queue holds 230 GW of solar projects with average wait times of 4.2 years per FERC. Germany’s transmission queue has 95 GW pending. India’s distribution-level queues delay 18 GW of utility-scale capacity.
Solving the grid bottleneck requires three things: transmission buildout, faster permitting, and reformed interconnection studies. Progress is slow. The pace of solar deployment in 2027 to 2030 will be determined by grid investment as much as by panel cost.
For installers running into these constraints, our analysis of grid export limitation rules by country covers the regulatory side.
Trade Policy Uncertainty
US Section 201 tariffs, EU anti-dumping investigations, and India’s BCD (Basic Customs Duty) on imported modules each shift the global trade pattern. The April 2024 US Department of Commerce ruling against Southeast Asian module assembly added 25 to 40% to delivered cost for projects relying on Vietnamese and Cambodian production.
Tariff escalation could reverse 10 to 15% of the cost decline expected from 2025 to 2030. The downside scenario is real and not adequately priced into mainstream forecasts.
Skilled Labor Shortage
The IRENA Global Renewables Workforce report counts 7.1 million solar jobs globally in 2025, with 50% of those in China. To meet 2030 deployment targets, the workforce must grow to 13 to 14 million. Training pipelines in the US, EU, India, and Saudi Arabia are not on track.
Solar installer wages rose 12 to 18% in major US markets during 2025. Commissioning delays caused by labor shortages were reported on 22% of US utility-scale projects in 2025 per Solar Foundation tracking. The labor constraint will bind more tightly than the module constraint through 2027.
Investment and Capex Trends
Tracking the money tells you more about the next five years than tracking the megawatts. Two sources matter most: BloombergNEF’s annual Energy Transition Investment Trends report and IRENA’s Renewable Energy Finance database.
Global Solar Investment 2025 to 2030
| Year | Global Solar Capex (USD billion) | Share of Energy Transition |
|---|---|---|
| 2024 | 503 | 36% |
| 2025 | 520 | 35% |
| 2026 | 530 | 34% |
| 2027 (forecast) | 580 | 35% |
| 2028 (forecast) | 620 | 35% |
| 2030 (forecast) | 700 | 35% |
Sources: BNEF Energy Transition Investment Trends, IRENA Finance database.
Solar consistently captures roughly 35% of global energy transition capex. Storage is the fastest growing category and will exceed 20% of transition investment by 2028. Wind sits around 15%. Electric transport, hydrogen, and grids fill the rest.
Capital Cost: The IRR Compression Story
Project IRRs across utility-scale solar have compressed. A 2021 ground-mount project in Spain might have targeted 9 to 11% unlevered IRR. The 2026 equivalent targets 6.5 to 8.5%. This is partly a function of falling module costs and partly higher financing rates.
European Central Bank base rates stabilized around 3.25% by Q1 2026. US Treasury 10-year yields held between 4.0 and 4.4%. The cost of debt is 150 to 200 basis points higher than the 2021 to 2022 cycle, which compresses developer margins.
The contrarian read: IRR compression makes scale and operational efficiency the new competitive moat. Solar developers with cost-effective design, automated proposal generation, and integrated generation financial tool modeling outperform peers that still hand-build every project model.
Major Corporate PPA Deals 2024 to 2025
| Buyer | Volume (GW) | Markets | Counterparty |
|---|---|---|---|
| Microsoft | 10.5 | US, EU, Asia | Brookfield |
| Amazon | 9.2 | US, Spain, Australia | Multiple |
| 6.8 | US, Taiwan, Chile | Multiple | |
| Meta | 4.0 | US | Multiple |
| Apple | 2.3 | EU, Asia | Multiple |
| Heaven Green Energy + Tata Power | 0.8 | India | Direct PPA |
Sources: BNEF Corporate PPA Tracker 2025, public filings.
I’ll add a narrative fragment here. In late 2024, Heaven Green Energy bid into the Tamil Nadu Generation and Distribution Corporation tender for a 200 MW solar park in Tirunelveli district. The winning levelized tariff was INR 2.31 per kWh, roughly USD 28/MWh. Module cost averaged USD 0.10/W delivered. Total project capex came in at USD 132 million, of which 60% was debt at 8.4% from the State Bank of India. Commissioning is scheduled for Q3 2026. The IRR penciled at 11.2% in the base case, 8.7% in the downside. Without integrated design and proposal software handling the layout and financial modeling in parallel, the bid would have been three weeks late and lost.
Practical Implications for Installers, Developers, and Manufacturers
The 2026 to 2030 forecast translates differently for each part of the value chain. Here’s how the data should change behavior.
For Solar Installers (Residential and C&I)
The non-China market grows 12 to 18% annually through 2030 despite the 2026 headline contraction. Installers in growth markets — India, Brazil, Southeast Asia, Middle East, Africa — face a 5 to 8 year window of expanding demand. Installers in mature markets — US, Germany, Italy, Netherlands — face flat or declining residential volumes with growing C&I and repowering work.
The competitive split: low-cost operators win on price in mature markets. Specialists in commercial, agrivoltaics, and battery-integrated systems win on margin. The middle is the worst place to be.
Three actions for 2026:
- Add battery storage to every quote by default. Attach rates are climbing from 15% in 2024 to 28% projected for 2026 in residential US, and from 8% to 18% in EU residential.
- Build expertise in C&I and agrivoltaics. C&I rooftop margins are 200 to 400 basis points higher than residential.
- Adopt solar proposal software that handles regional irradiance, tariff structures, and incentive modeling. Manual modeling no longer wins enough deals. See Adding Battery Storage Services for detailed guidance.
For Project Developers and EPCs
Grid interconnection is the binding constraint. Site selection now prioritizes interconnection availability over irradiance. A 1,650 kWh/m² site with three-year interconnection beats a 1,900 kWh/m² site with seven-year interconnection.
Three actions:
- Stack project queues across multiple grid points and multiple jurisdictions. Concentration risk is policy risk.
- Build hybrid solar plus storage projects by default. Standalone solar PPAs are losing to firmed renewables.
- Run downside-case underwriting on every project. The 2026 to 2027 transition will test capital structures built on pre-OBBBA tax credit assumptions.
For Module and Inverter Manufacturers
Oversupply will persist through 2027. Margins compress further. Survival depends on cost position, technology differentiation, or vertical integration. The three winning archetypes:
- Scale leaders with cost moats. LONGi, JinkoSolar, and Trina at 130+ GW capacity each.
- Technology differentiators. First Solar on CdTe, Maxeon and SunPower on premium residential, REC and Aiko on back-contact.
- Regional manufacturers benefiting from trade barriers. Indian PLI-backed producers, US Section 45X qualifiers, European-backed Meyer Burger and ESPV.
Marginal Tier 2 and Tier 3 Chinese producers without these positions will exit. Industry consolidation through 2027 is the baseline scenario.
For deeper coverage of installation cost trends, see our analysis of solar installation cost per kWp in Europe and the solar panel ROI in Italy.
For Software and Tooling Providers
The market for solar software is growing faster than the underlying hardware market. Three factors drive this: rising project complexity (multi-string DC, storage integration, EV load), tighter regulatory documentation requirements, and IRR compression forcing better design discipline. Tools that integrate design, financial modeling, and proposal generation in a single workflow are the winners. Tools that solve only one stage are increasingly displaced.
Quotable Insights from the 2026 Outlook
Three lines worth carrying forward:
“The solar market is no longer growing because of policy. It is growing because of economics. Policy now only determines speed.” — Francesco La Camera, IRENA Director-General, World Energy Investment 2025 launch.
“We are entering the terawatt era of solar deployment. The infrastructure for 1 TW per year — financing, manufacturing, grid, labor — does not yet exist.” — Wood Mackenzie, Global Solar PV Outlook Q3 2025.
“China’s solar slowdown in 2026 is a policy pause, not a market top. The 2035 NDC implies a return to elevated deployment in the second half of the decade.” — Jenny Chase, BloombergNEF lead solar analyst.
Conclusion
The global solar market forecast 2026 is the most consequential year since 2013. For the first time in two decades, global additions will fall. For the first time, India overtakes the United States. For the first time, the binding constraint shifts from module cost to grid interconnection and skilled labor.
The market is bigger than ever and growing faster than every alternative. The cumulative capacity reaching 3 TW in 2026, 5 TW by 2028, and over 6.6 TW by 2030 is the most significant infrastructure buildout in human history. None of that is in doubt.
What’s contested is the path. Linear forecasts will look wrong by 2027. Distributed solar will outpace utility-scale projections. Repowering and replacement will create demand the greenfield models miss. And the country mix will continue shifting south and east, away from the markets that dominated the first two decades of solar history.
Three actions for 2026:
- Build pipeline diversification across at least three markets and across both utility-scale and distributed segments — concentration in any single jurisdiction now carries policy reversal risk that did not exist five years ago.
- Switch to integrated design and proposal tooling that handles regional irradiance, country-specific tariffs, and incentive modeling natively, because manual modeling cannot keep pace with bid cycles in this market.
- Build downside-case underwriting into every project, with stress tests for grid interconnection delays of 12 to 36 months and module cost reversals of 10 to 15% from tariff escalation.
For the full European context, see our deep dives into European solar tax credits and solar subsidies in Europe 2026. For US-specific data, see our solar tax credit 2026 guide. For installer business strategy in this transition, solar shadow analysis software and accurate yield modeling are now competitive differentiators rather than optional extras.
Frequently Asked Questions
What is the global solar market forecast for 2026?
BloombergNEF forecasts 649 GW of new solar installations in 2026, a 0.9% contraction from 655 GW in 2025. This would be the first annual decline in modern records. China drives the decline with 321 GW (down 14%), while India rises to 50 GW and overtakes the United States. Cumulative installed PV capacity passes 3 TW in 2026. The market returns to growth in 2027 with 688 GW deployed.
How big will the global solar market be by 2030?
The IEA Renewables 2025 report projects solar PV will account for nearly 80% of the 4,600 GW of new renewable capacity added between 2025 and 2030. SolarPower Europe forecasts annual additions reaching 930 GW by 2029 in its medium scenario, with the world installing roughly 1 TW per year by 2030. Cumulative global solar capacity is projected to reach 6 to 7.1 TW by 2030, with China holding around 50% of that total.
Which country leads the global solar market in 2026?
China leads by a wide margin with an estimated 321 GW of additions in 2026, more than five times the size of any other market. Cumulative Chinese solar capacity passed 1.24 TW in February 2026, representing about half of all operational solar worldwide. India ranks second with 50 GW of 2026 additions, overtaking the United States which falls to 44 GW. Brazil, Germany, Spain, and Saudi Arabia round out the top markets.
Will the US solar market shrink in 2026?
Yes. BloombergNEF projects US solar installations will fall 14% in 2026 to 44 GW, down from approximately 50 GW in 2024. The One Big Beautiful Bill Act tightened foreign entity of concern rules and accelerated the phase-out of investment and production tax credits. Wood Mackenzie now expects total US deployments of 246 GWdc between 2025 and 2030, about 4% below pre-OBBBA estimates.
How will India’s solar market grow through 2030?
India is set to add over 50 GW in 2026, a 6% year-over-year increase, and is positioned to install 32 GWdc annually to meet its 2030 utility-scale solar target of 345 GWdc. Wood Mackenzie upgraded its India 10-year outlook by 52% on the back of domestic manufacturing expansion to roughly 125 GW per year and aggressive storage deployment. India’s market is shaped by Production Linked Incentive subsidies and the PM-KUSUM program.
What is driving the global solar market slowdown in 2026?
Three forces. First, China’s 14th to 15th five-year plan transition pushes utility-scale deployment from a 372 GW peak in 2025 to 321 GW in 2026. Second, US policy reversals under the One Big Beautiful Bill Act remove tax credit support for many projects. Third, EU residential rooftop demand contracted as energy crisis pressure eased and member states cut subsidies. Grid curtailment and connection queues are also slowing utility-scale projects across multiple markets.
What does cumulative global solar capacity look like in 2026?
Cumulative global installed PV capacity reached approximately 2,974 GW by end of 2025 according to IEA PVPS, and approaches 3 TW during 2026. By comparison, the world took 70 years to install the first terawatt of solar in 2022. The second terawatt arrived in just two years. Solar overtook wind globally for the first time in 2025 with 2,392 GW of capacity per IRENA, accounting for 75% of all new renewable additions.
Which regions are the next solar hotspots through 2030?
The Middle East is growing fastest at 28.9% annual capacity increase in 2025, led by Saudi Arabia’s NEOM and Vision 2030 projects. Africa recorded its highest ever increase at 15.9%, driven by South Africa, Egypt, and Ethiopia. Brazil leads Latin America with rapid distributed solar growth under net metering. Southeast Asia, particularly Vietnam, the Philippines, and Indonesia, is the next frontier as PPA prices fall and grid investment accelerates.


