Quick Answer
Solar installation costs in Europe range from €1,100–€1,800/kWp for residential systems and €900–€1,400/kWp for commercial. Germany averages €1,400–€1,600/kWp, Italy €1,100–€1,500/kWp, France €1,300–€1,700/kWp, and Spain €1,400–€1,800/kWp. Commercial systems cost 15–25% less per kWp due to scale.
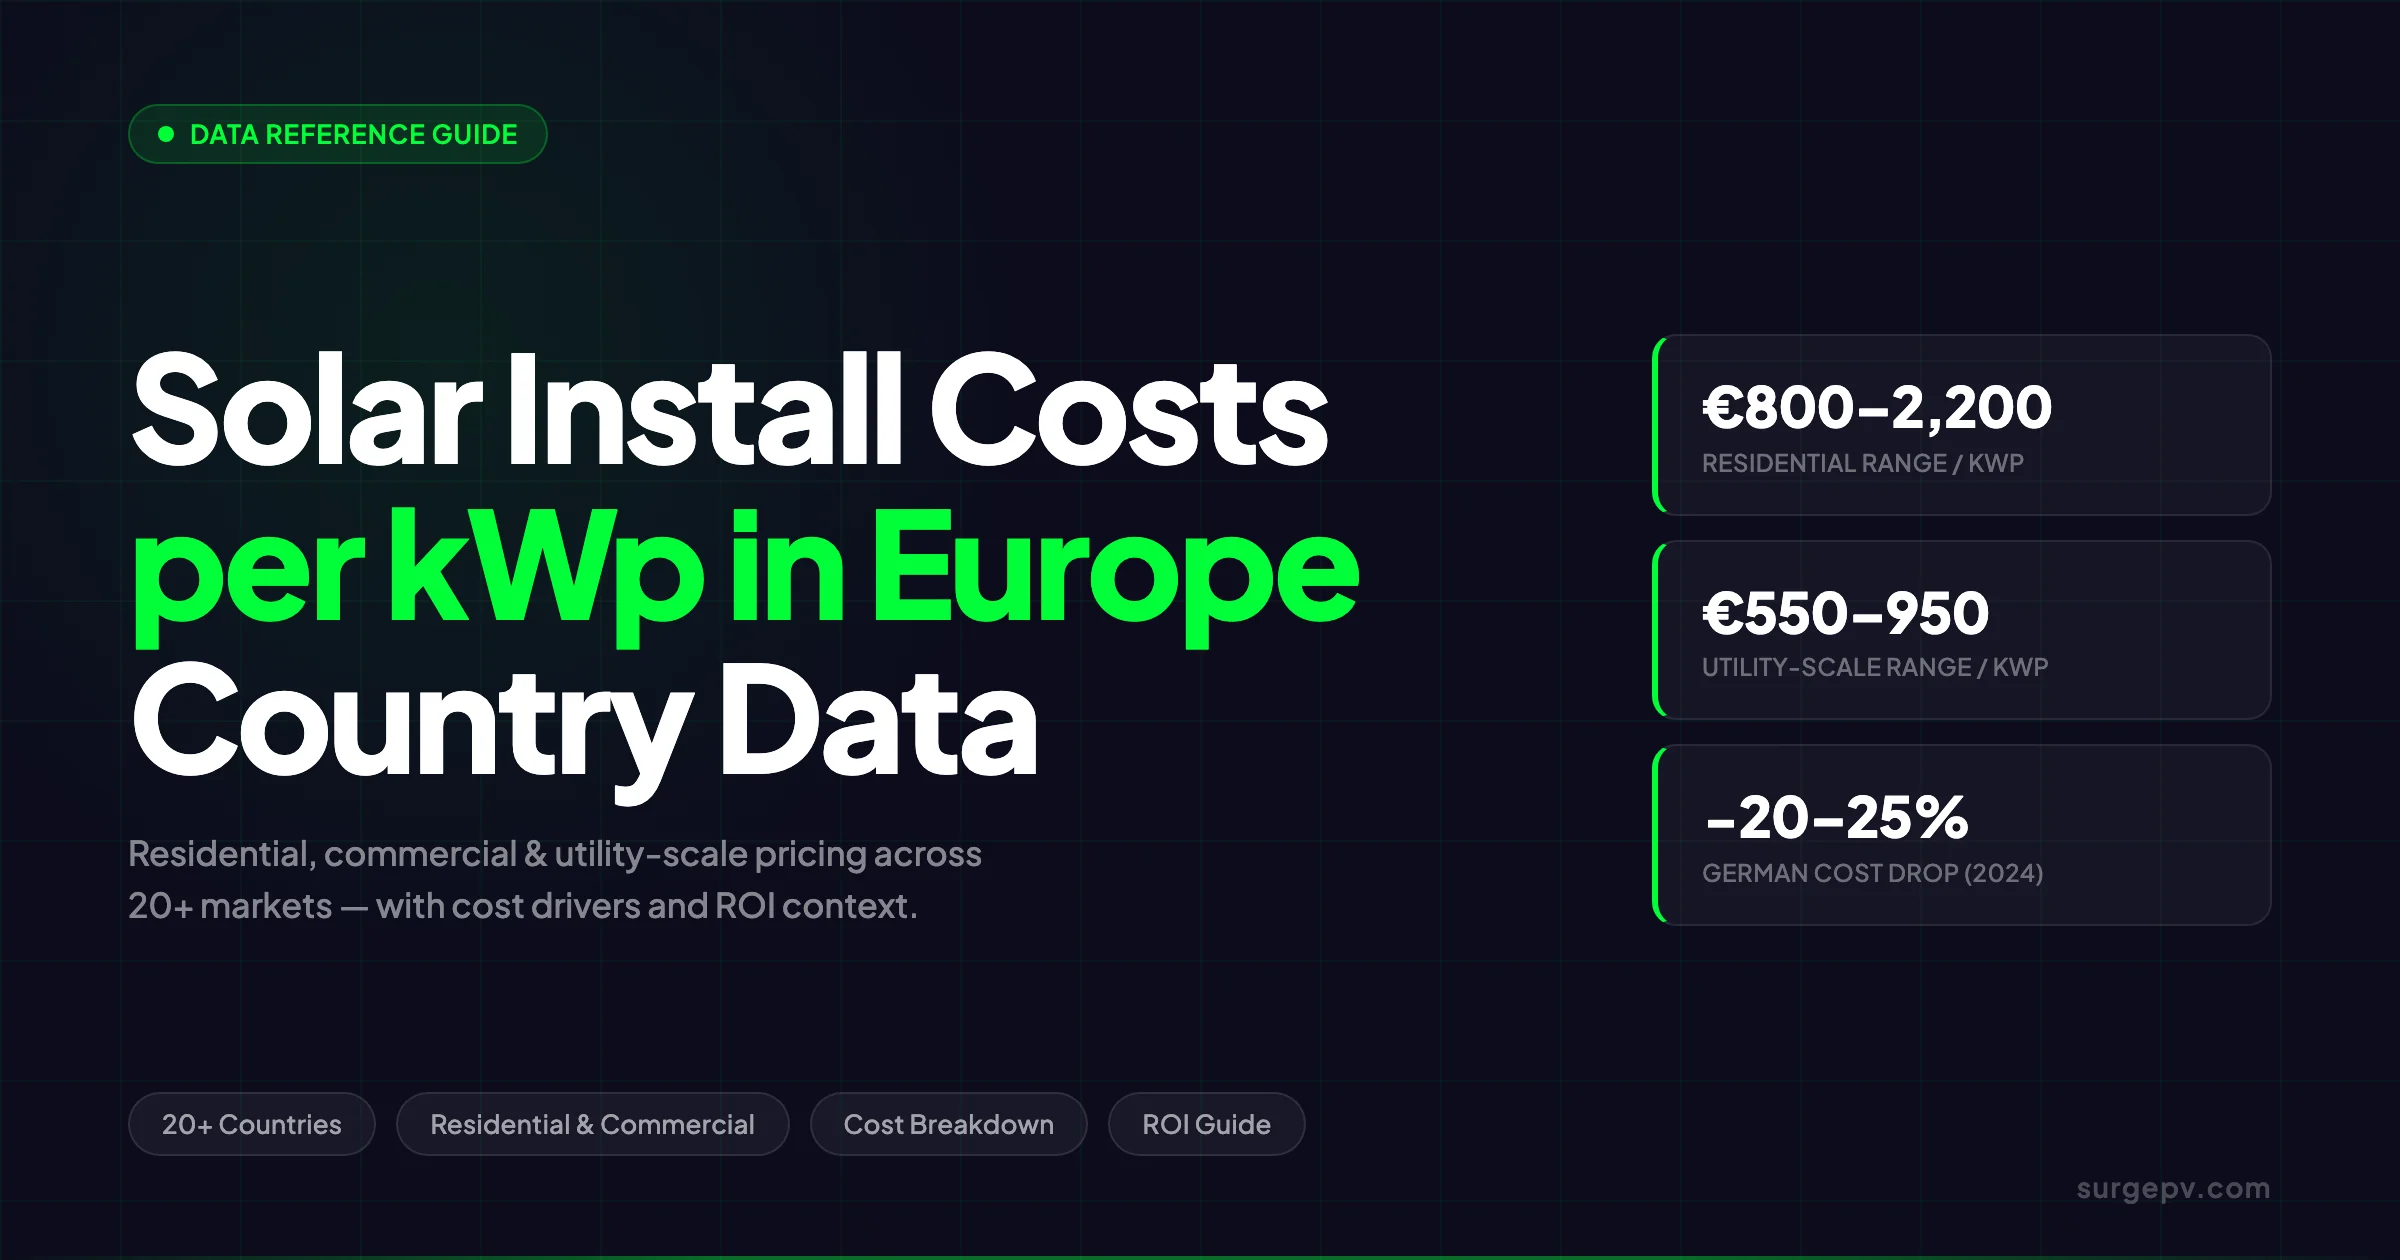
Installed solar costs across Europe span from €800 per kWp in Romania to more than €2,300 per kWp in Luxembourg — a gap of nearly 3x between the cheapest and most expensive markets. That spread is not random. It reflects differences in certified labour rates, VAT policies, grid connection procedures, and the depth of each country’s installer ecosystem. For solar companies quoting projects, procurement teams allocating capital, or investors comparing markets, the cost per kilowatt-peak is the only metric that makes different-sized systems across different countries directly comparable. This guide compiles 2026 data across 20+ European countries for residential, commercial, and utility-scale systems — with specific price ranges, cost drivers, and payback implications for each market.
Solar installation costs in Europe range from €1,100–€1,800/kWp for residential systems and €900–€1,400/kWp for commercial. Germany averages €1,400–€1,600/kWp, Italy €1,100–€1,500/kWp, France €1,300–€1,700/kWp, and Spain €1,400–€1,800/kWp. Commercial systems cost 15–25% less per kWp due to scale. Also see: solar panel ROI in Italy. Also see: Germany solar subsidies. Also see: France solar feed-in tariffs. Also see: Spain net metering.
TL;DR — European Solar Costs per kWp
Residential systems cost €800–€2,300 per kWp depending on country. Eastern Europe is cheapest (€800–€1,300), Northern Europe is most expensive (€1,200–€2,200). Commercial systems run 25–35% lower, and utility-scale falls to €550–€950. Germany saw a 20–25% price drop in 2024. Labour accounts for 20–30% of installed cost in most markets.
What this guide covers:
- Country-level residential, commercial, and utility-scale cost data for 20+ European markets
- The five cost drivers that explain why prices vary by country
- How system size affects cost per kWp — from 5 kWp to 10 MWp
- A full cost-component breakdown (modules, inverter, labour, balance of system, grid connection)
- How installation costs feed directly into payback period and IRR calculations
For teams modeling European project economics at scale, solar design software with country-specific cost databases and automated payback calculations removes manual lookup work. Use SurgePV’s solar cost calculator alongside the design platform — book a demo to see multi-country modeling in one workflow.
European Solar Installation Costs at a Glance
The table below summarises current installed costs per kWp across major European markets, segmented by system type. Data reflects full turnkey installation including panels, inverter, mounting, cabling, commissioning, and grid connection. Battery storage, monitoring systems, and structural roof reinforcements are not included in these figures unless noted. See Adding Battery Storage Services for detailed guidance.
| Country | Residential (€/kWp) | Commercial (€/kWp) | Utility-Scale (€/kWp) |
|---|---|---|---|
| Germany | 1,200–1,800 | 800–1,200 | 650–850 |
| France | 1,500–2,200 | 900–1,300 | 750–950 |
| Netherlands | 1,100–1,500 | 850–1,050 | 700–900 |
| Belgium | 1,150–1,550 | 840–1,040 | 740–890 |
| Austria | 1,200–1,600 | 820–1,020 | 720–870 |
| Switzerland | 1,700–2,400 | 1,100–1,500 | 900–1,200 |
| Luxembourg | 2,100–2,300 | 1,200–1,600 | — |
| Spain | 1,100–1,600 | 700–1,100 | 550–750 |
| Italy | 1,300–1,800 | 850–1,300 | 650–900 |
| Portugal | 1,000–1,400 | 680–880 | 580–720 |
| Greece | 1,050–1,450 | 720–920 | 600–780 |
| Poland | 900–1,300 | 700–900 | 580–750 |
| Czech Republic | 900–1,300 | 720–950 | 590–780 |
| Hungary | 850–1,200 | 680–900 | 560–750 |
| Romania | 800–1,200 | 650–870 | 530–720 |
| Slovakia | 850–1,200 | 690–900 | 550–730 |
| Sweden | 1,400–2,000 | 950–1,300 | 700–950 |
| Denmark | 1,500–2,100 | 1,000–1,400 | 750–980 |
| Norway | 1,600–2,200 | 1,050–1,450 | — |
| Finland | 1,200–1,900 | 850–1,200 | 650–880 |
| United Kingdom | £1,300–£1,900 | £800–£1,100 | £600–£850 |
Sources: Solar Data Atlas CAPEX 2025–2026, Fraunhofer ISE Photovoltaics Report 2025, LonGi European Cost Guide 2025, MCS installer data (UK). See our guide on Battery Solar System Design UK for more.
What Is Included in the Cost per kWp?
Unless noted otherwise, all figures in this guide cover the full installed cost: solar panels, inverter (string or micro), mounting system, DC and AC cables, grid connection, commissioning, and installation labour. Battery storage, monitoring systems, EV charger integration, and structural roof reinforcements are not included.
2026 Solar Market Trends Affecting Installation Costs
Three structural shifts are reshaping European solar installation costs in 2026 — and understanding them matters when using historical benchmarks to price current projects.
Module prices stabilised after the 2024 crash. Following an unprecedented decline, mainstream module prices bottomed out at €0.10–0.12/Wp in late 2024 and have since stabilised at €0.115–0.145/Wp. The era of steep year-on-year module cost reductions is pausing; future installed cost reductions will need to come from labour efficiency and process improvements rather than hardware deflation.
Labour costs are rising across Western Europe. Wage inflation of 4–7% per year in Germany, Netherlands, France, and the UK has offset a portion of the hardware savings from cheaper modules. This explains why installed residential costs in Western Europe did not fall as sharply as module prices. Installers who have not invested in workflow standardisation are seeing their margins compress. For France-specific information, see Agricultural Solar Case Study.
Grid connection timelines are lengthening in high-demand markets. As Germany, the Netherlands, and Belgium experience grid congestion at the distribution level, connection approvals for commercial systems above 30 kWp are taking longer and sometimes requiring costly grid reinforcement contributions. In some Dutch and Belgian municipalities, connection approval has been effectively paused for new commercial solar above 100 kWp. This does not change the per-kWp hardware cost, but adds weeks or months of project overhead — and overhead has a cost.
Eastern European markets are maturing fast. Poland, Czech Republic, and Romania are producing increasingly professional installer cohorts, with multi-country EPC firms entering these markets and driving down per-project overhead. The cost gap between Eastern and Western Europe has narrowed slightly as Eastern labour rates rise, but Eastern markets remain 30–40% cheaper on a per-kWp basis.
For the full European incentive and subsidy landscape, see European Solar Incentives and Solar Subsidies Europe 2026 Tracker.
Battery Storage: What It Adds to the Total
Battery storage is increasingly common alongside solar installations — particularly in residential markets and commercial sites with high self-consumption requirements. It is not included in the per-kWp figures in the table above, but buyers need to know what it adds to the project total.
EU residential battery storage costs between €112 and €285 per kilowatt-hour (kWh) in 2026, depending on chemistry (LFP vs NMC), brand, system size, and whether installation labour is included. For a typical 10 kWh residential battery:
| Region | Battery Cost (installed) | Per kWh |
|---|---|---|
| Germany / Austria / Netherlands | €1,400–€2,500 | €140–€250 |
| France / Belgium | €1,600–€2,800 | €160–€280 |
| Spain / Portugal / Italy | €1,200–€2,200 | €120–€220 |
| Poland / Czech Republic | €1,000–€1,800 | €100–€180 |
| Sweden / Norway / Denmark | €1,600–€3,000 | €160–€300 |
Adding a 10 kWh battery to a 10 kWp residential system increases total project cost by €1,000–€3,000 depending on country — which adds approximately 1–2 years to the payback period but significantly increases the self-consumption rate and insulates the household from grid price volatility.
Western Europe: Cost Data by Country
Germany
Germany is one of Europe’s most mature solar markets — and after a sharp cost correction in 2024, one of its most competitive. End-consumer prices for residential systems fell 20–25% within a single year as Chinese module prices dropped and the installer base consolidated around more efficient workflows.
A typical 6–10 kWp residential rooftop system now costs €1,200–€1,800 per kWp. Systems in the 10–100 kWp commercial range often come in below €1,260 per kWp, per Fraunhofer ISE’s 2025 Photovoltaics Report. Utility-scale projects fall to €650–€850 per kWp, driven by competitive EPC tendering and a deep local supply chain.
Key factors:
- Grid connection: Standardised process, costs typically €500–€2,000 depending on local grid capacity
- VAT: 0% on solar equipment since 2023 — a significant demand driver
- Labour: €45–€65/hour for certified electricians
- Permitting: Simplified for rooftop systems; ground-mount requires planning approval
Payback context: With residential electricity prices around €0.30–€0.38/kWh and strong self-consumption rates, payback periods in Germany currently sit at 8–12 years for residential systems.
France
France is Western Europe’s most expensive residential solar market in 2026, with turnkey costs ranging from €1,500–€2,200 per kWp. The premium reflects mandatory CONSUEL electrical certification before commissioning, complex bureaucratic processes for grid connection through Enedis, and a fragmented installer market outside major urban centres.
Commercial systems (30–500 kWp) cost €900–€1,300 per kWp. Utility-scale projects — particularly in the Mediterranean south — sit at €750–€950 per kWp where EPC competition is strongest.
Key factors:
- CONSUEL certification adds €300–€800 per installation
- Enedis grid connection process can take 2–6 months for residential systems
- Labour: €50–€70/hour for certified electricians
- VAT: 5.5–20% depending on system size and installation type
Pro Tip for French Projects
French grid connection timelines are the single biggest factor in project scheduling. Build 3–6 months of Enedis lead time into any residential or commercial project plan, and verify local grid capacity at the outset before finalising system size.
Netherlands
The Netherlands has a competitive residential solar market at €1,100–€1,500 per kWp, supported by a strong installer base and historically high electricity prices that make projects financially attractive. Flat commercial roof infrastructure also reduces mounting complexity for commercial installations.
Commercial systems run €850–€1,050 per kWp. The Dutch government’s phase-out of net metering by 2031 has pushed some buyers toward self-consumption-optimised systems with battery storage, which adds to average project costs but does not change the base installation cost per kWp.
Key factors:
- Flat roofs dominate Dutch commercial stock, reducing mounting cost and complexity
- Labour: €45–€60/hour
- VAT: 21% on solar equipment (higher than Germany and UK)
- Net metering phase-out creating planning complexity for new projects
Belgium
Belgium’s residential solar market costs €1,150–€1,550 per kWp, with notable variation between Flanders, Wallonia, and Brussels due to different regional subsidy schemes and grid operator requirements. The Flanders prosumer tariff structure means battery storage is routinely evaluated alongside the base installation.
Commercial systems cost €840–€1,040 per kWp; utility-scale projects in Belgium sit at €740–€890 per kWp.
Austria
Austria’s residential costs of €1,200–€1,600 per kWp are in line with Germany, reflecting similar labour rates and proximity to the same supply chains. The Erneuerbaren-Ausbau-Gesetz (EAG) framework has driven significant residential rooftop growth since 2022. Commercial systems come in at €820–€1,020 per kWp, and utility-scale ground-mount at €720–€870 per kWp.
Switzerland
Switzerland is the most expensive market in continental Europe, with residential costs of €1,700–€2,400 per kWp. High certified labour wages (CHF 80–100/hour), strict cantonal building regulations, and mandatory roof penetration permits all contribute. Switzerland is not in the EU, adding import logistics overhead for Chinese modules.
That said, Swiss electricity prices reach CHF 0.35–0.50/kWh for residential consumers — among Europe’s highest — meaning high installation costs still produce competitive payback periods in the 9–14-year range.
Luxembourg
Luxembourg consistently records the highest cost per kWp in Europe for residential systems, at €2,100–€2,300 per kWp according to Luxembourg’s official Renov’ subsidy platform. A small installer market with limited competition and very high labour costs are the primary drivers. The government subsidises up to €500/kWp to offset this for eligible homeowners.
Southern Europe: Cost Data by Country
Southern Europe is the most cost-competitive region for solar in Europe. Lower certified labour rates, mature installer networks, high solar irradiance, and streamlined permitting in most markets make this region attractive for both residential and utility-scale deployment.
Spain
Spain offers some of Europe’s most competitive residential pricing at €1,100–€1,600 per kWp for systems in the 4–15 kWp range. Commercial systems drop to €700–€1,100 per kWp, and Spain’s utility-scale market regularly reaches €550–€750 per kWp — the cheapest in Western Europe.
Spain reached 30+ GW of cumulative installed capacity in 2025, and the depth of the installer market produces strong price competition, particularly in Andalusia, Catalonia, and Castilla-La Mancha.
Key factors:
- Labour: €25–€40/hour for certified solar installers
- Permitting: Simplified “autoconsumo” registration for systems under 100 kW
- VAT: 10% on solar panels and installation (reduced from standard 21%)
- Grid connection: Automated registration for self-consumption systems below 15 kW
Italy
Italy’s residential costs of €1,300–€1,800 per kWp reflect a post-Superbonus market correction. More complex permitting requirements — particularly SUAP approvals in certain municipalities — add cost relative to Spain. The end of the 110% Superbonus in 2024 has normalised pricing after years of distorted demand. See our guide on Commercial Rooftop Solar Case Study Italy for more.
Commercial systems cost €850–€1,300 per kWp; utility-scale ground-mount sits at €650–€900 per kWp in most regions.
For deeper context on Italian solar economics, see Solar Panel ROI in Italy.
Italy Post-Superbonus Adjustment
The end of the 110% Superbonus tax incentive in 2024 removed a major demand driver for Italian residential solar. Installer volumes dropped, which has modestly increased per-project overhead even as module prices fell. Italian residential costs are likely to decline further as market volumes recover under the Transizione 5.0 incentive scheme.
Portugal
Portugal offers the most competitive pricing in Southern Europe at €1,000–€1,400 per kWp for residential systems. Lower labour rates relative to Spain (€20–€35/hour), a streamlined grid registration process through E-Redes, and a growing installer base all contribute.
Utility-scale costs of €580–€720 per kWp make Portugal one of Europe’s cheapest utility-scale markets, attracting significant international capital. The combination of low CAPEX and high irradiance produces some of the best project LCOE numbers on the continent.
Greece
Greece’s residential market costs €1,050–€1,450 per kWp. The market accelerated after RES Law 4685/2020 simplified licensing for self-consumption systems, and the net metering framework — including virtual net metering for properties without suitable rooftops — has broadened the addressable customer base.
Commercial costs sit at €720–€920 per kWp; utility-scale at €600–€780 per kWp, with the Peloponnese, Crete, and the Aegean islands offering the strongest irradiance for utility projects.
Eastern Europe: Cost Data by Country
Eastern Europe is Europe’s lowest-cost region for solar installation. Lower certified labour wages, competitive local installer markets, and growing module import infrastructure have compressed residential costs to €800–€1,300 per kWp — well below Western European equivalents.
Poland
Poland is Central Europe’s largest solar market by installed capacity and has one of the continent’s most competitive installer ecosystems. Residential systems cost €900–€1,300 per kWp in 2026.
The Mój Prąd subsidy programme (now in its sixth iteration) has sustained residential demand, and commercial rooftop solar in the 50–999 kWp range is growing rapidly among industrial offtakers. Commercial systems cost €700–€900 per kWp; utility-scale falls to €580–€750 per kWp.
Key factors:
- Labour: €15–€25/hour for certified installers
- VAT: 8% on residential solar installations
- Permitting: Simplified under the “prosumer” regulatory framework
- Grid connection: Generally 1–3 months for residential; 6–18 months for commercial above 50 kW
For details on Polish solar policy and subsidies, see Solar Subsidies: Europe 2026 Tracker.
Czech Republic
The Czech Republic’s residential market costs €900–€1,300 per kWp — equivalent to Poland — with a recovering market following regulatory instability in the early 2020s. The New Green Savings programme (Nová Zelená Úsporám) has driven residential demand, and commercial solar is growing quickly among industrial energy consumers.
Commercial systems cost €720–€950 per kWp. Utility-scale ground-mount sits at €590–€780 per kWp.
Hungary
Hungary offers competitive residential installation at €850–€1,200 per kWp, with labour costs among the EU’s lowest for certified solar installers (€12–€20/hour). Net metering policy changes in 2023 — moving from physical to virtual net metering — reduced the payback attractiveness of some residential configurations, but commercial and industrial solar continues to grow.
Romania
Romania is Europe’s cheapest market for residential solar installation at €800–€1,200 per kWp. This reflects very low labour costs (among the lowest in the EU), a rapidly growing installer base, and the government’s Fotovoltaice pentru Romania subsidy programme, which drove substantial market expansion from 2022 onward.
Commercial systems cost €650–€870 per kWp; utility-scale falls to €530–€720 per kWp — making Romania one of Europe’s most competitive utility-scale markets alongside Spain and Portugal.
Slovakia
Slovakia’s market closely mirrors the Czech Republic, with residential costs of €850–€1,200 per kWp and commercial systems at €690–€900 per kWp. The installer market is smaller, which limits competition in some regions, but cross-border access to Czech installers and suppliers keeps costs competitive.
Northern Europe and the UK: Cost Data by Country
Northern Europe is Europe’s most expensive solar installation region. High certified labour wages, stricter building codes, shorter installation seasons, and more complex structural requirements on steeply pitched roofs all contribute to elevated per-kWp costs.
Sweden
Sweden’s residential costs of €1,400–€2,000 per kWp reflect high labour wages and mandatory certification requirements for electrical installation work — only licensed elektriker can perform grid connections. The market has grown substantially since the introduction of the solcellsstöd subsidy (a 20% tax reduction on installation costs under the Rot-avdraget scheme), but absolute costs remain higher than southern and eastern markets.
Commercial systems cost €950–€1,300 per kWp; utility-scale ground-mount sits at €700–€950 per kWp, driven by the Electricity Certificates system.
Denmark
Denmark has the highest residential solar costs among the Nordic countries at €1,500–€2,100 per kWp. Very high wages for certified electricians (DKK 350–500/hour), complex low-voltage grid connection requirements administered by local DSOs, and Denmark’s predominantly commercial-scale solar market all push costs upward.
Denmark’s electricity prices are among Europe’s highest, so even expensive installations yield competitive payback periods — often 10–14 years for residential, and 7–10 years for commercial systems.
Norway
Norway is Europe’s most expensive market for solar installation at €1,600–€2,200 per kWp for residential systems. Very high labour costs (NOK 400–600/hour for certified electricians), non-EU module import logistics, and the country’s largely hydropower-based grid — which produces low residential electricity prices — create challenging economics for solar.
Norway does not offer residential solar subsidies at the national level. Utility-scale solar is at an early stage; the figures above reflect small-scale commercial and ground-mount installations rather than large-scale projects.
Finland
Finland’s residential costs of €1,200–€1,900 per kWp sit below the other Nordic markets, reflecting a growing installer base that has developed quickly since 2020. A typical 5–8 kWp Finnish residential system costs €6,000–€13,000 installed, including 24% VAT. Commercial solar (30–500 kWp) costs €850–€1,200 per kWp; utility-scale in southern Finland sits at €650–€880 per kWp.
United Kingdom
UK residential installation costs sit at £1,300–£1,900 per kWp in 2026, with the national average around £1,565 per kWp for a domestic system based on Microgeneration Certification Scheme (MCS) data. At current exchange rates, this is approximately €1,500–€2,200 — placing the UK broadly in line with France.
Key factors:
- MCS certification is mandatory for grid connection eligibility
- Smart Export Guarantee (SEG) requires MCS-registered installers
- Labour: £35–£55/hour for MCS-certified installers
- VAT: 0% on domestic solar installations under the Energy Saving Materials relief (since April 2022)
Commercial UK systems cost £800–£1,100 per kWp; utility-scale ground-mount sits at £600–£850 per kWp.
What Drives Cost Differences Between Countries
Five factors explain most of the cost variation across European solar markets. Understanding them helps predict where prices are headed and which market conditions produce the best project economics.
1. Labour Costs
Labour accounts for 20–30% of a typical residential solar installation in Europe. In Germany, certified electricians earn €45–€65/hour; in Romania, comparable work costs €12–€18/hour. This difference alone explains a significant share of the Eastern vs Western European cost gap.
Labour cost differences compound on complex projects. A commercial rooftop with intricate roof geometry or long cable runs amplifies the labour differential between high-cost and low-cost markets.
2. Module and Component Prices
Module prices across Europe have largely converged. Mainstream monocrystalline panels in 2026 cost approximately €0.115–€0.145 per Wp; high-efficiency TOPCon and HJT modules sit at €0.130–€0.165 per Wp. These prices are broadly available to installers across the EU, though VAT rates and import logistics create small country-to-country variations.
Eastern European markets — particularly Poland, Romania, and Czech Republic — have built stronger import logistics for Chinese modules, keeping BOM costs competitive even relative to higher-volume Western European markets.
3. VAT and Taxation
VAT on solar equipment and installation varies significantly across Europe and directly affects the final invoice price:
| Country | VAT on Solar Equipment | VAT on Labour |
|---|---|---|
| Germany | 0% | 0% |
| United Kingdom | 0% | 0% |
| Spain | 10% | 10% |
| France | 5.5–10% | 5.5–10% |
| Belgium | 6% (residential) | 6% |
| Poland | 8% | 8% |
| Italy | 10% | 10% |
| Netherlands | 21% | 21% |
| Sweden | 20% | 20% (offset by Rot deduction) |
| Finland | 24% | 24% |
Germany and the UK’s zero-VAT policies are the most impactful cost-reduction levers available within European tax frameworks. For a €15,000 Dutch installation at 21% VAT vs the same installation in Germany at 0%, the VAT difference alone is €3,150. See Solar VAT Rates Europe for the full breakdown.
4. Permitting and Grid Connection Complexity
Grid connection processes vary enormously across Europe. Spain’s automated “autoconsumo” registration for systems under 100 kW takes days. France’s Enedis approval for the same system can take 2–6 months. Italy’s SUAP municipal permit requirements add weeks to projects in certain regions.
For installers operating across multiple European markets, permitting complexity is often a larger operating cost driver than hardware. It affects overhead per project, cash flow, and how many jobs a team can complete in a season. For country-by-country permit rules, see Solar Permit Requirements in Europe.
5. Market Maturity and Installer Competition
Markets with deep installed base and many experienced teams produce lower installation costs:
- More trained installer teams means more price competition
- Established supply chains reduce procurement overhead
- Standardised workflows cut per-project time
- Better-trained crews reduce rework and warranty callbacks
Germany, Italy, and Spain have decades of installed history and benefit substantially from this maturity effect. Norway, Finland, and some Eastern European markets are in earlier development stages, where installer scarcity and workflow inefficiency add cost even when labour rates are otherwise competitive.
Residential vs Commercial vs Utility-Scale: How System Size Changes Cost per kWp
System size is the second biggest driver of cost per kWp after country location. Larger systems benefit from economies of scale across modules, inverters, mounting, and installation overhead.
| System Size | Segment | Typical Cost per kWp (EU Average) | Key Scale Effect |
|---|---|---|---|
| 3–10 kWp | Residential | €900–€2,200 | High per-project overhead amortised over few kWp |
| 10–30 kWp | SME/prosumer | €800–€1,500 | Slight overhead reduction |
| 30–500 kWp | Commercial | €650–€1,400 | Bulk procurement, simpler grid connection |
| 500 kWp–5 MWp | Large commercial / small utility | €550–€1,000 | EPC competition, standardised mounting |
| 5 MWp+ | Utility-scale | €480–€950 | Full procurement scale, ground-mount efficiency |
The residential-to-utility gap in practice: A 5 kWp residential system in Germany at €1,500/kWp and a 2 MWp utility field at €700/kWp use the same module technology. The entire difference is overhead, scale, and procurement efficiency. This is why the solar design software a company uses matters — systematic design reduces rework time, standardises the BOM across projects, and directly affects how many projects a team can complete per year.
The 30 kWp Regulatory Threshold
In most European countries, regulatory and permitting complexity changes significantly at the 30 kWp threshold (or equivalent in local regulation). Above this size, systems often require building permits, detailed grid connection applications, and longer approval timelines. This adds overhead that partially offsets the hardware savings from scale — which is why the 10–30 kWp range sometimes costs as much per kWp as larger commercial systems in certain markets.
Design, Simulate, and Quote European Solar Projects
SurgePV’s generation and financial tool calculates payback, IRR, and NPV for any European market — using your actual installation cost per kWp alongside local irradiance and tariff data.
Book a DemoNo commitment required · 20 minutes · Live project walkthrough
For a direct comparison, see Arka 360 vs SurgePV.
Cost Breakdown: Where Your Money Goes
Understanding what makes up the cost per kWp helps installers identify savings opportunities and helps buyers evaluate quotes intelligently.
Residential System (5–10 kWp) — Typical Cost Structure
| Component | Share of Total Cost | Notes |
|---|---|---|
| Solar panels | 30–40% | Monocrystalline PERC or TOPCon mainstream |
| Inverter | 8–12% | String inverter for most residential systems |
| Mounting system | 5–8% | Roof-integrated rail-and-clamp systems |
| DC and AC wiring | 4–6% | Including conduit, connectors, combiner box |
| Grid connection | 3–6% | Application fees and DSO connection costs |
| Installation labour | 20–30% | 2–3 days for a typical 8 kWp system |
| Commissioning and admin | 3–5% | Permitting, inspection, documentation |
| Installer margin | 8–12% | Varies by market and company size |
What this means for buyers: When comparing quotes, verify whether grid connection fees are included. In markets with high connection costs — some French departments, certain Italian regions — this line item can add €500–€3,000 to the installed cost. Quotes that exclude this will appear cheaper on paper but not in practice.
Commercial System (30–500 kWp) — How the Structure Changes
For commercial systems, the labour share falls and the panel share rises, because the same crew that installs 8 kWp on a residential roof in 2 days can install 50 kWp on a flat commercial building in 4 days. The per-kWp labour cost drops substantially:
| Component | Residential Share | Commercial Share |
|---|---|---|
| Solar panels | 30–40% | 40–50% |
| Inverter | 8–12% | 6–9% |
| Mounting system | 5–8% | 5–8% |
| Wiring and BOS | 4–6% | 5–8% |
| Grid connection | 3–6% | 5–10% |
| Installation labour | 20–30% | 15–20% |
| Admin and engineering | 3–5% | 3–6% |
| Installer margin | 8–12% | 6–10% |
Pro Tip: The Inverter-to-Panel Cost Ratio
A useful sanity check on any solar quote: inverter cost should be 20–30% of the panel cost. If the inverter line item is higher, verify whether the quote includes battery storage — which inflates this ratio — or whether premium microinverters or power optimizers are specified. Each has legitimate use cases, but the buyer should know which one they are getting before signing.
How Module Prices Changed the Landscape in 2024
European module prices fell sharply in 2023–2024 as Chinese overcapacity flooded global markets. Mainstream monocrystalline PERC panels dropped from around €0.25–€0.35/Wp in 2022 to €0.115–€0.145/Wp by early 2026 — a 50–60% decline in the cost of the single largest installation component. For Global-specific compliance details, see Global net-metering-by-country. For Global-specific compliance details, see Global solar-permitting-speed-by-country.
The installed cost per kWp fell by less — approximately 20–25% in markets like Germany and the Netherlands — because labour, mounting, permitting, and grid connection costs held stable or rose slightly due to wage inflation. The hardware savings were partially absorbed by non-hardware cost components that did not move with the module market.
How Installation Costs Connect to Payback and ROI
The cost per kWp is the starting point for every solar financial model. For any project — residential, commercial, or utility-scale — the three inputs that drive financial performance are: installation cost, energy yield, and the avoided or sold electricity price.
Simplified payback formula:
Simple Payback (years) = Total System Cost (€)
                         ─────────────────────────────────────
                         Annual Energy Output (kWh) × Net Benefit per kWh (€)
Where Net Benefit per kWh is either the avoided retail electricity price (self-consumption), the feed-in tariff (export), or a blend of both based on the actual consumption profile.
Country Comparison: Same 10 kWp System, Different Economics
The table below uses a 10 kWp system with a south-facing roof, 30° tilt, and 100% self-consumption assumption. No subsidies applied.
| Country | Install Cost (€) | Yield (kWh/year) | Electricity Price (€/kWh) | Simple Payback |
|---|---|---|---|---|
| Spain | 12,000 | 15,000 | 0.25 | 3.2 years |
| Netherlands | 13,500 | 9,500 | 0.35 | 4.1 years |
| Germany | 14,000 | 10,500 | 0.32 | 4.2 years |
| Poland | 11,000 | 10,000 | 0.22 | 5.0 years |
| France | 17,000 | 13,000 | 0.23 | 5.7 years |
| Italy | 14,500 | 14,000 | 0.25 | 4.1 years |
| UK | £14,000 | 9,000 | £0.24 | 6.5 years |
| Sweden | 17,000 | 9,000 | €0.16 | 11.8 years |
| Norway | 19,000 | 8,500 | €0.12 | 18.6 years |
The Norway and Sweden figures illustrate a critical point: high installation costs combined with low electricity prices (both countries have cheap grid power from hydro and other renewables) create long payback periods that make residential solar marginal without strong subsidies or premium green tariffs.
Spain, Germany, and Italy show the best combinations: competitive installation costs, strong solar yields, and high retail electricity prices.
For solar companies presenting financial cases to commercial clients, using the generation and financial tool to model self-consumption profiles and time-of-use tariffs — rather than simple flat-rate payback — produces more accurate proposals and wins more deals.
For a deeper analysis on European electricity prices and their interaction with solar economics, see Electricity Prices in Europe and Solar ROI. For levelised cost comparisons across markets, see Solar LCOE by Country.
Key Takeaway: IRR Beats Simple Payback
Simple payback treats all cash flows as equal and ignores the time value of money. For commercial and utility projects, IRR and NPV are the correct metrics. A 15-year payback project with high cash flows in years 1–8 can have a better IRR than a 10-year payback project with lower early yields. Use proper financial modelling — not just payback period — when comparing European markets. See Solar NPV, IRR, and Payback Guide for the full methodology.
How Installers Use Cost Data in Project Design
The cost per kWp figure matters most when it is built into the proposal and financial model presented to the client — not just tracked in a spreadsheet after the fact. Here is how professional solar installers integrate this data into their workflow.
Benchmark Before You Quote
Before opening a design tool, verify the current market rate for your country and system size using data like the tables above. If your internal cost structure runs 15–20% above the market benchmark for your segment, that is a procurement, workforce, or overhead problem — not a pricing strategy problem.
Use the Cost per kWp as a Sanity Check on Bills of Materials
When using solar software to generate a system design, cross-check the auto-generated BOM cost against the expected cost per kWp range for your market. A German residential BOM that produces a €2,500/kWp quote is not competitive and likely reflects a sizing error (oversized inverter, premium module selection not justified by roof orientation) rather than genuine market pricing.
Apply Scale Adjustments for Commercial Projects
When quoting commercial projects, apply the residential-to-commercial cost reduction of 25–35% per kWp. For a Polish company quoting a 200 kWp commercial rooftop after primarily doing residential work, a target range of €700–€900/kWp is realistic — not €900–€1,300/kWp.
Factor Payback Sensitivity into Client Proposals
Clients care about payback, not the cost per kWp. A €200/kWp difference in installation cost changes the payback period by roughly 0.5–1 year in most European markets — meaningful, but not project-ending. More impactful on ROI are the electricity tariff, self-consumption rate, and whether the solar proposal software used to model the project accurately reflects real consumption patterns rather than generic averages.
For installers working across multiple European markets, the ability to model country-specific yields, local tariffs, and accurate installation costs in a single platform is the difference between winning and losing cross-border commercial tenders.
Conclusion
Installation costs across European solar markets range from €800/kWp in Romania to over €2,300/kWp in Luxembourg for residential systems. The variation is driven by five factors — labour rates, VAT, permitting, module procurement, and market maturity — not by differences in hardware technology.
Three takeaways for solar professionals:
- Use country-level cost benchmarks to verify your own cost structure before quoting. If your costs run above market for your segment, investigate procurement and overhead — not pricing.
- Scale reduces cost per kWp by 30–40% from residential to commercial. Do not apply residential margins to commercial project bids without adjusting for size.
- High installation costs do not always mean poor ROI. Spain is the most efficient market (low cost + high irradiance), but Germany and the Netherlands produce excellent payback periods under 10 years despite moderate installation costs, because electricity prices are high.
Frequently Asked Questions
Which European country has the cheapest solar installation per kWp?
Poland, Romania, Portugal, and Spain offer the lowest residential installation costs in Europe, typically €800–€1,400 per kWp. Eastern European markets benefit from lower labour costs, while Southern Europe combines competitive labour with high irradiance, improving overall project value.
How much does a 10 kWp solar system cost in Germany in 2026?
A 10 kWp residential system in Germany costs approximately €12,000–€18,000 in 2026, or €1,200–€1,800 per kWp. German prices dropped 20–25% in 2024 as module prices fell sharply, making it one of the most competitive Western European markets today.
Why is solar installation cheaper in Southern Europe than Northern Europe?
Southern Europe has lower labour costs, simpler roof structures, and mature installer networks built over two decades of solar adoption. Northern markets like Sweden, Denmark, and Norway face higher certified-labour wages, stricter building regulations, and shorter installation seasons, all of which raise the cost per kWp.
What does the cost per kWp include?
The installed cost per kWp covers solar panels, inverter, mounting hardware, DC and AC cabling, grid connection, commissioning, and installation labour. It typically excludes battery storage, monitoring systems, and permit fees unless stated — always confirm what is included when comparing quotes.
How have solar installation costs in Europe changed since 2023?
European installation costs fell significantly in 2024 as Chinese module prices dropped to €0.10–0.15 per Wp. Germany saw a 20–25% cost reduction within one year. However, labour and administrative costs held relatively stable, meaning hardware savings did not fully pass through in every market.
Does cost per kWp decrease for larger commercial systems?
Yes, significantly. Commercial systems in the 30–500 kWp range typically cost 30–40% less per kWp than residential systems in the same country. Utility-scale projects above 1 MWp can reach €550–950 per kWp across Europe due to economies of scale in procurement, simplified mounting, and reduced administrative overhead per installed watt. See Design Commercial Solar System 1MW for detailed guidance.