Quick Answer
Agrivoltaics combines solar panels with agriculture, using elevated panels (3–5 meters) that allow farming underneath. Compatible crops: lettuce, tomatoes, berries, and grazing animals. Land productivity increases by 60–70%. A 1 MW agrivoltaic system generates €40,000–60,000/year in electricity plus crop income.
Farm income across Europe and North America is being squeezed from both ends. Input costs are up. Crop margins are flat. Land prices keep climbing. Meanwhile, solar developers are knocking on farm gates with lease offers that look attractive on paper but raise an obvious question: can a working farmer actually keep farming the land, and earn solar revenue on top? That is what an agrivoltaic system is built to do — produce food and electricity from the same hectare, without choosing between the two. Also see: European Solar Tax Credits. For Europe-specific compliance details, see Europe solar compliance.
Agrivoltaics combines solar panels with agriculture, using elevated panels (3–5 meters) that allow farming underneath. Compatible crops: lettuce, tomatoes, berries, and grazing animals. Land productivity increases by 60–70%.
See also: agrivoltaics systems guide.
Agrivoltaics combines solar panels with agriculture, using elevated panels (3–5 meters) that allow farming underneath. Compatible crops: lettuce, tomatoes, berries, and grazing animals. Land productivity increases by 60–70%. A 1 MW agrivoltaic system generates €40,000–60,000/year in electricity plus crop income.
This guide is written for farmers, farm managers, and rural landowners who are evaluating agrivoltaics as a business decision. It walks through the four real-world system types, which crops fit each one, what equipment you can still use, what the project actually costs, the subsidy programs that exist today, and the step-by-step process to plan a system on your own land.
TL;DR — Agrivoltaics Systems for Farmers
Agrivoltaic systems combine solar power and crops on the same land. Installed cost runs $1.50 to $2.33 per watt — 20 to 50 percent above standard ground-mount. Land lease rates reach €800 to €2,500 per hectare per year in Europe and $700 to $1,400 per acre in the US. Shade-tolerant crops (lettuce, berries, peppers, herbs) often gain yield. Combine-harvested cereals lose yield unless panel density is below 0.20 GCR. Germany, France, Italy, Japan, and multiple US states now run dedicated agrivoltaic subsidy programs. Plan on 9 to 30 months from feasibility to commissioning.
For France-specific information, see Agricultural Solar Case Study.
What you will get from this guide:
- A plain-language definition of how agrivoltaics differs from a standard solar farm
- The four system types in commercial use today and how to pick one
- A crop selection table with shade tolerance and expected yield change
- Cost ranges per acre and per megawatt with the cost drivers explained
- The three business models (lease, own, joint venture) with real revenue numbers
- Subsidy and regulatory snapshots for the major agrivoltaic markets
- A six-step planning process from land audit to commissioning
- The mistakes farmers make most often and how to avoid them
What Agrivoltaics Actually Looks Like on a Working Farm
The textbook definition of agrivoltaics is simple: the same parcel of land produces both photovoltaic electricity and an agricultural output. In practice, that single sentence covers four very different physical setups, and the differences matter.
A field of standard ground-mount solar panels has rows spaced 4 to 5 meters apart, with module bottoms about 0.5 to 1 meter off the ground. Sheep can graze in those gaps, and that is technically agrivoltaics — the lowest-cost variant. At the other end of the spectrum, panels can be lifted 5.5 meters in the air on steel pile foundations, with row spacing of 10 to 12 meters, so a combine harvester can work the soybeans underneath. Both systems generate electricity. Both systems grow something. Their CAPEX, their permitting, and their farmer return profile are nothing alike.
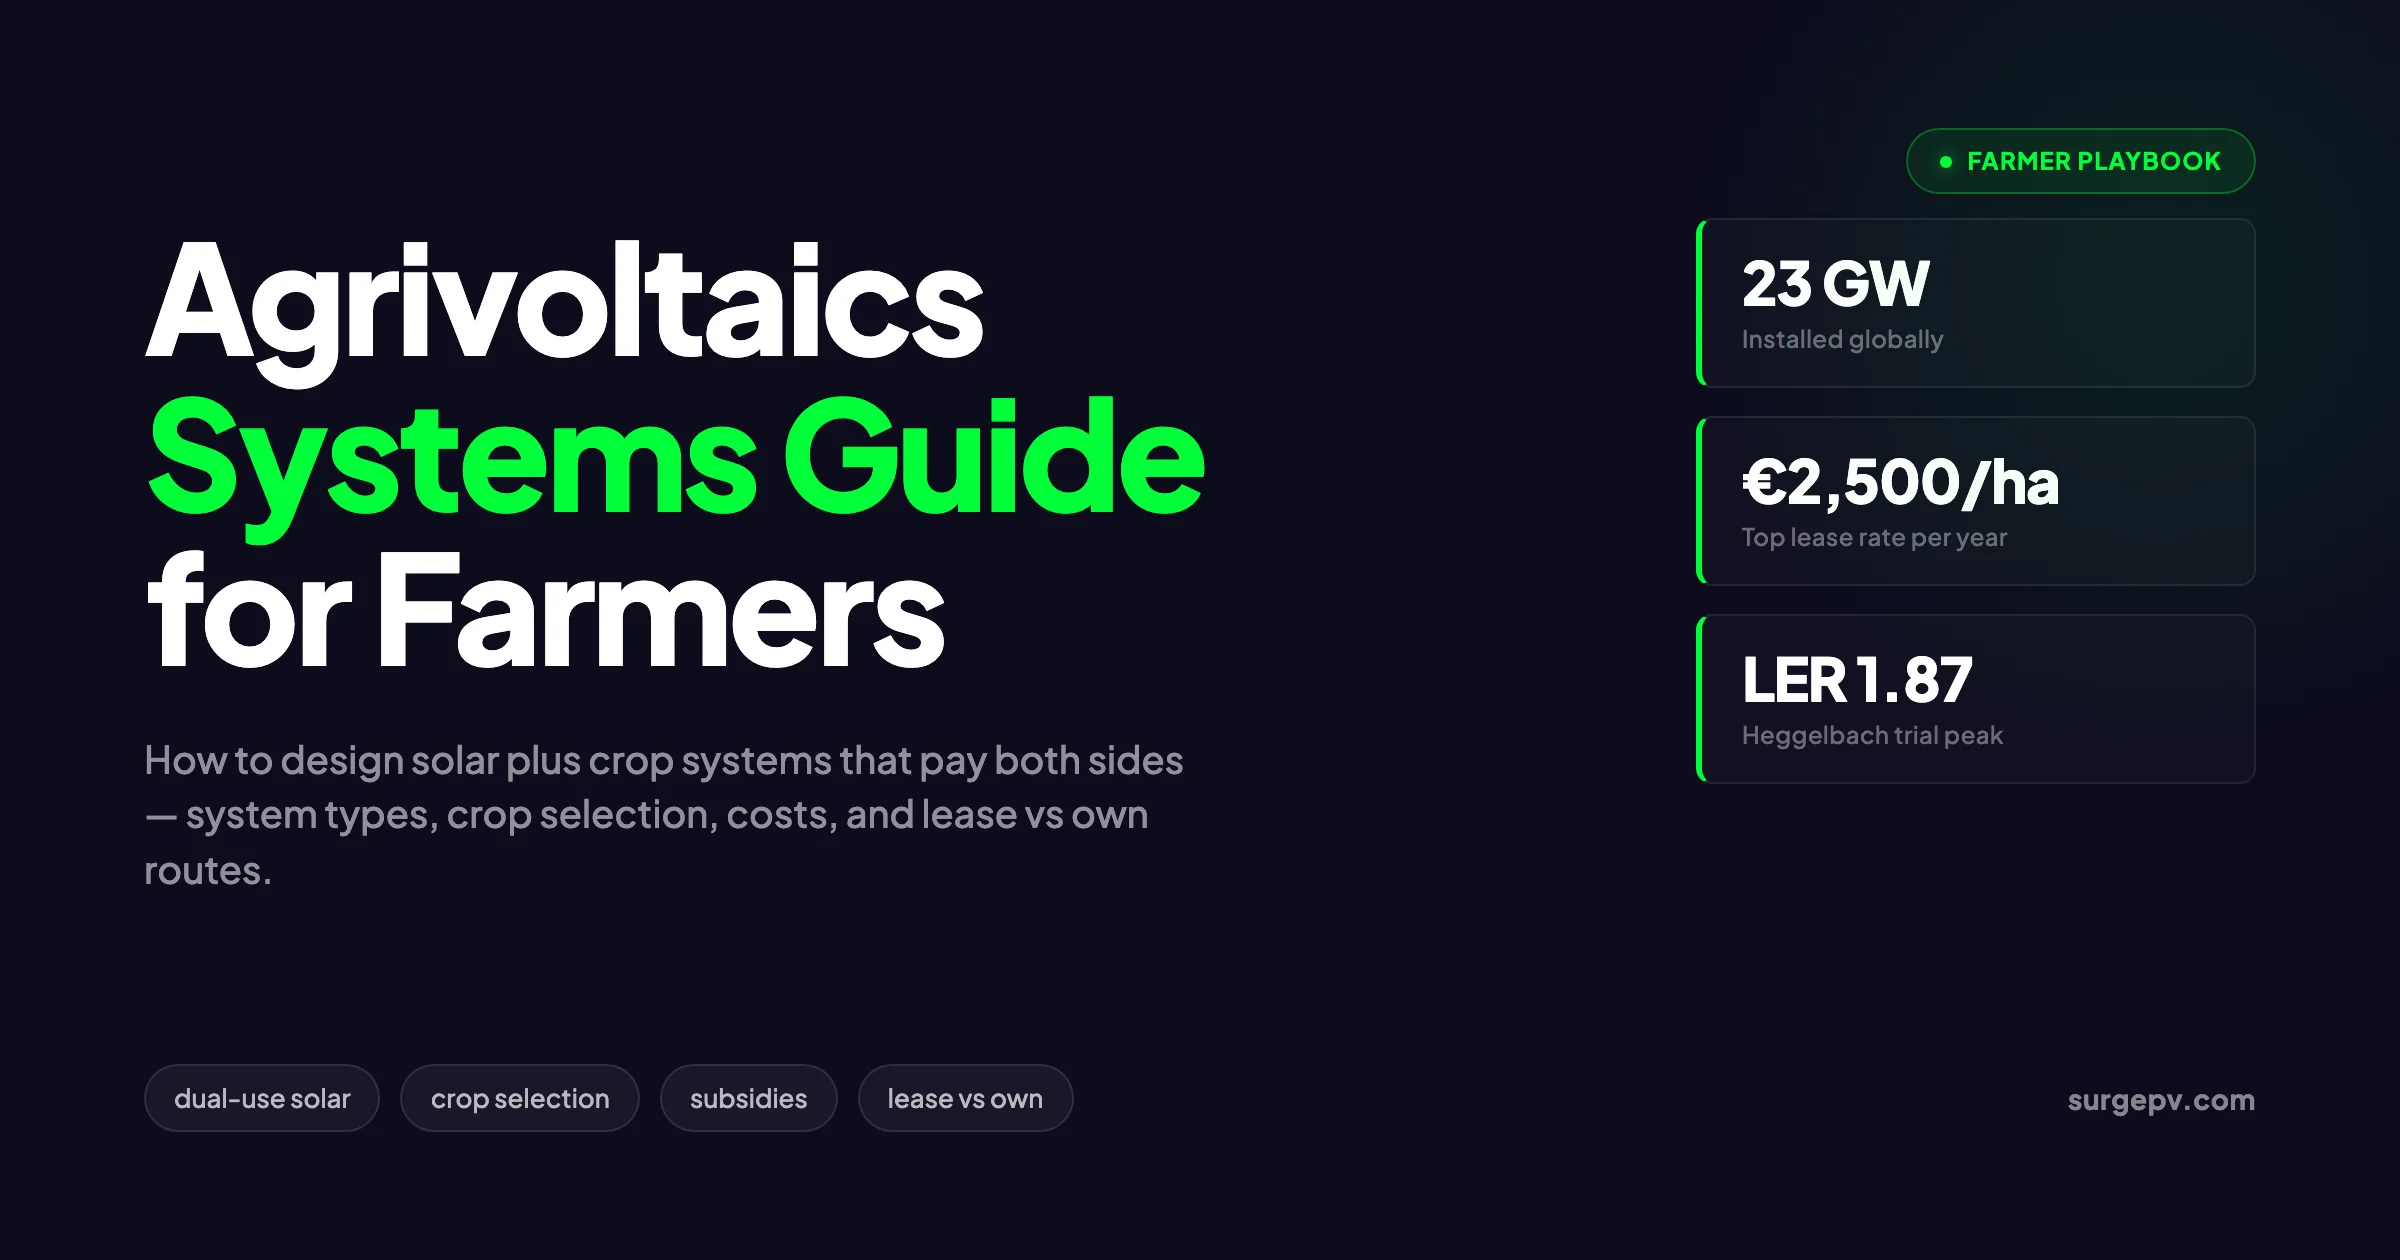
Globally, agrivoltaic installations now cover more than 22,000 hectares of farmland and produce over 23 GW of solar power, according to Wikipedia’s running tally sourced from national grid data. Europe and Asia-Pacific account for 68 percent of installed capacity. China dominates absolute volume, with the Kubuqi Desert and Ningxia goji-berry pilots delivering more than half of global capacity. Germany, France, Italy, Japan, the Netherlands, and the United States now have meaningful pipelines. Also see: solar panel ROI in Italy. Also see: Germany solar subsidies. Also see: France solar feed-in tariffs.
The reason this is moving from research to mainstream is straightforward. Land is the binding constraint on solar deployment in most of the EU, in Japan, and in the densely populated US states. Treasury and energy ministries are realizing that solar built on top of farms — instead of replacing them — is the only way to triple capacity by 2030 without a public backlash. Agrivoltaic-specific tariffs have appeared in five EU countries since 2023.
Where this creates an opening for farmers: a land lease at agrivoltaic rates can outperform conventional crop margins three- to tenfold per hectare, and a hybrid joint venture can convert a marginal field into the most profitable acre on the farm. The catch is that this is not a zero-design decision. Picking the wrong system, the wrong crop, or the wrong contract structure can cost you a decade of farm income.
For the engineering side of the equation — ground coverage ratios, structural calculations, bifacial gain math — read our agrivoltaics design guide aimed at solar EPCs and designers. This guide stays on the farmer’s side of the table. See Bifacial Solar Panel Design Guide for detailed guidance.
The Four System Types in Commercial Use Today
There are four physical configurations of agrivoltaic system that are deployed at scale today. Each one was developed to solve a different farming problem, and they are not interchangeable. Picking the type that matches your operation is the most important decision you will make in the entire project.
Type 1: Stilt-Mounted Elevated Arrays (Above-Crop)
This is the configuration most people picture when they hear “agrivoltaics.” Solar modules are mounted on tall steel piles 3 to 5 meters above the ground, with row spacing of 8 to 12 meters between supports. Standard farm equipment — tractors, sprayers, combine harvesters — operates underneath the array. The crop grows in a partial-shade environment that tracks across the field as the sun moves.
Stilt-mounted systems suit horticulture, viticulture, and high-value berry production. They are the dominant European configuration for new agrivoltaic projects above 1 MW. The Fraunhofer ISE Heggelbach demonstrator in Germany used this format with 5.5 meters of clearance for arable crops and recorded a Land Equivalent Ratio of 1.56 to 1.87 across multiple seasons.
Pros: full equipment compatibility, fits high-value crops, qualifies for premium subsidy tariffs.
Cons: highest CAPEX of all configurations ($2.00 to $2.33 per watt installed), requires reinforced foundations, longest permitting timeline.
Type 2: Vertical Bifacial Fences (Between-Crop)
Bifacial solar modules are mounted vertically on a north-south axis, like fence posts running through the field. Crops or pasture grow in the open strips between rows. Generation peaks in the morning and afternoon — when the sun hits each side of the panel — instead of at midday.
This is the fastest-growing configuration in northern Europe because it leaves more than 90 percent of the soil surface fully exposed to sunlight. Standard farm machinery operates between rows without modification. Vertical systems also pair naturally with grazing operations and with low-shade-tolerant crops like wheat and grass.
Pros: lower CAPEX than elevated systems ($1.65 to $1.90 per watt), minimal soil disturbance, generation profile complements midday-heavy grids.
Cons: lower energy density per hectare (about 25 to 30 percent below elevated systems), wind loading is higher per pole, snow accumulation between rows in northern climates.
Type 3: Tracker-Based Dynamic Systems (Above-Crop)
Single-axis trackers are mounted on tall stilts and rotate to follow the sun across the day. Where elevated fixed-tilt systems give the crop a static shade pattern, trackers can be programmed to tilt for the crop — opening up to maximum sunlight at flowering, closing down to maximum shade during drought stress, and reverting to power-optimized angles when the crop does not need light management.
French companies Sun’R, Ombrea, and TSE pioneered this format and now dominate the European tracker-agrivoltaic segment. The systems are favored for orchards, soft fruit, and high-value vegetables that need active microclimate control.
Pros: highest crop-side flexibility, best fit for stress-prone crops in hot climates, often qualifies for the highest subsidy tier.
Cons: highest total project cost (often $2.50 per watt or more), more moving parts to maintain, requires sophisticated control software.
Type 4: Greenhouse-Integrated Solar (Above-Crop, Enclosed)
Photovoltaic modules are integrated into the roof or sidewalls of a commercial greenhouse — either as opaque cells with deliberate gaps, semi-transparent thin-film modules, or spectrally selective glass that lets photosynthetically useful wavelengths through. The structure does double duty: it is both the solar generator and the climate-controlled growing environment.
Greenhouse-integrated solar dominates the Italian and Spanish horticulture markets and is gaining ground in the Netherlands. It works best for crops that already require a covered environment — leafy greens, microgreens, tomatoes, cucumbers, herbs, and ornamental flowers. Capital intensity is high, but the structure replaces a greenhouse you would have built anyway, so the marginal cost of adding solar is more attractive than the standalone numbers suggest. For Italy-specific information, see Commercial Rooftop Solar Case Study Italy.
Pros: works on crops that need protection anyway, structure is multipurpose, easy permit pathway in greenhouse-zoned land.
Cons: only viable for protected horticulture, transparent modules cost 2 to 4 times more than standard panels, requires year-round climate management.
The hub overview of agrivoltaics on SurgePV explains how these four configurations sit alongside other dual-use approaches such as floating PV and BIPV, with a comparison matrix. For a direct comparison, see Arka 360 vs SurgePV.
Crop Selection: What Actually Grows Well Under Panels
This is where the marketing brochures stop being useful. Not every crop benefits from partial shade, and choosing the wrong crop will sink your project’s economics regardless of how good the panels are. The deciding factor is the crop’s daily light integral (DLI) requirement — the total amount of usable sunlight it needs to hit a commercial yield. Also see: Us Residential Solar Market Trends 2026.
Crops with low DLI requirements (12 to 20 mol/m²/day) tolerate or benefit from panel shading. Crops with high DLI requirements (30 to 50 mol/m²/day) will lose yield under any meaningful panel coverage. The table below summarizes shade response and yield change observations from Fraunhofer ISE, INRAE, and the University of Massachusetts agrivoltaic trials.
| Crop | Shade tolerance | Typical yield change under elevated PV | Best system type |
|---|---|---|---|
| Lettuce | High | +5 to +20% in hot climates | Stilt-mounted, greenhouse |
| Spinach | High | +5 to +15% | Stilt-mounted, greenhouse |
| Basil and herbs | High | +5 to +25% | Stilt-mounted, greenhouse |
| Strawberries | Medium-high | -5 to +10% | Stilt-mounted, tracker |
| Blueberries | Medium-high | 0 to +15% | Stilt-mounted, tracker |
| Raspberries | Medium-high | -5 to +10% | Tracker-based |
| Peppers | Medium-high | -10 to +10% | Tracker-based |
| Tomatoes (open field) | Medium | -10 to +5% | Tracker-based |
| Potatoes | Medium | -5 to +5% | Stilt-mounted |
| Wheat (winter) | Low-medium | -10 to -20% | Vertical bifacial |
| Pasture grass | High | 0 to +15% | Vertical, low-stilt |
| Vines (wine grape) | Medium-high | -5 to +5% (better in heat) | Tracker-based |
| Olives | Medium | -10 to 0% | Stilt-mounted |
| Soybeans | Low | -15 to -25% | Vertical only |
| Corn | Very low | -25 to -40% | Not recommended |
| Rice | Very low | -30 to -45% | Not recommended |
Two patterns are worth pulling out. First, in hot, sunny climates, partial shading often raises yield because it cuts heat stress, reduces evapotranspiration, and protects against sunscald. Studies in the California desert have measured 14 to 29 percent water savings on cucumber and lettuce under panels, with comparable yield gains. Second, in temperate northern climates, the shade benefit disappears because the limiting factor is light, not heat. In Germany, lettuce under panels yields about the same as in open field, while wheat loses roughly 15 percent.
This pattern matters when picking your project location and crop rotation. Agrivoltaics is most valuable on south-facing fields in Mediterranean climates, on irrigated cropland in semi-arid zones, and on grazing land everywhere. It is least valuable on high-latitude, light-limited fields growing cereals.
Pro Tip — Match crop choice to grid economics, not just yield
If your local power tariff is high and your crop margin is low, a 15 percent yield reduction on wheat may still leave you ahead — the lost crop revenue is worth less than the gained power revenue. Run the math on both income streams together, not separately. A field of low-margin field corn may be worth more under panels growing pasture grass for sheep grazing than it is in its current rotation.
Designing for Your Equipment: Clearance and Spacing
The two design parameters that decide whether your existing tractors and harvesters can keep operating are panel clearance height and row spacing. Get either one wrong and you have an asset stranded on land you can no longer farm with your own machinery.
Panel clearance height is measured from the ground to the bottom edge of the panel at its lowest tilt position. Standard clearance benchmarks:
- Sheep grazing or low ground cover: 1.5 to 2 meters
- Hand-harvested berries and vines: 2 to 3 meters
- Standard tractor with mounted spray boom: 3.5 to 4 meters
- Large tractor with elevated cab: 4 to 4.5 meters
- Combine harvester for cereals: 4.5 to 5.5 meters
- Self-propelled grape harvester: 4.5 meters
Specify clearance to the tallest piece of equipment in your fleet, plus 0.5 meter of buffer for safety and future upsizing. Do not specify to current equipment if you are likely to rotate the field into a different crop in the next 10 years. Steel piles are a 25-year asset, and adding 0.8 meters of clearance at the design stage costs 8 to 12 percent more than the standard build. Adding it later costs 100 percent of the project.
Row spacing should be a clean multiple of your standard implement width — usually 6 meters or 12 meters, matching common boom widths in arable farming. Mismatched spacing forces overlap or skip on every pass, which kills harvest efficiency and creates compaction lanes that ruin crop yield independent of the panels. If your standard sprayer is 12 meters wide, your row spacing should be 12 meters or 24 meters, not 11 or 13.
Inverter placement also matters. String inverters and combiner boxes need ground-level access for maintenance, but they cannot sit in the middle of a working field. Cluster them at the field edge or under a perimeter row. The same goes for monitoring sensors — pole-mounted at the perimeter, not driven into the working area.
Get the equipment match wrong and you will spend a decade renting back access to your own land. Get it right and the array becomes invisible to the farm operation.
Land Footprint and Capacity: How Much Power Per Hectare
The headline number for any agrivoltaic project is the installed capacity per hectare, which determines both the power revenue ceiling and the project’s eligibility for various subsidy tiers.
Standard ground-mount solar runs at a ground coverage ratio of 0.5 to 0.6, which translates to roughly 0.8 to 1.0 MW per hectare in temperate latitudes. Agrivoltaic systems run at much lower GCRs to leave room for crops, so the installed capacity per hectare is correspondingly lower:
| Configuration | Typical GCR | Capacity per hectare | Annual generation (Central Europe) |
|---|---|---|---|
| Standard ground-mount | 0.50–0.60 | 0.8–1.0 MW | 950–1,100 MWh |
| Elevated stilt-mounted (above-crop) | 0.30–0.40 | 0.5–0.7 MW | 600–800 MWh |
| Tracker-based dynamic | 0.30–0.35 | 0.5–0.6 MW | 700–900 MWh |
| Vertical bifacial | 0.10–0.15 | 0.3–0.5 MW | 350–550 MWh |
| Greenhouse-integrated (semi-transparent) | 0.50–0.70 (roof area) | 0.4–0.7 MW per ha greenhouse | 450–700 MWh |
A 5-hectare project on stilt-mounted hardware delivers roughly 2.5 to 3.5 MW of installed capacity, generating about 3,000 to 4,000 MWh per year in Germany or northern France, and 4,500 to 5,500 MWh in southern Spain or Italy. At a typical PPA price of €70 to €110 per MWh, that is €210,000 to €600,000 per year in gross power revenue, before O&M, debt service, and lease split. Also see: Spain net metering.
This is what makes the lease economics work. Even at the lowest tier — a 15-year lease on a 5-hectare field at €1,200 per hectare per year — the farmer collects €6,000 annually for land that may have been generating €450 per hectare in conventional crop margin. That is roughly 13 times the alternative use revenue, and the crop revenue continues underneath the panels at 80 to 100 percent of pre-installation levels.
To plan your own project’s capacity, layout, and energy yield, our solar design software lets you import a parcel boundary, set GCR and clearance constraints, and produce an annual generation forecast in under an hour. Pair it with solar proposal software to take the design straight to a landowner-ready quote. Coupled with the generation and financial tool, you can model both crop revenue and power revenue side by side before you talk to a developer.
Costs, Capital, and Financing Routes
The honest answer to “what does an agrivoltaic system cost” is that it depends on the system type, the country, the structure spec, and the financing route — but there is a usable range that holds across most of Europe and North America.
| Configuration | Installed cost ($/W) | Cost per hectare ($) | Cost per MW ($) |
|---|---|---|---|
| Vertical bifacial | $1.40–$1.80 | $420,000–$900,000 | $1.4M–$1.8M |
| Elevated stilt (low clearance, sheep) | $1.50–$1.90 | $750,000–$1.3M | $1.5M–$1.9M |
| Elevated stilt (high clearance, arable) | $2.00–$2.33 | $1.0M–$1.6M | $2.0M–$2.3M |
| Tracker-based dynamic | $2.30–$2.60 | $1.2M–$1.6M | $2.3M–$2.6M |
| Greenhouse-integrated (semi-transparent) | $3.50–$5.00 | $2.0M–$3.5M (greenhouse area) | $3.5M–$5.0M |
The cost premium over standard ground-mount comes from three places: heavier steel for taller piles and wider spans, more concrete in the foundations, and higher labor for elevated installation work. The premium ranges from 10 percent at the cheap end (low-clearance grazing) to 50 percent at the high end (combine-clearance arable). Greenhouse integrated systems are a different cost category altogether and should be evaluated on their own.
For a working farm, three financing routes are realistic:
Self-financed: The farm pays the full CAPEX from cash or farm-mortgage debt. Pays back in 8 to 12 years on power revenue alone, sooner with crop revenue layered on. Captures 100 percent of long-term cash flow but requires €600,000 to €2 million per MW of upfront capital. Rare outside large estate farms or cooperatives.
Developer-financed lease: A solar developer puts up all the capital, owns the array, and pays the farmer an annual land lease. Zero risk to the farmer, modest upside, but the farmer keeps full crop control and revenue. This is the dominant model in Germany, France, and the UK. See our guide on Battery Solar System Design UK for more. For United Kingdom-specific compliance details, see United Kingdom comparisons/mcs-vs-non-mcs.
Joint venture: The farmer contributes the land and operating rights, the developer contributes the capital, and they split the power revenue (typically 60/40 or 70/30 in favor of the developer, with the farmer’s split rising over the project life). The farmer keeps 100 percent of crop revenue. This model is gaining traction in Italy and the Netherlands and is the highest long-run return for the farmer who can stomach the complexity.
A fourth route — community-owned cooperatives where multiple farmers pool land and capital — is common in Germany and Denmark, modeled on the community solar projects in Germany framework. For more on this topic, see Community Solar Business Model.
Model Your Agrivoltaic Project Before You Sign
Run a side-by-side power and crop revenue model on your own field. Import the boundary, set crop type, clearance, and GCR — and compare lease, joint venture, and own scenarios in one view.
Book a DemoNo commitment required · 20 minutes · Live project walkthrough
Revenue: Lease vs Own vs Joint Venture (Real Numbers)
The single most useful exercise for any farmer evaluating agrivoltaics is to put the three business models side by side and look at 20-year cash flow. The numbers below are based on a 1 MW elevated stilt-mounted system on 1.7 hectares of land in central France, using public PPA pricing and EU subsidy rates as of early 2026.
Scenario A: Land Lease (Developer Owns Array)
- Annual lease revenue to farmer: €2,000 to €3,500 (€1,200 to €2,000 per hectare)
- Crop revenue continues at 90 to 100 percent of baseline: €1,500 to €4,500 per hectare
- Total annual income to farmer: €3,500 to €11,000
- Risk to farmer: minimal (developer handles all CAPEX, O&M, grid risk)
- 20-year cumulative income: €70,000 to €220,000
- Suited to: risk-averse farmers, smaller parcels, fields where leaving operational control simplifies things
Scenario B: Self-Financed Ownership
- Required CAPEX: €1.6M to €2.0M for 1 MW elevated system
- Annual gross power revenue at €90/MWh PPA: €72,000 to €90,000
- Annual O&M cost: €15,000 to €20,000
- Annual debt service (15-year, 5%): €130,000 to €165,000 (years 1–15)
- Annual crop revenue: €1,500 to €4,500 per hectare
- Net annual income: -€80,000 to -€100,000 (years 1–10), then +€55,000 to +€75,000 (years 11–25)
- 25-year cumulative income: €600,000 to €900,000
- Suited to: farms with strong balance sheets, cooperatives, succession-focused estates
Scenario C: Joint Venture (Farmer Land + Operating Role; Developer Capital)
- Power revenue split: 30 percent farmer, 70 percent developer (years 1–10), then 50/50 (years 11–25)
- Annual power revenue to farmer (years 1–10): €20,000 to €27,000
- Annual power revenue to farmer (years 11–25): €33,000 to €45,000
- Annual crop revenue retained: €1,500 to €4,500 per hectare
- Risk to farmer: moderate (operating performance affects revenue split)
- 25-year cumulative income: €450,000 to €750,000
- Suited to: medium-sized farms with good fields and grid access, willingness to engage on operations
The crude pattern: leasing is the safest path with a 3-to-1 income lift over conventional cropping. Owning is the highest long-run return but requires capital and 8 to 10 years of patience. Joint ventures are the middle ground and are increasingly the preferred structure where farmers want long-term upside without footing the full bill.
The structure that wins on your farm depends on three things: your access to capital, your tolerance for project risk, and how much operational control you want to retain. A 50-acre family farm with no debt capacity and no interest in solar O&M will choose the lease. A 500-acre estate planning succession will often choose the joint venture. A cooperative with shared CAPEX capacity will sometimes go straight to ownership.
For a deeper financial walk-through on the modeling side, our European solar incentives post breaks down the country-by-country tariff stacks that feed into the revenue line.
Subsidies and Regulatory Frameworks by Country
Agrivoltaic-specific support has accelerated since 2023. Five EU member states and Japan now run dedicated tariff schemes, and the US has multiple federal and state programs. The frameworks differ in two important ways: (1) which system types qualify, and (2) what crop yield maintenance threshold they require.
Germany
The Renewable Energy Sources Act (EEG 2023 update) created a dedicated agrivoltaic auction segment with a tariff bonus of approximately 1.2 cents per kWh above standard ground-mount. Eligibility requires compliance with DIN SPEC 91434, which mandates that the post-installation crop yield must be at least 66 percent of the pre-installation baseline. Vertical bifacial systems and elevated stilt arrays both qualify. Annual auction volumes have increased from 50 MW in 2023 to 200 MW in 2026.
France
The 2024 APV decree established three categories of qualifying agrivoltaic system based on technical configuration, with associated feed-in tariffs ranging from €110/MWh to €150/MWh for systems below 10 MW. Crop yield must be maintained at 90 percent of baseline for the highest tariff tier. Trackers and elevated stilt systems both qualify; standard ground-mount with grazing does not.
Italy
The PNRR (National Recovery and Resilience Plan) allocated €1.1 billion specifically for agrivoltaic projects, with a target of 1.04 GW by 2026. Grant funding covers up to 40 percent of CAPEX for qualifying systems, with a tariff overlay on top. Eligibility requires 70 percent crop yield maintenance and panel clearance height above 2.1 meters.
Japan
Japan pioneered the regulatory framework in 2013 under the “solar sharing” designation. Roughly 4 GW of agrivoltaic capacity is installed today, almost entirely on small parcels under 50 kW. The framework requires 80 percent crop yield maintenance, certified annually by an agricultural extension agent. Renewals are tied to continued agricultural productivity.
United States
Federal support comes primarily through the Rural Energy for America Program (REAP) and the Modified Accelerated Cost Recovery System (MACRS) depreciation schedule. REAP grants cover up to 50 percent of project cost, capped at $1 million for grants and $25 million for loan guarantees, for qualifying farms. Multiple states — Massachusetts, Colorado, New York, Maine, and California — have additional agrivoltaic-specific incentives layered on top, with bonus tariffs ranging from 1 to 6 cents per kWh.
Netherlands
The Sustainable Energy Production Subsidy (SDE++) includes a dedicated agrivoltaic category with tariff support up to €0.118 per kWh. Vertical bifacial systems and tracker-based projects above 1 MW dominate the Dutch pipeline.
| Country | Subsidy mechanism | Tariff bonus or coverage | Crop yield threshold |
|---|---|---|---|
| Germany | EEG 2023 dedicated auction | +1.2 ¢/kWh over standard ground-mount | 66% of baseline |
| France | APV decree feed-in tariff | €110–€150/MWh tiered | 90% (top tier) |
| Italy | PNRR grant + tariff | Up to 40% CAPEX grant | 70% |
| Netherlands | SDE++ dedicated category | Up to €0.118/kWh | 75% |
| Japan | Solar sharing certification | Standard FIT, renewable on yield | 80% |
| US (federal) | REAP grant + MACRS | Up to 50% CAPEX (REAP cap $1M) | Varies by state |
| US (state, e.g. MA) | SMART program adder | +1–6 ¢/kWh | Varies |
The crop yield threshold is the operative test. If your crop choice cannot maintain at least 70 percent of baseline yield under the proposed array, the system will not qualify for premium tariffs and the project economics may not work. Run the crop yield projection before you commit to a configuration.
How to Plan Your Agrivoltaic Project: Step by Step
The planning process for a farm-scale agrivoltaic project breaks into six discrete steps. Skipping any of them will catch up with you in financing, permitting, or operations.
Step 1: Audit Your Land and Current Operation
Map every parcel on the farm. For each candidate field, capture:
- Total area, shape, and slope
- Current crop rotation and average yield over the last 5 years
- Soil type and irrigation infrastructure
- Distance to the nearest grid connection point
- Existing easements, tenancies, or environmental designations
- Hydrology (flooding risk, drainage)
Rank candidate parcels by a composite score: low current yield, good grid access, manageable slope (under 10 percent), and no environmental restrictions. The ideal first project is on the lowest-yielding parcel with the best grid access. Do not start with your best field — the opportunity cost is too high if the project underperforms.
Step 2: Pick the System Type That Matches Your Crop and Equipment
Match your equipment height, your priority crop, and your subsidy program to one of the four system types. Use the crop selection table earlier in this guide to confirm yield expectations.
The simplest decision tree: do you have combine-harvested cereals on the field today? If yes, you need either vertical bifacial (low panel coverage, machinery clears between rows) or 5.5-meter-clearance elevated stilt. Are you running grazing or permanent pasture? Vertical bifacial or low-stilt elevated. High-value horticulture or berries? Tracker-based or stilt-mounted. Protected horticulture (existing greenhouses)? Greenhouse-integrated.
Step 3: Run a Shading Study and Crop Yield Projection
Before you commit to a layout, model the photosynthetically active radiation (PAR) reaching the crop canopy under different ground coverage ratios and clearance heights. Standard solar yield modeling tools cover power output but ignore the crop side. You need both.
Most national agricultural research institutes (INRAE in France, Fraunhofer ISE in Germany, USDA in the US) publish crop response curves under shading. Cross-reference your priority crop’s response curve against the projected PAR profile to estimate post-installation yield. Target a Land Equivalent Ratio above 1.3 — that is the typical bankability threshold for lenders, USDA grant programs, and EU subsidy schemes.
A shadow analysis at this stage tells you exactly which sub-zones of the field will be most affected and whether your row layout creates dead zones the crop cannot recover from.
Step 4: Choose Your Business Model
Pick the lease, own, or joint venture path based on your capital position, risk tolerance, and operational ambitions. Get three offers from three developers, do not negotiate with the first one to call. Lease rates and joint venture splits vary by 30 to 50 percent across developers in the same region.
Key contract terms to negotiate:
- Lease duration (typical 25 to 30 years)
- Rent escalator (CPI-linked is standard)
- Decommissioning bond (developer must post bond for full removal at end of life)
- Crop yield guarantee (does developer compensate if their structure caused crop loss?)
- Operating windows (when can crews enter the field?)
- Insurance, liability, and grid risk assignment
Step 5: Secure Permits, Grid Connection, and Subsidy Slot
Permitting timelines for agrivoltaics range from 6 months (Italy, simplified procedures for under 1 MW) to 24 months (Germany or France for projects above 5 MW). Filings typically include:
- Building permit and structural certification
- Agricultural land conversion approval (where required by zoning)
- Grid interconnection feasibility study and connection agreement
- Environmental impact assessment (above 5 MW in most EU jurisdictions)
- Subsidy or tariff scheme registration
The subsidy slot is the most time-sensitive piece. Most national auctions run 1 to 4 times per year and have hard application deadlines. Missing a Q3 auction can mean a 6-month delay before the next slot opens, and tariff levels often decline between rounds.
Step 6: Procure, Install, and Commission
Procurement to commissioning typically takes 8 to 18 months for systems above 500 kW. Major timing constraints:
- Steel pile foundations: install during dry season, avoid spring planting window
- Module delivery: lead times of 4 to 6 months for elevated agrivoltaic structures (much longer than standard PV)
- Grid connection: scheduled by the utility, often the longest-lead-time item
- Inverter delivery: 2 to 4 months
- Crop schedule: install must work around your existing harvest and planting calendar
At commissioning, perform two acceptance tests: a standard PV performance test (power output vs design forecast) and a baseline crop yield measurement on the field underneath. The baseline becomes the reference point for monitoring crop performance over the following years and for any contractual yield guarantees.
For end-to-end planning support — from boundary import through bankable financial model — the SurgePV solar software suite handles agrivoltaic-specific GCR, clearance, and crop-yield-overlay modeling in a single workflow.
Common Mistakes Farmers Make
After ten years and 1+ GW of EPC delivery across 50+ countries, the same five mistakes show up on agrivoltaic projects again and again. They are all preventable.
Mistake 1: Specifying clearance for current equipment instead of long-term equipment. A field locked into a 25-year lease at 3-meter clearance cannot rotate into a crop that needs a combine harvester. The clearance decision is irreversible. Add 0.5 to 1.0 meter of buffer above your tallest current equipment.
Mistake 2: Choosing a developer based on the highest lease rate without reading the operating restrictions. A €2,500/hectare lease that prohibits chemical sprays, requires 30-day operations notice, and bans tillage above 30 cm depth may be worth less than a €1,500/hectare lease with normal farming rights. Read the operating annex line by line.
Mistake 3: Underestimating insurance and liability. Agrivoltaic structures introduce new liabilities — third parties on the farm for maintenance, equipment-strike risk on panels, and crop damage claims if the structure causes shading-related yield loss. Confirm who carries which insurance and at what coverage level before signing.
Mistake 4: Ignoring the harvest window in the construction schedule. Construction crews on the field during harvest will compact soil for years. Build the construction calendar around your harvest, not the developer’s preferred schedule.
Mistake 5: Treating the crop side as an afterthought. The whole economic case for agrivoltaics over standard ground-mount lease rests on continued crop income. If you let the crop side drift — change rotation without checking shading impact, drop irrigation maintenance under panels, skip the annual yield baseline — you lose subsidy compliance, lease bonuses, and potentially the right to operate the project.
The good news is that all five mistakes are paperwork problems, not engineering problems. A careful contract, a thorough operating annex, and an annual yield review prevent every one of them.
Pro Tip — Reserve a small test plot before going full-scale
If you are committing 5 hectares or more to a 25-year agrivoltaic agreement, ask the developer to install a 0.2 to 0.5 hectare pilot first. Run one full crop cycle under panels before scaling. The pilot data settles every yield argument with lenders and gives you a defensible baseline for the operating contract.
Conclusion: Your Next Three Steps
Agrivoltaics is no longer experimental. The system types are mature, the subsidy frameworks exist, and the lease rates are real. What is missing on most farms is a disciplined evaluation process — and the willingness to walk away from the first developer offer. If you take three actions from this guide, take these:
- Map your candidate fields and rank them. Lowest current yield, best grid access, no environmental restrictions. Pick one. Do not start with your best field.
- Get three independent developer offers and compare on more than the headline lease rate. Read the operating restrictions, the yield guarantee, the decommissioning bond, and the duration. The cheapest CAPEX number is rarely the best 25-year deal.
- Run a side-by-side financial model on lease, own, and joint venture for the same field, same system type. Decide which structure matches your capital, risk tolerance, and long-term plan for the farm.
Done well, an agrivoltaic project converts a marginal field into the most profitable acre on the operation while maintaining the agricultural identity of the land. Done badly, it locks the farm into 25 years of conflict between two operating partners on the same plot. The difference is upfront design discipline, and that starts with a clear-eyed look at what your farm actually needs.
Frequently Asked Questions
What is an agrivoltaic system in simple terms?
An agrivoltaic system uses the same plot of land for both solar electricity and agricultural production. Panels are mounted high enough or spaced wide enough to let crops grow underneath or between them, and the farmer earns income from both the harvest and the power generated.
How much does an agrivoltaic system cost per acre or per megawatt?
Installed cost ranges from $1.50/W for low-clearance grazing systems to $2.33/W for tall combine-clearance arrays — roughly 20 to 50 percent more than standard ground-mount solar. Per acre, expect $250,000 to $450,000 for a 1 MW elevated system depending on row spacing and structure type.
Which crops grow best under solar panels?
Shade-tolerant and heat-sensitive crops perform best. Lettuce, spinach, basil, herbs, strawberries, blueberries, peppers, tomatoes, potatoes, kale, and pasture grass for grazing all show neutral or improved yields under partial shading. Wheat, corn, and soybeans are light-hungry and need very low panel densities to avoid losses.
How much can a farmer earn from leasing land for an agrivoltaic project?
European land lease rates for agrivoltaics range from €800 to €2,500 per hectare per year — three to ten times conventional cropland rent. In the US, lease rates run $700 to $1,400 per acre per year. Joint ventures with revenue sharing typically split power income 60/40 or 70/30 in favor of the developer, with the farmer retaining all crop revenue.
Do crops actually grow well under solar panels, or do they suffer?
It depends on the crop and the system design. Fraunhofer ISE recorded a Land Equivalent Ratio of 1.56 to 1.87 at the Heggelbach project in Germany for potatoes, wheat, and celeriac. For shade-tolerant crops in hot regions, agrivoltaics often raises yield by 5 to 20 percent because panels reduce heat stress and water loss. For shade-intolerant crops in temperate zones, expect a 10 to 30 percent yield reduction.
What subsidies exist for farmers building agrivoltaic systems?
Germany, France, Italy, Japan, and several US states offer agrivoltaic-specific feed-in tariffs, tax credits, or grant programs. Germany’s EEG 2023 includes a dedicated agrivoltaic auction segment. France pays a premium tariff under the 2024 APV decree. The US Rural Energy for America Program (REAP) covers up to 50 percent of project cost for qualifying farms. Eligibility usually requires maintaining at least 66 percent of pre-installation crop yield.
How long does it take to build an agrivoltaic project on a working farm?
From first feasibility study to commissioning, a project under 500 kW typically takes 9 to 14 months. Projects above 1 MW take 18 to 30 months because of grid interconnection studies and environmental permitting. The construction window itself runs 3 to 6 months and should be scheduled outside the planting and harvest seasons.
Will an agrivoltaic system limit how I can use my farm equipment?
Only if the clearance is too low for your equipment. Specify panel height to clear the tallest piece of equipment in your fleet plus 0.5 meters of buffer. Combine harvesters need 4.5 to 5.5 meters, standard tractors need 3.5 meters, and grazing systems need only 1.5 to 2 meters. Row spacing should be a clean multiple of your boom or implement width.


