

Most solar designers pick a DC/AC ratio the same way they pick a lunch order: they use what worked last time. A 1.20 ratio for residential, a 1.25 ratio for commercial, maybe 1.30 for ground-mount. That habit is expensive. Module prices have fallen faster than inverter prices for a decade, and every project now has a different price curve, export rule, and weather file. A ratio that is optimal in Stuttgart can be wasteful in Surat, and a ratio that wins in Phoenix can underperform in Plymouth.
This guide treats the solar DC/AC ratio as a design decision with rules, not as a rule of thumb. We cover the math, the segment-specific ranges, the clipping tradeoff, the warranty boundaries, and the modelling workflow. The goal is to help installers, EPCs, and project developers choose a ratio that is defensible to a customer, a lender, and a utility interconnection engineer. For a deeper look at the mechanics of clipping itself, see our guide on solar inverter clipping and DC oversizing.
Quick Answer
The solar DC/AC ratio compares array DC capacity to inverter AC capacity. Ratios of 1.20-1.30 work for most residential systems, 1.25-1.40 for commercial roofs, and 1.30-1.45 for utility-scale plants. A small amount of annual clipping is usually profitable because the extra DC capacity captures more morning, evening, and winter energy than it loses at midday.
In this guide:
- How to calculate and interpret the DC/AC ratio
- Why the ratio is a cost-yield tradeoff, not a fixed number
- Design rules for residential, commercial, utility, and battery-hybrid systems
- How climate, bifacial modules, and trackers shift the optimum
- Warranty and code boundaries that limit how far you can oversize
- A worked 25-year example for a 10 kW residential system
- Common mistakes and how to avoid them
- Tools and modelling workflow to verify your choice
What Is the Solar DC/AC Ratio?
The DC/AC ratio, also called the inverter loading ratio or ILR, compares the array’s total DC nameplate capacity to the inverter’s rated AC output capacity.
Formula:
DC/AC ratio = Array DC capacity (kWp) ÷ Inverter AC rating (kWac)
A 7.5 kWp array on a 6 kWac inverter gives a ratio of 1.25. A 12 kWp array on a 10 kWac inverter gives 1.20. A 100 MWp DC field with 75 MWac of inverters gives 1.33.
Two points matter for accuracy. First, use the inverter’s continuous AC output rating, not a peak or temporary overload figure. Second, the ratio is based on STC module nameplate. Real output is almost always lower because of temperature, soiling, wiring losses, and module mismatch. This is why a ratio above 1.0 does not mean the inverter is continuously overloaded. It means the array is sized to keep the inverter productive for more hours per year.
The term is defined in more detail in our inverter loading ratio glossary entry. Related concepts like inverter clipping and inverter sizing have their own entries as well.
Why the DC/AC Ratio Is a Cost-Yield Tradeoff
Inverters are expensive per kilowatt. Modules are cheap per kilowatt. A designer who matches inverter and array capacity exactly buys a lot of AC hardware. That hardware will sit underutilised for most of the day.
On a typical clear day, an inverter reaches its rated AC output for only two to four hours around solar noon. For the other six to eight daylight hours it runs at 20 to 70 percent of capacity. Adding 20 to 30 percent more DC module capacity pulls the inverter closer to its efficient, full-output operating point during those shoulder hours. The cost is a short midday plateau where output is capped. The benefit is more total kilowatt-hours across the year.
The financial logic is simple. If the extra modules cost less than the energy they capture, after subtracting the clipped energy, the project wins. This is why utility-scale solar has pushed the US capacity-weighted average DC/AC ratio upward. It rose from about 1.18 in 2010 to roughly 1.34 in 2024, according to the NREL Annual Technology Baseline, 2024.
The same logic applies at residential scale, but the numbers are smaller and the constraints are different. A homeowner does not care about LCOE in the same way a utility owner does. A homeowner cares about payback, bill offset, and whether the monitoring app shows a flat line at noon.
The Clipping Tradeoff Explained
Clipping is the energy the inverter throws away because it is already at its AC limit. Think of a highway on-ramp meter. During rush hour the meter limits how many cars enter the freeway, but the road still carries its maximum useful traffic. The cars that are turned away are the clipped energy.
Clipping happens when three conditions line up:
- Solar irradiance is high enough to push array DC power above the inverter AC rating.
- Module temperature is low enough that the array actually produces close to its nameplate.
- The DC/AC ratio is above 1.0, so the inverter is the bottleneck rather than the array.
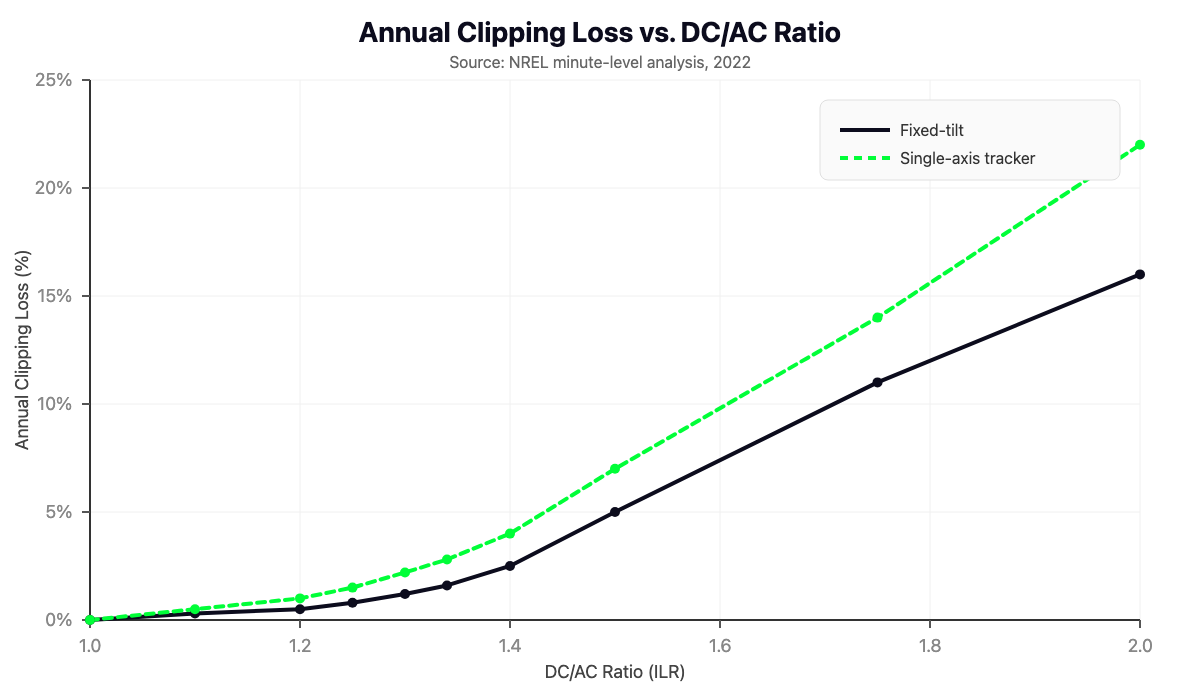
The key insight is that clipping is a small slice of annual energy. Panels rarely reach STC output, and clear-sky noon conditions are a minority of annual hours. NREL minute-level analysis (Anderson et al., 2022) shows a clear pattern. Annual clipping stays under 1 percent at a 1.25 ratio for fixed-tilt systems. It only rises sharply above 1.50. The full report is available from NREL, 2022. Sandia’s inverter model describes how inverters convert DC input power to AC output and where the saturation limit occurs, as documented by Sandia PVPMC, 2024.
| DC/AC Ratio | Typical Annual Clipping (Fixed-Tilt) | Typical Annual Clipping (Single-Axis Tracker) |
|---|---|---|
| 1.10 | under 0.3% | under 0.5% |
| 1.20 | 0.5% | 1.0% |
| 1.25 | 0.8% | 1.5% |
| 1.30 | 1.2% | 2.2% |
| 1.34 | 1.6% | 2.8% |
| 1.40 | 2.5% | 4.0% |
| 1.50 | 5.0% | 7.0% |
| 2.00 | 16.0% | 22.0% |
Source: NREL minute-level analysis, 2022.
The table shows why the tradeoff is attractive in the 1.20 to 1.40 range. You gain 8 to 12 percent more annual energy from the extra DC capacity while losing only 1 to 3 percent to clipping. Trackers clip more at the same ratio because they hold the array at a better angle for more hours. That is why tracker plants often use a slightly lower ratio than fixed-tilt plants on the same site.
Design Rules by Market Segment
The right ratio is not universal. Below are practical starting ranges for 2026. Use site-specific modelling to move within each band.
Residential Rooftop: 1.20 to 1.30
Most residential systems in the US, UK, and Germany should land here. A 6.5 kWp array on a 5 kW inverter is a common 1.30 ratio design. The roof area is usually the limiting factor, so oversizing the DC relative to the inverter makes better use of available space and hardware.
Rules for residential:
- Stay within the inverter manufacturer’s max DC input power.
- Check the MPPT current limit if you parallel strings on a single tracker.
- Respect local interconnection rules. Some US utilities cap the ratio at 1.30 or 1.50.
- In hot climates like India or Australia, ratios of 1.30 to 1.50 are common because temperature derating reduces clipping.
The UK residential average reached 1.28 in 2024, up from 1.15 in 2020, according to Solar Energy UK, 2024. The rise reflects cheaper modules and the acceptance of small clipping losses in cloudy climates.
Commercial and Industrial Rooftop: 1.25 to 1.40
Commercial roofs reward higher ratios because the load profile is flatter. A factory or warehouse consumes power from early morning through late afternoon. Extra DC capacity increases generation during those shoulder hours, which directly offsets retail electricity purchases.
| Commercial Segment | Typical DC/AC Ratio | Notes |
|---|---|---|
| Small commercial, under 100 kW | 1.20-1.30 | Often constrained by inverter SKU availability |
| Mid commercial, 100 kW to 1 MW | 1.25-1.35 | Sweet spot for tariff-driven C&I |
| Large C&I, 1 MW to 5 MW | 1.30-1.40 | LCOE optimisation with export limits |
| C&I with DC-coupled storage | 1.35-1.60 | Battery absorbs clipped energy |
For larger commercial projects, use SurgePV’s solar design software to compare ratios against the actual load profile and tariff structure.
Utility-Scale Ground-Mount: 1.30 to 1.45
Utility-scale projects have the most freedom to optimise because land, labour, and module costs are relatively predictable. The US capacity-weighted average sits near 1.34 (NREL ATB, 2024). Lawrence Berkeley National Laboratory’s Utility-Scale Solar, 2024 Edition notes that the median ILR in 2023 was 1.34, with fixed-tilt projects averaging 1.38 and tracking projects 1.32. Newer projects in regions with low module prices and shaped PPAs are pushing 1.40 to 1.45.
Fixed-tilt plants usually sit at 1.25 to 1.35. Single-axis tracker plants sit at 1.35 to 1.45 because the tracker stretches the production curve and makes higher oversizing pay off. Bifacial tracker plants need care. Rear-side gain adds effective DC power, so designers often keep the ratio at 1.30 to 1.40. This avoids clipping away the bifacial premium.
Solar-Plus-Storage: 1.35 to 1.60
DC-coupled batteries change the equation. Surplus DC that would otherwise clip can charge the battery pack. A 1.50 ratio with a DC-coupled battery can deliver lower net clipping than a 1.30 ratio without storage. AC-coupled batteries cannot recover clipped energy because the solar inverter has already limited the AC output.
For storage sizing, match the battery charge power to the expected clipped peak and the battery capacity to the evening discharge window. See our commercial battery storage sizing guide for the full method.
Climate and Geography Corrections
Climate shifts the optimum more than most designers admit. Two variables dominate: how often the array reaches clear-sky peak power, and how hot the modules run.
Cool, clear, high-altitude sites. Locations like Denver, Madrid in winter, or the Atacama Desert push modules close to STC power. The same 1.30 ratio clips more here than in a hot climate. Ratios of 1.15 to 1.25 are usually safer.
Hot, sunny sites. Gujarat, Rajasthan, Arizona, and Queensland all run modules at 65 to 75 °C cell temperature at solar noon. A 540 Wp module may deliver only 400 to 420 W. This natural derating means a 1.35 ratio clips far less than the datasheet suggests. Indian utility projects commonly use 1.30 to 1.45.
Cloudy, temperate sites. The UK, Germany, and the Pacific Northwest rarely see clear-sky noon peaks. Ratios of 1.25 to 1.40 make sense because the inverter is the bottleneck on only a handful of days per year.
High-albedo, snowy sites. Snow reflection raises effective irradiance and can push bifacial or high-tilt arrays above STC predictions. Designers in snowy climates sometimes lower the ratio by 0.05 to 0.10 to protect against spring clipping events.
Technology Multipliers
The DC/AC ratio interacts with module technology, mounting, and power electronics.
Bifacial Modules
Bifacial modules add rear-side generation. On a single-axis tracker with light-coloured ground, the effective DC gain can be 8 to 15 percent. If you size the DC/AC ratio using only front-side STC power, the real ratio is higher. Many designers therefore target a nominal ratio 0.05 to 0.10 lower for bifacial tracker projects than they would for monofacial fixed-tilt.
Read our bifacial solar panel design guide for the field-measured gain table by mounting type.
Trackers
Single-axis trackers extend the daily production curve. The array produces more in the morning and evening, and the peak is broader. This makes higher DC/AC ratios economical because the extra capacity is productive for more hours. However, trackers also clip more at the same ratio because the peak is higher and longer. Most tracker plants land at 1.35 to 1.45.
Optimizers and Microinverters
Module-level power electronics clip at each panel or microinverter, not at a central inverter. Enphase microinverters, for example, typically allow DC/AC ratios of 1.30 to 1.45 depending on the module pairing. The total system clipping is similar in magnitude but distributed across many units. It can be harder to spot in monitoring unless the portal flags per-panel clipping.
Warranty and Code Boundaries
The DC/AC ratio is a design lever, but the inverter datasheet and local rules define the box you can move it in.
Manufacturer Max DC Input
Every inverter publishes a maximum DC input power and a maximum DC input current per MPPT. Exceed either and the warranty is at risk. The table below shows typical limits from current datasheets.
| Inverter | AC Nameplate | Max DC Input | Implied Max DC/AC Ratio |
|---|---|---|---|
| Fronius Symo 20.0-3 | 20 kWac | 30 kWdc | 1.50 |
| Sungrow SG110CX | 110 kWac | 165 kWdc | 1.50 |
| Sungrow SH10RT | 10 kWac | 15 kWdc | 1.50 |
| SMA Sunny Tripower CORE2 110 | 110 kWac | 165 kWdc | 1.50 |
| Huawei SUN2000-100KTL | 100 kWac | 150 kWdc | 1.50 |
| Enphase IQ8M | 0.33 kWac | 0.475 kWdc | 1.44 |
Source: manufacturer datasheets, 2025-2026.
A common warranty trap is exceeding the MPPT current limit while staying under the total DC power limit. Two parallel strings on one MPPT can push the short-circuit current above the 25 A to 30 A limit. The inverter may fail in year three, and the manufacturer can refuse cover.
Electrical Codes
The US National Electrical Code, Article 690, does not cap the DC/AC ratio directly. It requires that DC conductors and overcurrent protection be sized for the array’s maximum short-circuit current multiplied by 1.56. Some utility interconnection agreements, especially in Hawaii, California, and New Jersey, do impose ratio caps of 1.30 or 1.50.
In India, MNRE and CEA guidelines recommend DC/AC ratios of 1.10 to 1.35 for grid-connected plants depending on application and climate. Large solar plants must justify inverter sizing in the detailed project report, including a clipping analysis.
Export Caps and Curtailment
Where the grid limits AC export, a very high DC/AC ratio can waste energy twice: once from clipping, and again from curtailment. In export-capped systems, model clipping and curtailment as a single combined limit, not as separate losses. If the grid will not accept the inverter’s full AC output, the inverter never reaches its clipping ceiling.
Worked Example: 10 kW Residential System
Here is a concrete comparison for a 10 kWp residential array in a moderate US climate. The inverter is sized differently for each ratio, and module cost is assumed at $0.10/W.
| Parameter | Ratio 1.00 | Ratio 1.25 | Ratio 1.40 |
|---|---|---|---|
| Array DC | 10.0 kWp | 10.0 kWp | 10.0 kWp |
| Inverter AC | 10.0 kWac | 8.0 kWac | 7.1 kWac |
| Annual generation | 14,000 kWh | 15,050 kWh | 15,200 kWh |
| Annual clipping | 0% | 1.0% | 2.5% |
| Inverter cost | $3,200 | $2,500 | $2,200 |
| 25-year energy value at $0.15/kWh | $52,500 | $56,438 | $57,000 |
| Net benefit vs 1.00 ratio | baseline | +$3,238 | +$3,280 |
The 1.25 ratio captures most of the benefit with only 1 percent clipping. The 1.40 ratio adds marginal energy but requires a smaller inverter that may have less headroom for future expansion or hot-weather peaks. For most homeowners, 1.20 to 1.30 is the practical sweet spot.
A similar UK analysis uses a 4.8 kWp array on a 3.68 kW G98 inverter at 1.30 ratio. It shows roughly £229 net annual benefit from oversizing compared with a unity-ratio design. The calculation uses the NREL Bolinger 2019 empirical clipping curve and UK peak sun hours from Solar Calculator HQ, 2026.
Common Mistakes and Misconceptions
Copying the last project’s ratio. A ratio that worked in Germany does not transfer to Arizona. Irradiance, temperature, tariff, and export rules all change the optimum.
Optimising for total kWh instead of value. The goal is usually to maximise NPV, IRR, or bill offset, not annual generation. If the PPA pays less at noon, a higher ratio that shifts production to shoulder hours can be more valuable even if total kWh falls.
Confusing clipping with curtailment. Clipping is an inverter-side limit. Curtailment is a grid-side command. They look similar on a production chart but have different causes and fixes.
Ignoring degradation. With 0.4 to 0.5 percent annual degradation, a 1.40 ratio in year one becomes roughly 1.28 in year 15. Some designers intentionally start high to maintain inverter utilisation later in the project life.
Forgetting bifacial gain. A bifacial tracker with 12 percent rear gain effectively has a higher DC/AC ratio than the nameplate suggests. If you do not account for this, you can clip away part of the bifacial premium.
Overlooking MPPT current. Total DC power can be within limits while a single MPPT is overcurrented. This is the most common warranty-voiding mistake we see in audits.
How to Model and Verify the DC/AC Ratio
A defensible ratio comes from time-series simulation, not from a table.
Step 1: Build the base design. Enter the site location, array size, tilt, azimuth, module type, and inverter model in PVsyst, NREL SAM, or NREL PVWatts.
Step 2: Run a ratio sweep. Test at least four ratios, for example 1.10, 1.25, 1.40, and 1.55 if storage is in scope.
Step 3: Record annual energy and clipping. Use minute-level data for ratios above 1.40. Hourly models underestimate clipping because they smooth sub-hourly irradiance spikes.
Step 4: Feed energy into financial model. Use the actual tariff or PPA shape. A flat PPA values kWh equally. A time-of-use tariff values shoulder hours more. A net-billing regime may value exported clipped energy at zero.
Step 5: Check hardware limits. Confirm max DC input power, max DC input current per MPPT, MPPT voltage window at temperature extremes, and any local ratio cap.
Step 6: Validate in operation. After commissioning, compare actual inverter AC output against irradiance on clear days. A flat plateau at the inverter AC limit while irradiance is still rising confirms clipping. If the plateau sits below the AC limit, the cause is likely curtailment or a setting issue.
SurgePV’s shadow analysis module helps identify shading hours that reduce effective DC power and clipping, giving a more accurate ratio recommendation than a pure weather file.
Conclusion
The solar DC/AC ratio is one of the highest-leverage design choices in a PV project. Pick it well and you lower cost, increase annual yield, and keep the inverter in its efficient operating zone. Pick it blindly and you either overpay for AC capacity or clip away the value of extra modules.
Three actions to take from this guide:
- Stop using a single default ratio. Choose a starting range based on market segment and climate, then model at least three ratios with site-specific weather and tariff data.
- Check the inverter datasheet twice. Verify both total max DC input power and max DC input current per MPPT before finalising string design.
- Treat clipping as a cost line item, not a failure. If the financial model shows that the extra DC capacity pays for itself after clipping, the ratio is doing its job.
Project teams can run ratio sweeps, clipping analysis, and financial optimisation in one workflow. SurgePV’s solar design software models the DC/AC ratio against real irradiance, load, and equipment limits.
FAQ
What is a good DC/AC ratio for solar?
A good DC/AC ratio depends on the project type and climate. Most residential systems land between 1.20 and 1.30. Commercial rooftops typically use 1.25 to 1.40. Utility-scale plants often design for 1.30 to 1.45. Cloudy or cool climates can support slightly higher ratios because panels rarely reach peak output. Hot, sunny climates need more conservative ratios to limit clipping.
How do you calculate the DC/AC ratio?
Divide the total DC nameplate capacity of the array by the inverter AC output rating. For example, a 7.8 kWp array connected to a 6 kWac inverter gives a DC/AC ratio of 1.30. The same number is also called the inverter loading ratio, or ILR. Always use the continuous AC nameplate from the datasheet, not a peak or surge rating.
What is inverter clipping and why does it happen?
Inverter clipping happens when the DC power from the array exceeds the inverter AC output limit. The inverter caps its output at its rated AC capacity and the surplus is shed. Clipping occurs around solar noon on clear days when the array is producing most. It is intentional and economically justified when the annual energy gained from extra DC capacity outweighs the clipped midday loss.
Does a higher DC/AC ratio always produce more energy?
No. Up to about 1.40, the extra morning, evening, and shoulder-hour energy usually exceeds midday clipping losses. Above 1.45 to 1.50, clipping rises faster than the added capacity can recover, so annual energy and project returns often fall. The exact turning point depends on irradiance, temperature, tracker use, and whether storage can absorb clipped power.
How much clipping loss is acceptable?
Most bankable designs accept 1 to 3 percent annual clipping. Up to 1 percent is common for conservative residential projects. Utility-scale plants often accept 2 to 4 percent when the resulting LCOE reduction is larger than the lost energy value. Above 5 percent, clipping usually starts to hurt returns unless a DC-coupled battery is recovering most of the surplus.
Can DC oversizing void the inverter warranty?
Yes, if the array exceeds the inverter’s published maximum DC input power or current per MPPT. Many string inverters allow 150 to 200 percent DC oversizing, but the limit is per model and sometimes temperature-dependent. Exceeding the max DC input current on a single MPPT can void the warranty even if total DC power looks acceptable. Always check the datasheet and design strings within the MPPT voltage and current windows.
How does climate affect the DC/AC ratio?
Hot climates reduce real module output through temperature derating, so higher ratios clip less than they would on paper. Cool, clear, high-altitude sites push panels closer to STC power, so the same ratio clips more. Cloudy climates rarely reach peak DC and can support higher ratios. Desert sites with high irradiance and occasional cool mornings need careful modelling because clear-sky days create sharp clipping spikes.
How do batteries change the DC/AC ratio decision?
DC-coupled batteries let designers use higher ratios because surplus DC can charge the battery instead of being clipped. Ratios of 1.35 to 1.60 are common for commercial solar-plus-storage systems. AC-coupled batteries cannot recover clipped energy because the solar inverter has already limited the AC output. The battery inverter and charge power must be sized to match the expected clipped peak.
Where this fits
This article is part of SurgePV's Solar Design hub, which works through the topic from first principles to the decisions a project team actually has to make.


