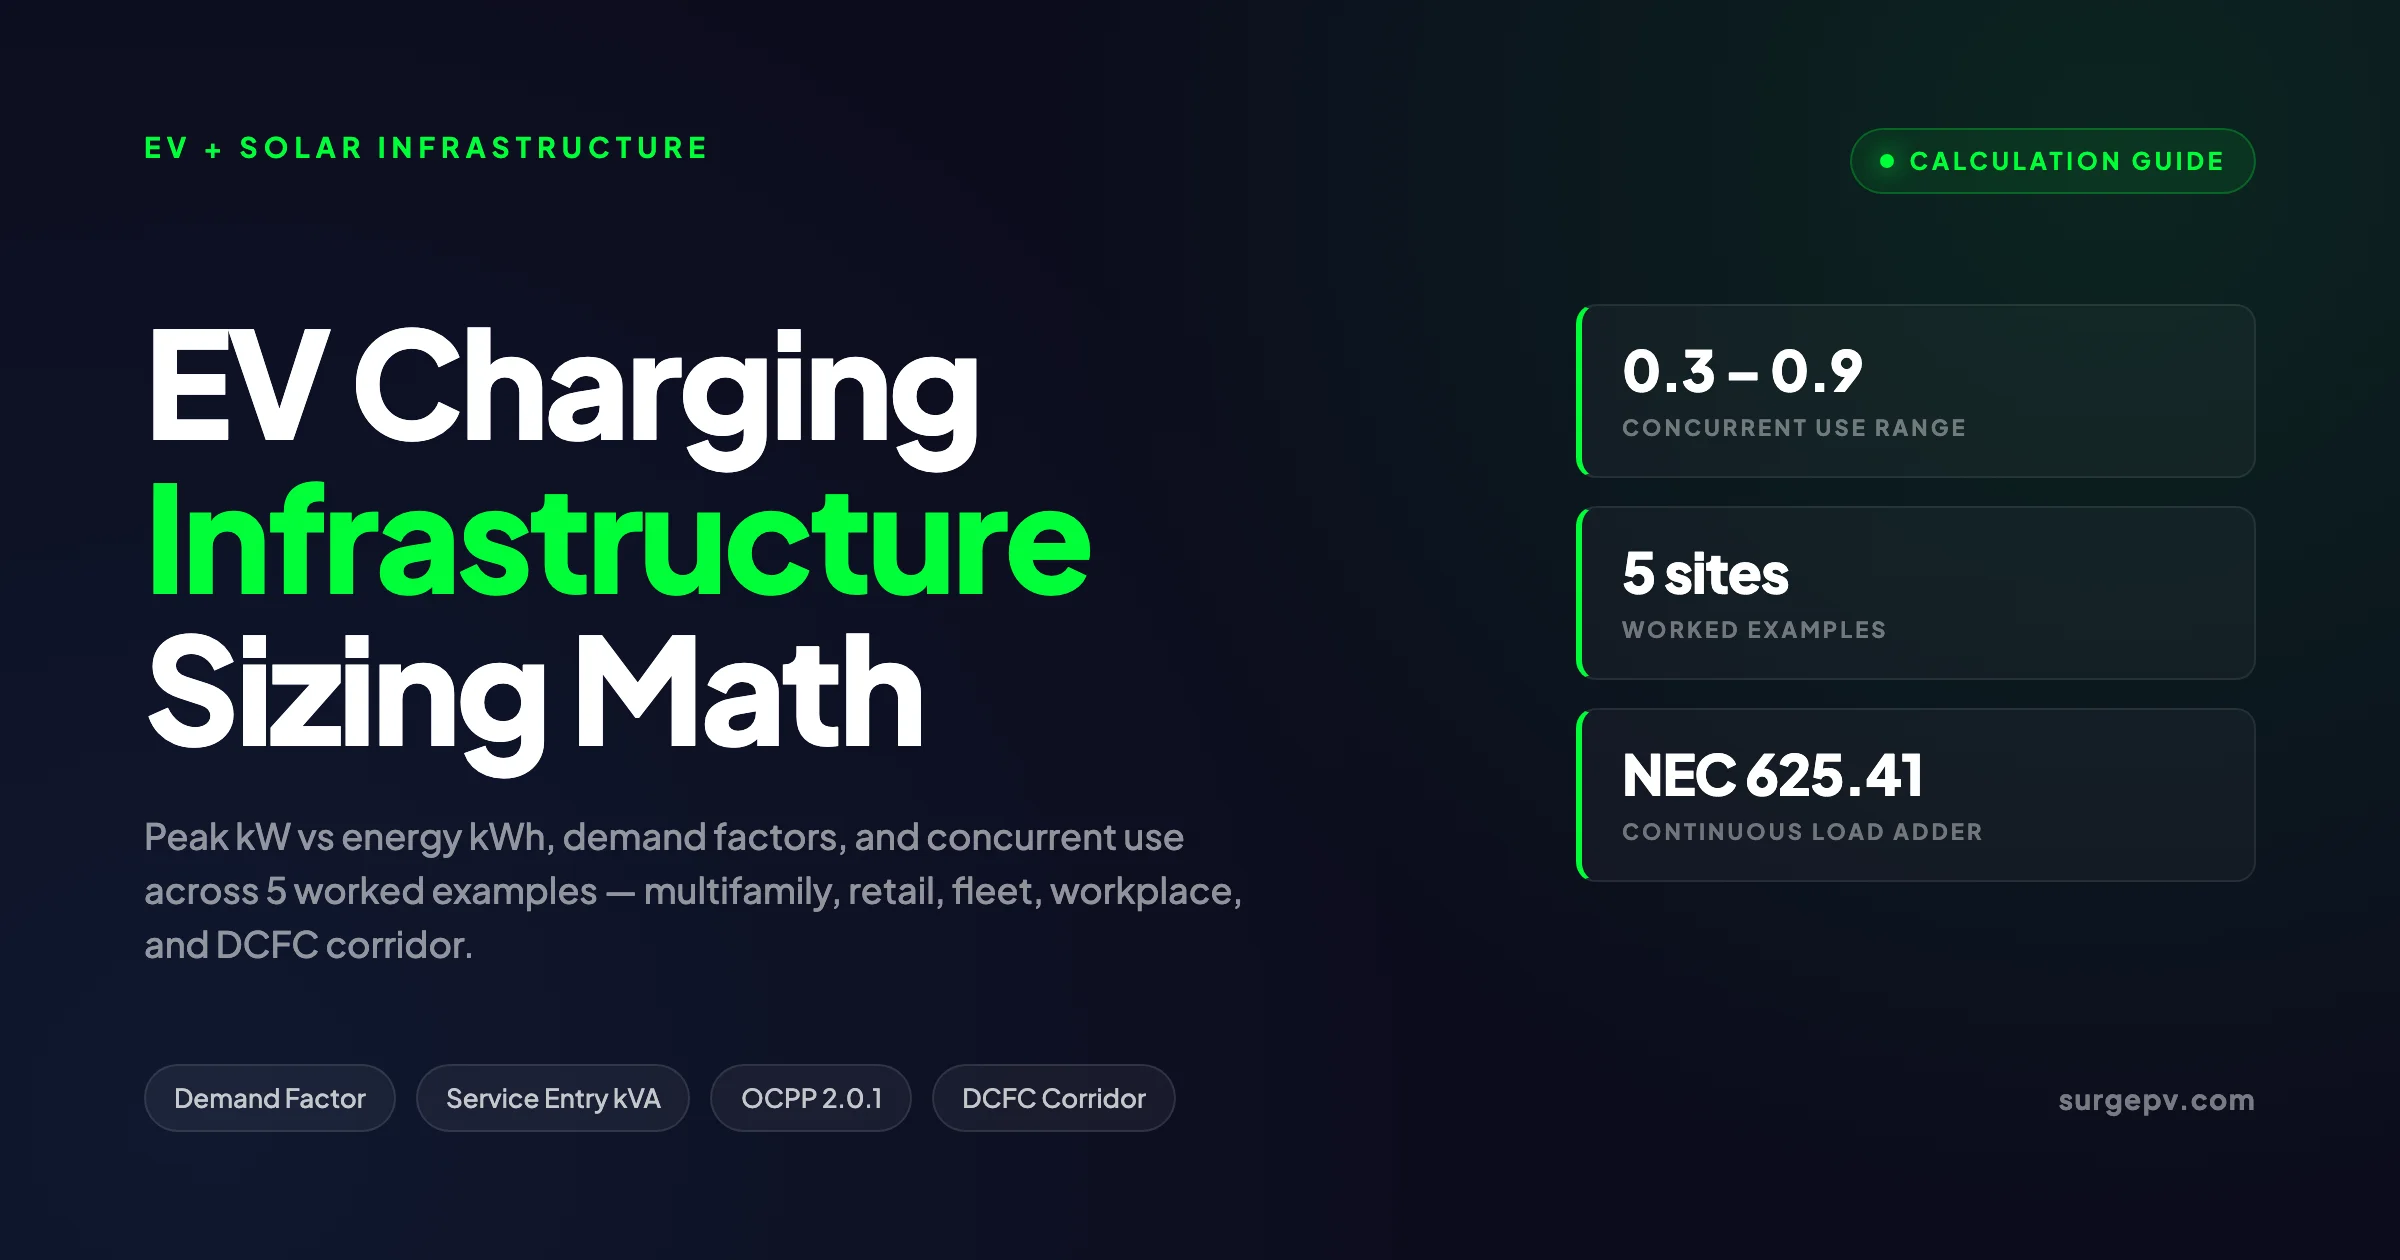
Quick Answer
The original design used a 100% concurrent factor on the full nameplate of fifty 11.5 kW chargers, sizing the service for 575 kW. A 10 port multifamily garage delivering 200 kWh per day across an eight hour overnight window draws 25 kW average and roughly 60 kW peak under random arrival.
A misjudged demand factor on a 50 port workplace EV charging project in the Bay Area cost the developer an unplanned $187,000 transformer upgrade after six months of operation. The original design used a 100% concurrent factor on the full nameplate of fifty 11.5 kW chargers, sizing the service for 575 kW. The utility installed a 750 kVA pad mount. Eight weeks after launch, evening peak charging from 5 PM to 7 PM hit 487 kW on a hot day, and the transformer cooked itself trying to ride out a 130% overload. The replacement, the new switchgear, and the eight day outage cost the developer almost twice the original electrical scope. The error was not the transformer. The error was assuming nameplate equals real load.
The original design used a 100% concurrent factor on the full nameplate of fifty 11.5 kW chargers, sizing the service for 575 kW. A 10 port multifamily garage delivering 200 kWh per day across an eight hour overnight window draws 25 kW average and roughly 60 kW peak under random arrival.
This guide covers the full 2026 picture for installers, fleet electrification engineers, charge point operators, and AHJs sizing real projects. It distinguishes peak kW from energy kWh, walks through diversity and demand factors by site type, applies IEC 61851, SAE J1772, NEC 625, and EU AFIR rules where they bind, and runs five worked examples from a 10 port multifamily garage to a 4 port 350 kW DCFC corridor site. The math is the same math that solar design software automates inside its DC and AC layout engine, but the principles must be understood before the software output is trusted on a single line diagram.
TL;DR: EV Charging Sizing Quick Reference
Peak kW sets the service entry and transformer. Energy kWh sets the utility bill and solar offset. Concurrent use factor (also called demand factor) varies from 0.3 at retail to 1.0 at fleet depots. Apply diversity first, NEC 625.41 125% adder second. NEC 220.85 energy management systems can cut service upgrade cost by 40 to 60% on retrofit projects. EVI-Pro Lite (NREL/DOE, 2024) is for portfolio planning, not single-site sizing.
What this guide covers:
- The peak kW vs energy kWh distinction and why both numbers matter
- Demand factor and concurrent use for residential, workplace, retail, multifamily, and fleet sites
- Level 1, Level 2, and DC fast charging power envelopes and their effective contribution to peak
- Service entry capacity math: ports times rating times concurrent factor, with NEC 625.41 adders
- Diversity factor curves by site type and arrival pattern
- Transformer and switchgear sizing methodology with utility margin assumptions
- kWh throughput modeling: vehicles per day times average session energy
- 5 worked examples covering 10 port garage, 20 port retail, 50 port fleet, 100 port workplace, 4 port DCFC
- How solar design software integrates EVSE load profiles into site-level energy and demand modeling
The Peak kW vs Energy kWh Distinction
EV charging sizing has two completely separate dimensions that must not be confused. Most early sizing errors come from mixing them up.
Peak kW is the instantaneous power flow at the worst minute of the day or week. It sets:
- Service entry size (amps at line voltage)
- Distribution transformer kVA rating
- Switchgear, panelboard, and feeder conductor sizing
- Utility demand charge bracket and tariff classification
- Generator backup sizing for fleet depots
Energy kWh is the total electricity delivered to vehicles per day, week, or year. It sets:
- Total utility energy bill
- Solar PV array offset opportunity
- Battery storage sizing if behind-the-meter shaving is in play
- Throughput capacity in vehicles per day for a site business case
Two sites can have identical kWh throughput and wildly different peak kW. A 10 port multifamily garage delivering 200 kWh per day across an eight hour overnight window draws 25 kW average and roughly 60 kW peak under random arrival. A retail site delivering the same 200 kWh per day across a 90 minute lunchtime window draws 133 kW average and 180 to 200 kW peak. The retail site needs roughly triple the service entry capacity to deliver the same energy.
| Site Type | Daily kWh | Peak Window | Peak kW | Service Entry Required |
|---|---|---|---|---|
| Multifamily overnight | 200 | 8 hrs | 60 | 75 kW |
| Workplace daytime | 200 | 4 hrs | 90 | 110 kW |
| Retail lunchtime | 200 | 1.5 hrs | 180 | 220 kW |
| DCFC corridor | 200 | 0.5 hrs | 350 | 400 kW |
This is why the energy management strategy (when to charge, not just how much) drives the capital cost of the electrical infrastructure more than any other lever. The kWh side of the balance sheet stays the same. The kW side moves by a factor of five.
Service Capacity Calculation
The core formula for sizing any EV charging site service entry is:
Peak kW = Number of Ports × Per-Port Rating × Concurrent Use Factor
Then convert to amps and apply NEC 625.41 continuous-load multipliers where the chargers run longer than three hours, which they almost always do.
Step by Step
- List all ports and the nameplate kW of each. Mixed-rating sites are common (some 7 kW, some 11.5 kW, some DCFC).
- Apply a concurrent use factor based on site type, charger access pattern, and whether an EMS is in place.
- Multiply ports × per-port × concurrent to get the connected EVSE load in kW.
- Add baseline non-EVSE load (lighting, HVAC, elevators, refrigeration).
- Apply NEC 625.41 continuous-load adder of 125% to the EVSE portion only.
- Divide by line voltage and (for three phase) by 1.732 to get amps.
- Round up to the next standard breaker, then add 25% utility margin for the transformer kVA.
Worked Number: 20 Port Office Garage
Twenty 11.5 kW Level 2 chargers, 60% workplace concurrent use, 415 V three phase service.
- Connected EVSE load = 20 × 11.5 × 0.60 = 138 kW
- NEC 625.41 continuous adder = 138 × 1.25 = 172.5 kW
- Add 25 kW for lighting and HVAC = 197.5 kW total
- Amps at 415 V three phase = 197,500 / (415 × 1.732) = 275 A
- Round to 300 A service entry
- Transformer kVA at 0.9 PF and 25% margin = (197.5 / 0.9) × 1.25 = 274 kVA → 300 kVA pad mount
This is dramatically different from a naive calculation that would have used 20 × 11.5 = 230 kW × 1.25 = 287 kW and arrived at a 400 A, 400 kVA service. The 40% concurrent-use reduction is the single largest cost lever on a typical workplace project.
Demand Factor and Concurrent Use by Site Type
The concurrent use factor (also called demand factor or diversity factor depending on the standard) is the heart of the calculation. Get this number right and the rest is straightforward. Get it wrong and the site is either dramatically oversized or fails after six months.
Empirical Demand Factors
| Site Type | Concurrent Use Range | Recommended Design Factor | Source |
|---|---|---|---|
| Residential cluster (unmanaged) | 0.40 – 0.60 | 0.55 | NREL EVI-Pro residential profiles (2024) |
| Multifamily overnight | 0.60 – 0.90 | 0.75 | Workplace charging coalition data |
| Workplace daytime | 0.50 – 0.80 | 0.65 | ChargePoint network utilization (2024) |
| Retail / grocery | 0.30 – 0.50 | 0.40 | EVgo utilization reports (2024) |
| Hotel destination | 0.40 – 0.65 | 0.50 | Tesla destination charging program data |
| Fleet depot (overnight) | 0.80 – 1.00 | 0.90 | US DOE AFDC fleet charging guide |
| DCFC corridor | 0.40 – 0.70 | 0.55 | EVgo Q4 2024 utilization (~22% annual, ~55% peak) |
| Highway megacharger | 0.50 – 0.75 | 0.65 | Tesla Supercharger V4 site planning |
| Bus depot | 0.85 – 1.00 | 0.95 | Proterra and Heliox depot operator data |
| Drayage truck depot | 0.90 – 1.00 | 0.95 | CARB Advanced Clean Fleets data |
These factors come from observed utilization on real networks, not from theoretical worst case scenarios. Workplace concurrent use peaks in the 8:30 to 10:30 AM arrival window when most drivers plug in within thirty minutes of arrival. Retail concurrent use is depressed by the natural rotation of vehicles (the average session is 45 to 75 minutes against an open hours window of 12+ hours). Fleet depots run near 1.0 because the entire fleet plugs in at shift end and stays plugged in until next shift.
Why the Range Matters
Picking 0.5 vs 0.7 for a 100 port workplace site is the difference between a 403 kW service and a 564 kW service. The transformer step changes from 500 kVA to 750 kVA. The cost delta is typically $90,000 to $140,000 in switchgear, transformer, conduit, and conductor combined. That is more than the cost of an EMS that would let you confidently pick the lower number and enforce it with an OCPP 2.0.1 smart charging profile.
Pro Tip
Pair concurrent factor design assumptions with a contractual EMS setpoint. If the design assumes 60% concurrent, the OCPP 2.0.1 platform must be programmed to throttle the site to 60% × ports × rating. This converts a sizing assumption into a guaranteed operational limit and satisfies NEC 220.85 if pursued. Eaton EV Energy Manager, Schneider Wiser, and DCC EV Pro all carry UL 916 listings.
Level 1, Level 2, and DCFC Power Envelopes
The per-port rating depends on the charger class. Sizing math starts here.
Level 1 (AC, 120 V or 230 V single-phase, low power)
| Region | Voltage | Amps | Typical kW |
|---|---|---|---|
| US Level 1 (120 V) | 120 V AC | 12 – 16 A | 1.4 – 1.9 kW |
| EU “Mode 2” trickle | 230 V AC | 8 – 10 A | 1.8 – 2.3 kW |
Level 1 is rarely used for new infrastructure projects but appears in workplace and multifamily retrofits where service capacity is heavily constrained. A 1.9 kW Level 1 delivers roughly 5 to 8 miles of range per hour, enough for a daily commute over a typical 10 to 12 hour parking window.
Level 2 (AC, 208 to 240 V single-phase or 400 V three-phase)
| Region | Voltage | Amps | Typical kW | Standard |
|---|---|---|---|---|
| US residential Level 2 | 240 V AC | 30 – 50 A | 7.2 – 11.5 kW | SAE J1772 |
| US commercial Level 2 | 208 V AC (3-phase wye) | 40 – 80 A | 11.5 – 19.2 kW | SAE J1772 |
| EU single-phase Mode 3 | 230 V AC | 16 – 32 A | 3.7 – 7.4 kW | IEC 61851 |
| EU three-phase Mode 3 | 400 V AC | 16 – 32 A | 11 – 22 kW | IEC 61851 |
| EU 22 kW max public | 400 V AC | 32 A | 22 kW | IEC 61851 Mode 3 |
The vast majority of US Level 2 installations are 32 A (7.7 kW at 240 V) or 48 A (11.5 kW at 240 V). The 80 A (19.2 kW) variant exists but is rare because few vehicles accept it (the Lucid Air and the Porsche Taycan are the main current adopters at full capacity).
The vast majority of EU Level 2 installations are 11 kW or 22 kW three-phase. UK installations are typically 7.4 kW single phase for residential and 22 kW three phase for commercial because of the residential single-phase service standard. Read more about Battery Solar System Design UK. Read more about Heritage Building Solar Case Study. For United Kingdom-specific compliance details, see United Kingdom comparisons/mcs-vs-non-mcs.
DC Fast Charging (DC, 400 to 1000 V battery side)
| Class | Power | Standard | Typical Use |
|---|---|---|---|
| CCS / CHAdeMO 50 kW | 50 kW | IEC 62196-3, CHAdeMO 1.x | Early DCFC, legacy stations |
| CCS 150 kW | 150 kW | IEC 62196-3 | Standard corridor DCFC |
| CCS 350 kW HPC | 350 kW | IEC 62196-3, ISO 15118-20 | Highway corridor, NEVI program |
| Tesla Supercharger V3 | 250 kW | Tesla NACS / SAE J3400 | Tesla network |
| Tesla Supercharger V4 | 350 kW | Tesla NACS / SAE J3400 | V4 stations 2024+ |
| Megacharger (truck) | 1 MW – 1.2 MW | MCS (CharIN, IEC 61851-23-3) | Tesla Semi, eHGV depots |
| Bus depot pantograph | 150 – 600 kW | IEC 61851-23, OppCharge | Transit buses |
DC fast chargers do not run at nameplate for the full session. The charging curve typically delivers maximum power from roughly 10% to 50% state of charge, then tapers to 30 to 50% of nameplate from 50 to 80% SOC, and crawls below 30 kW above 80% SOC. The average session at a 350 kW DCFC delivers 150 to 200 kW of average power across a 20 to 30 minute session.
This is why the concurrent use factor for DCFC corridors is lower than the naive expectation. Even with four cars on four dispensers, at any moment only one or two are in the constant power phase of the curve. The site peak rarely hits nameplate × 4.
Diversity Factor by Site Type
Diversity and concurrent use are closely related but distinct. Concurrent use describes how many ports are actively delivering power. Diversity describes how their power profiles overlap in time.
A 100 port workplace site with 60% concurrent use sees 60 chargers active at the peak minute. But each of those 60 chargers may be tapering off because the vehicle is approaching full state of charge while a fresh arrival starts at full power. The site demand curve is smoother than the sum of nameplates.
Empirical Diversity Curves
For workplace AC charging, the dominant pattern is:
- 8:00 – 9:30 AM: arrivals ramp, peak demand
- 9:30 – 11:00 AM: peak holds as morning arrivals finish charging while late arrivals start
- 11:00 AM – 2:00 PM: demand falls as morning EVs reach full SOC
- 2:00 – 4:00 PM: low plateau, mostly midday top-ups
- 4:00 – 6:00 PM: brief uptick from afternoon arrivals (typically under 10% of total)
This pattern means the site demand peak typically lands 30 to 90 minutes after the morning arrival peak, and most of the day runs at 20 to 40% of peak. A site sized for the 60% concurrent peak runs at an average load factor of 25 to 35% across the day.
Multifamily Overnight Pattern
For multifamily overnight charging, the dominant pattern is:
- 5:00 – 8:00 PM: arrivals ramp, plug in immediately
- 8:00 – 11:00 PM: most chargers active simultaneously
- 11:00 PM – 5:00 AM: tapering as vehicles reach target SOC
- 5:00 – 7:00 AM: low plateau
The concurrent peak is higher (60 to 90%) but persists for only 2 to 3 hours. Time-shifted charging via OCPP smart profiles or static off-peak timers spreads this peak to a 6 to 8 hour window, dropping concurrent peak to 30 to 50%.
DCFC Corridor Pattern
DC fast charging diversity is dominated by Poisson arrival statistics. If average utilization is 40% (meaning each dispenser delivers energy 40% of the time on average), the probability of all four dispensers being in the constant power phase at the same minute is roughly:
P(all 4 at peak) = P(active) × P(in CP phase | active) ^ 4 ≈ 0.40 × 0.35^4 ≈ 0.6%
The expected number of dispensers in constant power phase at any moment is roughly 4 × 0.40 × 0.35 = 0.56. The 95th percentile is 2 to 3 dispensers, depending on arrival rate.
This is why a 4 port 350 kW site does not require 1.4 MW of service entry. A 750 kVA to 1,000 kVA transformer (with appropriate margin) covers the 95th percentile load.
Transformer and Service Entry Sizing
Once you have the design peak kW and the line voltage, the transformer and service entry size flow directly.
Transformer Sizing Formula
Transformer kVA = (Design Peak kW / Power Factor) × Utility Margin
| Power Factor Assumption | When to Use |
|---|---|
| 1.0 | Pure DC fast charging (PFC integrated, near-unity input PF) |
| 0.95 | Modern Level 2 chargers with active PFC |
| 0.90 | Mixed Level 2 + auxiliary loads |
| 0.85 | Legacy Level 2 + significant inductive auxiliary load |
| Utility Margin | When to Use |
|---|---|
| 1.10 | Site with confirmed EMS and OCPP smart profile enforcement |
| 1.25 | Standard workplace and retail (most common) |
| 1.40 | Fleet depot or DCFC corridor with growth planning |
A 200 kW design peak at 0.95 PF and 1.25 utility margin: 200 / 0.95 × 1.25 = 263 kVA → round up to standard 300 kVA pad mount.
Standard Transformer Sizes
US pad mount: 75, 112.5, 150, 225, 300, 500, 750, 1000, 1500, 2000, 2500 kVA EU ground mount: 100, 160, 250, 400, 630, 800, 1000, 1250, 1600, 2000 kVA UK ground mount (per Open Networks): 200, 315, 500, 800, 1000, 1500 kVA See our guide on MCS Certification for Solar Installers in the UK for more. See Ground Mounted Solar Design Guide for detailed guidance.
Service Entry Conductor Sizing
Once kVA is fixed, the service entry conductors follow standard practice. For 480 V three phase US service:
| Service Size | Standard Conductor (Cu, 75°C) |
|---|---|
| 200 A | 3/0 AWG |
| 400 A | 600 kcmil |
| 600 A | 2 × 350 kcmil parallel |
| 800 A | 2 × 500 kcmil parallel |
| 1200 A | 3 × 500 kcmil parallel |
| 2000 A | 4 × 600 kcmil parallel |
For European IEC service, sizing uses cross-sectional area in mm² with similar 75°C ratings. Also see: European Solar Incentives. For Europe-specific compliance details, see Europe solar compliance.
The conductor cost is rarely the binding constraint on a site decision. The binding constraint is the transformer lead time (typically 12 to 36 months in 2024 to 2026 across the US per industry reporting) and the utility service upgrade timeline.
Transformer Lead Time Warning
US pad mount transformer lead times reached 26 weeks median in 2024 and 18 to 30 months for larger units (>1,000 kVA). Always confirm utility transformer availability before committing to a site design that requires a new pad mount. Several Tesla and EVgo corridor sites were delayed 12+ months in 2024 by transformer supply alone.
kWh Throughput Modeling
For business case and energy bill purposes, the right number is daily kWh throughput, not peak kW.
Daily kWh = Vehicles per Day × Average kWh per Session
| Site Type | Vehicles/Day per Port | kWh/Session | Daily kWh per Port |
|---|---|---|---|
| Multifamily L2 (1 car/spot) | 0.9 | 12 – 20 | 11 – 18 |
| Workplace L2 (1 car/spot) | 0.9 | 8 – 15 | 7 – 14 |
| Retail L2 (rotation) | 2 – 4 | 6 – 12 | 12 – 48 |
| Hotel destination L2 | 1 – 1.5 | 25 – 45 | 25 – 70 |
| DCFC corridor (per dispenser) | 8 – 18 | 30 – 50 | 240 – 900 |
| Tesla Supercharger (per stall) | 12 – 25 | 35 – 55 | 420 – 1,375 |
| Bus depot (per port) | 1 (bus) | 200 – 350 | 200 – 350 |
These ranges come from operator telemetry published by ChargePoint, EVgo, and US DOE AFDC station-level data. Tesla Supercharger numbers come from Tesla Investor Day disclosures and aggregated third-party telemetry.
Energy Cost Math
Once daily kWh is known, the energy bill is straightforward. For a 100 port workplace at 12 kWh/port/day:
- Daily energy: 100 × 12 = 1,200 kWh
- Monthly energy: 1,200 × 22 workdays = 26,400 kWh
- At $0.12/kWh energy rate: $3,168/month energy charge
- Plus demand charge: 280 kW peak × $18/kW demand = $5,040/month demand charge
- Total monthly: $8,208 ($98,496/year)
Demand charges typically account for 50 to 70% of the total bill at workplace and retail EV charging sites without solar or battery shaving. This is why the kW vs kWh distinction also drives operating economics, not just capital cost.
NEC, IEC, and EU AFIR Compliance Anchors
EV charging sizing math is bounded by codes and standards. The dominant references in 2026 are:
| Standard | Scope | Key Sizing Rule |
|---|---|---|
| NEC 625.41 (NFPA 70) | US EVSE installation | 125% continuous load adder |
| NEC 625.42 | US EVSE rating | Branch circuit rating based on max EVSE output |
| NEC 220.85 | US EVSE demand calculation | EMS can limit demand to setpoint |
| NEC 220.87 | US existing service evaluation | Historical peak + 125% sets retrofit demand |
| IEC 61851-1 | Global EV conductive charging | Modes 1–4 definitions and ratings |
| IEC 61851-23 | DC charging | DCFC system requirements |
| SAE J1772 | US AC charging connector | Type 1 connector and signaling |
| SAE J3400 (NACS) | US NACS standard | Tesla connector adopted by Ford, GM, Rivian, others |
| ISO 15118-2 / 15118-20 | EV–EVSE communication | Plug and Charge, V2G dynamic mode |
| OCPP 2.0.1 (OCA) | EVSE–CSMS protocol | Smart charging profiles, EMS integration |
| EU AFIR (2023/1804) | EU public infrastructure | 1 charger/60 km TEN-T, 600 kW/site by 2025 |
| NEVI (US, 23 CFR 680) | US federal corridor program | 4 × 150 kW at each NEVI site |
| UK PAS 1899:2022 | UK accessibility | Spacing and access requirements |
| RAC UK EV connection guidance | UK service connection | DNO process and demand declaration |
NEC 220.85 is the single most useful sizing rule for retrofit and brownfield sites in the US. It allows an energy management system to enforce a contractual maximum kW, which means the service entry only needs to be sized for that contractual maximum plus other loads. Without an EMS, the full nameplate of every EVSE counts toward the demand calculation, dramatically inflating the service entry requirement.
OCPP 2.0.1 from the Open Charge Alliance is the dominant protocol that connects an EMS to the chargers. The Transaction-Level Messaging profile in OCPP 2.0.1 supports dynamic setpoint adjustment in near real time, which means a single EMS can enforce a 200 kW site setpoint across 50 chargers that have a 575 kW combined nameplate. The cost of an OCPP 2.0.1 capable EMS is typically $4,000 to $12,000 per site, which is roughly 5 to 15% of the service upgrade cost it avoids.
Worked Example 1: 10 Port Multifamily Garage
A 100 unit multifamily building in Boulder retrofits its underground garage with 10 Level 2 ports for residents.
Inputs
- 10 × 11.5 kW Level 2 chargers (48 A at 240 V single phase)
- Site type: multifamily overnight
- EMS in place: yes (OCPP 2.0.1 platform with 60% setpoint)
- Service: 240 V single phase (existing residential transformer)
Without EMS
- Connected EVSE = 10 × 11.5 = 115 kW
- NEC 625.41 adder = 115 × 1.25 = 143.75 kW
- Concurrent use without EMS = 0.75 (multifamily overnight)
- Design peak = 143.75 × 0.75 = 107.8 kW
- Amps at 240 V = 107,800 / 240 = 449 A
- Required service: 500 A → 100 kVA transformer upgrade
With EMS and 60% setpoint
- Connected EVSE = 115 kW
- Enforced setpoint = 115 × 0.60 = 69 kW
- NEC 220.85 applies → design demand = 69 kW
- NEC 625.41 adder = 69 × 1.25 = 86.25 kW
- Add 30 kW residential baseline + elevator + lighting = 116 kW
- Amps at 240 V = 116,000 / 240 = 483 A
- Required service: 500 A (no transformer upgrade needed if existing was 500 A)
The EMS converts the project from a $42,000 transformer upgrade into a $7,500 EMS installation, saving the building $34,500 net.
Worked Example 2: 20 Port Retail Site
A grocery store anchor in suburban Atlanta installs 20 Level 2 ports for customers in a parking lot adjacent to the existing 480 V service.
Inputs
- 20 × 7.2 kW Level 2 chargers (30 A at 240 V single phase from 480/240 V step down)
- Site type: retail / grocery
- Average session: 45 minutes
- Concurrent use factor: 0.40 (retail empirical)
Sizing
- Connected EVSE = 20 × 7.2 = 144 kW
- Concurrent use = 144 × 0.40 = 57.6 kW design peak
- NEC 625.41 adder = 57.6 × 1.25 = 72 kW
- Add 50 kW retail HVAC and refrigeration baseline EV-only contribution = 72 kW (EV) + 0 (separate meter)
- Amps at 240 V = 72,000 / 240 = 300 A on dedicated EV panel
- Transformer kVA (EV only): 72 / 0.95 × 1.25 = 95 kVA → 112.5 kVA pad mount
- Or 150 kVA if grid-interactive EMS is planned for future battery storage
kWh Throughput
- Vehicles per day per port = 3.0 (retail rotation)
- kWh per session = 8 (45 min × 7.2 kW × 75% session-on-time fraction)
- Daily energy = 20 × 3.0 × 8 = 480 kWh
- Monthly energy = 480 × 30 = 14,400 kWh
- At $0.10/kWh + $14/kW demand: $1,440 energy + $806 demand = $2,246/month operating cost
Solar PV offset opportunity: a 100 kW rooftop array on the grocery roof generates roughly 500 kWh/day in Atlanta. With behind-the-meter coordination, the array can offset 70 to 90% of EV charging energy and reduce demand peak by 30 to 50 kW during midday hours.
Worked Example 3: 50 Port Fleet Depot
A municipal fleet operator in Sacramento electrifies a 50 vehicle light-duty fleet at a depot with overnight charging from 6 PM to 6 AM.
Inputs
- 50 × 19.2 kW Level 2 chargers (80 A at 240 V single phase from 480 V three phase service)
- Site type: fleet depot
- Concurrent use factor: 0.90 (depot fleet, plug-in within 30 min of shift end)
- EMS: yes (OCPP 2.0.1 with phased start scheduling)
Without phased scheduling
- Connected EVSE = 50 × 19.2 = 960 kW
- Concurrent peak = 960 × 0.90 = 864 kW
- NEC 625.41 adder = 864 × 1.25 = 1,080 kW
- Transformer kVA = 1,080 / 0.95 × 1.25 = 1,421 kVA → 1,500 kVA pad mount
- Service entry at 480 V three phase = 1,080,000 / (480 × 1.732) = 1,300 A → 1,600 A service
With phased scheduling EMS
- Phased start spreads concurrent use across 3 waves of 17 vehicles each
- Per-wave peak = 17 × 19.2 × 0.95 = 310 kW
- NEC 220.85 design demand = 310 kW (enforced by EMS)
- NEC 625.41 adder = 310 × 1.25 = 387.5 kW
- Add 40 kW depot baseline = 427.5 kW
- Transformer kVA = 427.5 / 0.95 × 1.25 = 562 kVA → 750 kVA pad mount
- Service entry at 480 V three phase = 427,500 / (480 × 1.732) = 514 A → 600 A service
The phased scheduling cuts the transformer from 1,500 kVA to 750 kVA (saving roughly $135,000 in transformer cost alone) and reduces switchgear and conductor cost by another $80,000 to $120,000. The phased EMS schedule still completes all 50 vehicles within the 12 hour overnight window because each vehicle only needs 50 to 80 kWh, which is 2.6 to 4.2 hours at 19.2 kW.
This is the same load-shifting principle used in the smart EV charging load management with solar integration. The math is the same. The control system is OCPP 2.0.1 in both cases.
Worked Example 4: 100 Port Workplace Site
A tech employer in Mountain View installs 100 Level 2 ports across a 6 story parking garage for employee daytime charging.
Inputs
- 100 × 7.7 kW Level 2 chargers (32 A at 240 V)
- Site type: workplace daytime
- Concurrent use factor: 0.65 (workplace empirical with EMS)
- EMS: yes (OCPP 2.0.1)
Sizing
- Connected EVSE = 100 × 7.7 = 770 kW
- Concurrent peak = 770 × 0.65 = 500.5 kW
- NEC 625.41 adder = 500.5 × 1.25 = 626 kW
- Add 80 kW garage lighting and HVAC = 706 kW total
- Transformer kVA = 706 / 0.95 × 1.25 = 928 kVA → 1,000 kVA pad mount
- Service entry at 480 V three phase = 706,000 / (480 × 1.732) = 849 A → 1,000 A service
Solar Integration
A 500 kWp rooftop PV system on the garage roof generates 2,500 to 3,000 kWh/day in Mountain View. Across the 10 AM to 4 PM window when workplace EV demand is highest, the array delivers 250 to 350 kW continuously. With a behind-the-meter coordination controller, the grid-side peak drops to 350 to 400 kW during solar hours, allowing the transformer to be downsized to 750 kVA if the EMS is sized to harden this assumption (this is a regulatory and utility approval question, not just an engineering one).
kWh Throughput
- Vehicles per day per port = 0.9
- kWh per session = 12 (typical workplace top-up)
- Daily energy = 100 × 0.9 × 12 = 1,080 kWh
- Annual energy at 240 workdays = 259,200 kWh
- At $0.15/kWh + $22/kW demand: $38,880 energy + $132,132 demand = $171,012/year
- Solar offsets ~70% of energy and ~30% of demand: ~$80,000/year savings
The generation and financial tool calculates this kind of dispatch optimization automatically for solar plus EVSE configurations. The math is in the same family as behind-the-meter solar optimization, where load profile and solar profile are aligned to maximize self-consumption and minimize demand charges.
Worked Example 5: 4 Port DCFC Corridor Site
A charge point operator installs a 4 port DCFC corridor station along I-5 near Bakersfield to serve the EVgo and Electrify America corridor mandate.
Inputs
- 4 × 350 kW CCS dispensers (ISO 15118-2 ready, ISO 15118-20 upgrade-capable)
- Site type: DCFC corridor (highway)
- Concurrent use factor: 0.55 (EVgo network empirical)
- Effective in-CP-phase factor: 0.35 of nameplate average across charge curve
Sizing
- Connected nameplate = 4 × 350 = 1,400 kW
- Effective design peak = 1,400 × 0.55 × 0.85 (charging curve average) = 654 kW
- Conservative case (95th percentile): 1,400 × 0.70 = 980 kW
- Add 40 kW site auxiliary (lights, comms, cooling) = 1,020 kW conservative
- Transformer kVA = 1,020 / 0.99 (DCFC near-unity PF) × 1.10 (with utility coordination) = 1,134 kVA → 1,250 kVA pad mount
- Or 1,500 kVA pad mount with growth headroom for an eventual 6 port expansion
- Service entry at 480 V three phase = 1,020,000 / (480 × 1.732) = 1,227 A → 1,200 A service
Battery Storage Option
A 1 MWh / 500 kW battery on site shaves the brief 4-dispenser concurrent peaks by 200 to 300 kW. This allows the service to be sized for the average 700 to 800 kW load instead of the 1,000 kW peak, dropping the transformer to 1,000 kVA and the service to 800 A. The battery is typically a 2 to 3 year payback against the demand charge savings in CAISO territory. Read Design Commercial Solar System 1MW for a complete walkthrough.
This is exactly the kind of integration that the commercial battery storage sizing and commercial solar transformer sizing workflows are built to optimize, and where a solar proposal software platform earns its keep by running the dispatch math in seconds.
How Software Automates EV Charging Sizing
Solar design software and EVSE-aware energy management platforms handle the multi-variable optimization that manual calculation can only approximate.
What good software handles:
- Hourly demand profile simulation across 8,760 hours of the year
- Stochastic Monte Carlo arrival pattern modeling for workplace and retail
- Solar PV co-simulation with EV load shapes
- Battery dispatch optimization against demand charge structures
- OCPP 2.0.1 smart charging profile generation and validation
- NEC 625.41 and NEC 220.85 compliance check
- Transformer thermal aging model under expected duty cycle
- Utility tariff structure modeling (TOU, demand, hourly real-time, capacity charges)
The manual math in this guide is essential for understanding what the software is calculating. It is rarely the right way to commit a 7-figure capital project. Use the manual math to ground-truth the software output, and use the software to optimize the dozens of decisions (charger placement, EMS setpoint, battery size, solar array tilt, tariff schedule) that the manual math cannot handle simultaneously.
Design EV-Ready Solar Projects in Minutes
SurgePV’s design and proposal platform models EV charging loads, solar PV generation, and battery dispatch on the same timeline. Concurrent use factors, demand profiles, and NEC compliance checks are built in.
Book a DemoNo commitment required · 20 minutes · Live project walkthrough
For a direct comparison, see Arka 360 vs SurgePV.
Common Sizing Errors
Five errors account for most of the costly mistakes in real EV charging projects.
Error 1: 100% Concurrent Use Assumption
Sizing every port at full nameplate × 100% concurrent is the default assumption in older EV charging design templates and many AHJ submittal packages. It is correct only for fleet depots with simultaneous shift end plug-in. It is wrong by a factor of 1.5 to 3 for workplace, retail, and DCFC sites.
Fix: apply empirical concurrent use factors from the table in the demand factor section.
Error 2: Stacking NEC 625.41 on Top of Concurrent Use
A common error is to multiply the 125% NEC 625.41 adder onto the connected nameplate and then apply concurrent use, instead of applying concurrent use first and then 125%. The first order matters because NEC 625.41 is intended to ensure continuous current carrying capacity, not to double-count diversity.
Correct order: connected nameplate → concurrent use → 125% adder → amp conversion.
Error 3: Ignoring DCFC Charging Curves
DCFC nameplate is the peak rating during the constant power phase. Average session power is 40 to 60% of nameplate. A 4 × 350 kW corridor site is not a 1,400 kW site. Sizing for nameplate × 4 is the most expensive way to deliver a DCFC corridor and a frequent cause of stranded transformer capacity.
Fix: use empirical session-average power and Poisson-arrival concurrent use to size DCFC sites.
Error 4: Skipping the EMS
Without an EMS, the service entry must absorb every theoretically possible kW the chargers can deliver. With an OCPP 2.0.1 EMS enforcing a setpoint, the service entry can be sized for that setpoint plus other loads, saving 30 to 60% of capital cost on retrofit projects. The EMS investment is typically 10 to 15% of the saved capital.
Fix: design every project >20 ports with an EMS budget line item.
Error 5: Ignoring Transformer Lead Time
US transformer lead times reached 26 weeks median in 2024 and 18 to 30 months for >1,000 kVA units. A project that does not confirm transformer availability before site design lock can sit for a year waiting for steel. EU and UK lead times are similar.
Fix: confirm transformer lead time with utility before finalizing site capacity decisions.
Solar PV Integration
Solar PV pairs naturally with workplace, retail, and fleet depot EV charging because the solar generation curve overlaps the EV demand curve.
| Site Type | Solar Overlap with EV Demand | Typical Self-Consumption with Solar | Demand Charge Relief |
|---|---|---|---|
| Workplace daytime | High (60–90% overlap) | 70–90% | 30–50% |
| Retail / grocery | High (50–70% overlap) | 60–80% | 25–40% |
| Hotel destination | Moderate (40–60% overlap) | 50–70% | 20–35% |
| DCFC corridor | Variable (depends on dispenser utilization profile) | 30–60% | 10–25% |
| Multifamily overnight | Low (10–30% overlap, depends on geography) | 10–30% with battery | 5–15% with battery |
| Fleet depot (overnight) | Very low (under 10% overlap, unless solar + battery) | Under 20% solar-only, 60% with battery | 5–10% solar-only |
Sites with high overlap (workplace, retail) benefit the most from solar without storage. Sites with low overlap (multifamily, fleet depot) need solar plus battery to meaningfully reduce grid-side capacity. The shadow analysis and load modeling tools in solar software handle the hourly-resolution dispatch that determines the real overlap percentage on a specific site.
Related reads for deeper coverage of the solar plus EV integration math:
- Solar EV charging integration guide
- Solar carport for EV fleet charging
- Home EV charging solar optimization
- Hotel solar EV charging case study Spain
- Solar carport case study California EV charging Also see: Spain net metering.
For the glossary terms that come up most often in EV sizing math:
EU AFIR and NEVI Sizing Constraints
Public corridor sites in 2026 are increasingly bound by regulatory minimums that override pure utility-driven sizing.
EU AFIR (Regulation 2023/1804)
- 1 DCFC station every 60 km along TEN-T core network by end of 2025
- Minimum 600 kW per station on core TEN-T, of which at least one dispenser at 150 kW or higher
- Minimum 1,200 kW per station every 60 km on comprehensive TEN-T by 2027
- Truck and bus dedicated infrastructure: 1,400 kW per station every 60 km core TEN-T by 2025
This means a 600 kW minimum site in the EU forces at minimum a 750 to 1,000 kVA transformer regardless of expected utilization, because the regulation specifies installed capacity, not used capacity.
NEVI (US 23 CFR 680)
- Minimum 4 × 150 kW CCS dispensers per site on Alternative Fuel Corridors
- 1 mile from interstate exit
- 50 mile maximum spacing between sites
- 97% uptime requirement
This drives a minimum 600 kW nameplate per site at NEVI corridor stations. Applying the standard DCFC concurrent factor of 0.55 to 4 × 150 kW gives a design peak of 330 kW, which translates to a 500 kVA pad mount as the minimum NEVI-compliant transformer size.
UK ChargePoint Regulations
The UK has not mandated minimum power per site in the same way, but the Public Charge Point Regulations 2023 require 99% reliability on >50 kW chargers on the strategic road network, and the RAC UK research shows that ~6,000 high-power charging hubs (8+ ports at 150 kW+) are needed by 2030 to support the UK’s 26 million expected EV fleet.
Conclusion
EV charging infrastructure sizing in 2026 is a math problem with five core levers:
- Distinguish peak kW from energy kWh. kW sets the service entry. kWh sets the energy bill. Both matter but they are not interchangeable.
- Apply empirical concurrent use factors by site type. 100% concurrent is wrong for everything except fleet depots. Use 0.40 for retail, 0.55 to 0.65 for workplace, 0.75 for multifamily, 0.90 for fleet depots.
- Use NEC 220.85 with an EMS to enforce demand limits. OCPP 2.0.1 smart charging profiles convert a sizing assumption into a guaranteed operational limit and can save 30 to 60% on retrofit service upgrades.
- Apply 125% NEC 625.41 adder after concurrent use, not before. Stacking conservatism on top of conservatism inflates the service by 25% without a code reason.
- Account for DCFC charging curve and Poisson arrival statistics. A 4 × 350 kW corridor is not a 1.4 MW site. Use empirical session-average power and 95th percentile arrival overlap.
The five worked examples in this guide cover the full range of site types from multifamily garage to 350 kW DCFC corridor. Real sites land between these reference points. The framework holds in all five cases.
For the same kind of integrated sizing math applied to the rest of a solar plus storage plus EV project, solar proposal software automates the dispatch optimization, demand charge modeling, and NEC compliance check on the same timeline.
Frequently Asked Questions
How do you calculate EV charging infrastructure sizing?
Multiply the number of ports by the per-port AC or DC rating, then apply a concurrent use factor (also called a demand factor) between 0.3 and 1.0 based on site type. Service entry size in kW equals ports times charger rating times concurrent factor, divided by power factor for AC systems. Then convert to amps at the service voltage and add a NEC 625.41 continuous-load 125% adder for AC EVSE that runs longer than three hours.
What is a typical concurrent use factor for EV charging?
Concurrent use varies sharply by site type. Workplace charging sees 50 to 80% simultaneous use during the morning arrival peak, retail and grocery typically 30 to 50%, multifamily overnight 60 to 90%, fleet depots 80 to 100% during the depot window, and DC fast charging corridors operate at 40 to 70% based on EVgo and ChargePoint utilization data. Residential clusters cluster around 40 to 60% under unmanaged charging.
What is the difference between kW and kWh in EV charging?
kW is the instantaneous power draw of a charger or site, which sets the service entry, transformer, and switchgear size. kWh is the total energy delivered per session or per day, which drives utility bills, solar offset, and battery sizing. A 150 kW DC fast charger delivering 30 minute sessions at 80 kW average delivers 40 kWh per session. A 100 port workplace at 7 kW with 40% concurrent runs at 280 kW peak but throughputs around 1,800 kWh per workday.
How much service entry capacity does a 10 port Level 2 garage need?
Ten 11.5 kW Level 2 chargers at 50% concurrent use require 57.5 kW of continuous capacity. With the NEC 625.41 125% adder, the design load is 71.9 kW, which translates to 173 amps at 240 V single phase or 100 amps at 415 V three phase. Most 10 port garages land on a 200 amp 240 V service or a 100 amp 480 V three phase service, depending on local utility connection options.
What is NEC 625.41 and why does it matter for sizing?
NEC 625.41 classifies EVSE as a continuous load and requires conductors and overcurrent devices to be rated at 125% of the maximum charger output. A 48 amp Level 2 charger draws up to 48 amps continuously, so the branch circuit must be sized for 60 amps. Service entries that aggregate multiple chargers should apply 125% to the design load after applying diversity, not before. This avoids stacking conservatism on top of conservatism.
Can you apply demand factors to EVSE under NEC 220.85?
NEC 220.85 (added in the 2020 cycle and refined in 2023) allows energy management systems to limit total EVSE demand to a defined kW setpoint, so the service entry only needs to be sized for that setpoint plus other loads. Without an EMS, the full 100% of nameplate EVSE rating applies. This is the single biggest lever for reducing service upgrade cost on retrofit projects. Eaton, Schneider Wiser, and DCC EV Pro all carry UL 916 listings for NEC 220.85 compliance.
How does solar PV change the sizing of EV charging infrastructure?
Solar PV reduces the grid-side service entry requirement when paired with an export-limited or behind-the-meter coordination controller. A 100 kW solar array offsetting a 280 kW workplace peak can drop net grid demand to roughly 180 kW between 10 AM and 4 PM, reducing transformer and service entry size by 30 to 40%. The relief is largest for daytime workplace and retail charging, smaller for overnight residential or fleet depot charging where PV is unavailable.
What is the EVI-Pro model and when do I use it?
EVI-Pro is the Electric Vehicle Infrastructure Projection tool published by NREL and US DOE AFDC. It estimates regional charging demand by vehicle count, typical daily miles, and charging access mix. Use it for portfolio-level planning of public Level 2 and DCFC networks. For single-site sizing, use the worked examples in this guide instead because EVI-Pro is calibrated for aggregate utility-scale forecasting.
How do you size a DC fast charging corridor site?
Each 150 to 350 kW DCFC dispenser draws nameplate kW only during the constant power phase of the charge curve, which lasts roughly 8 to 15 minutes per session. Apply a concurrent factor of 0.5 to 0.7 across four dispensers because cars arrive randomly and only one or two are typically in constant power at any moment. A four port 350 kW corridor site lands on a 700 to 1,000 kVA pad mount transformer, depending on utility methodology and EU AFIR or NEVI program requirements.


