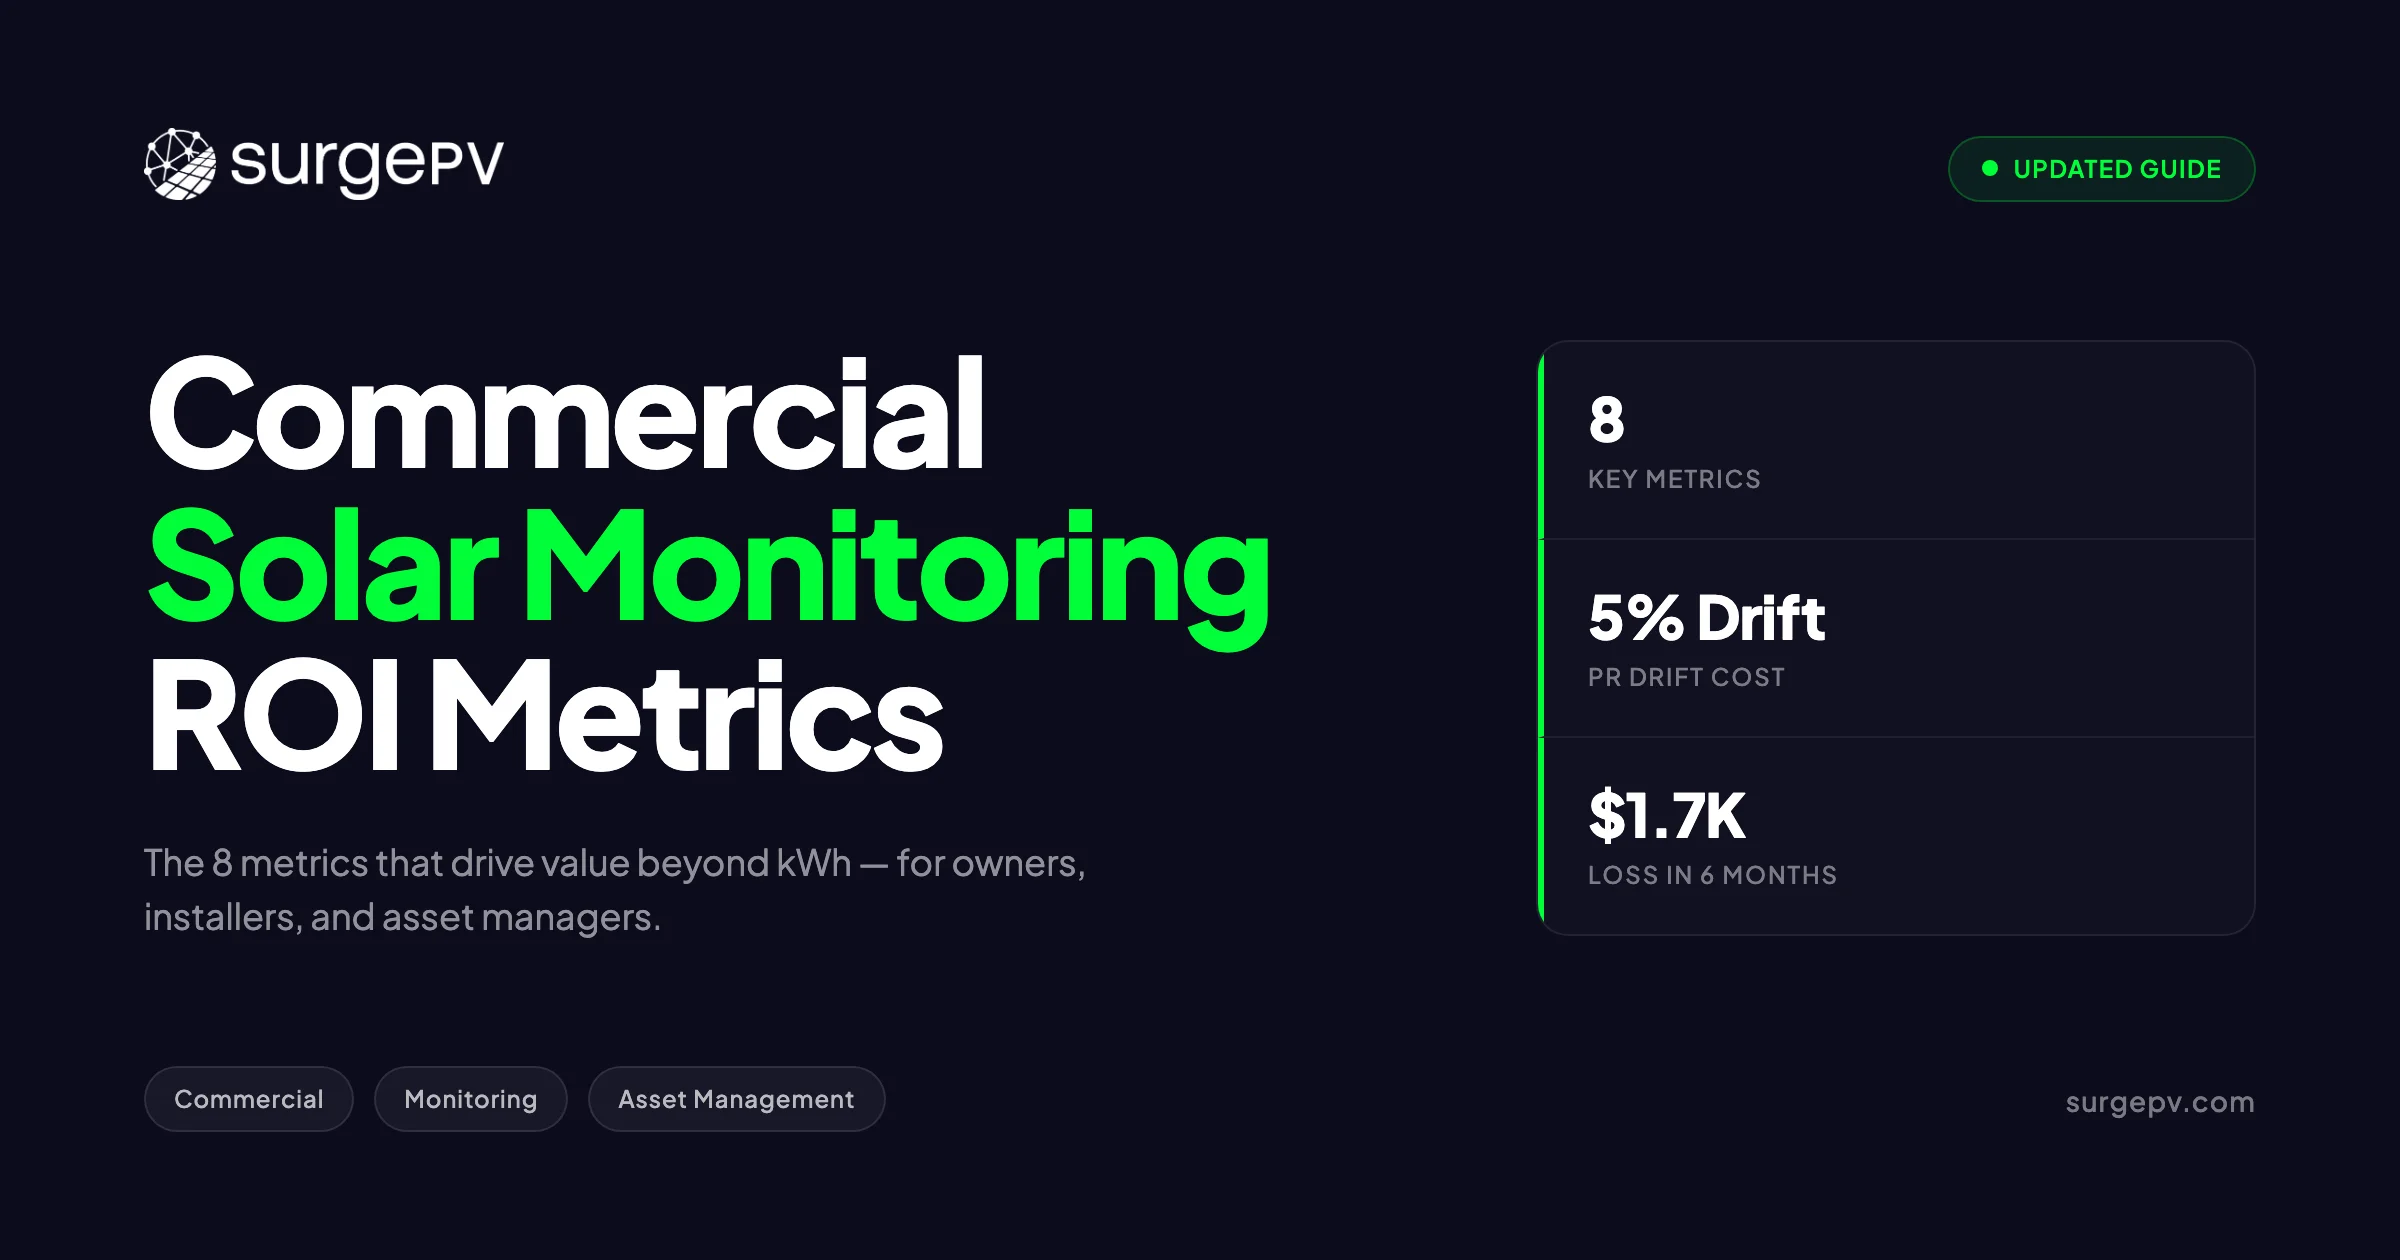
A 500 kWp commercial PV asset that loses 5% of its expected production for six months silently costs the building owner $1,750 in avoided savings at $0.14/kWh retail electricity. The owner sees a normal looking utility bill and a green dashboard. Nothing on the screen says “you are losing money.” This is the problem with most commercial solar monitoring in 2026: it reports kWh, but the value lives in eight other numbers that almost no off the shelf platform surfaces by default.
This guide is for building owners, asset managers, and commercial installers who need monitoring to actually drive return on investment rather than just decorate a wall. It covers the eight metrics that matter beyond kWh, the math behind demand charge avoidance, weather adjusted forecasting, fault detection value, platform differences across Locus, Also Energy, Solar-Log, Power Factors, SmartSolar, and the reporting templates that lenders, LEED, and ESG auditors actually accept. The angle is operational and ROI focused, not academic.
Quick Answer — Commercial Solar Monitoring ROI Metrics
The eight metrics that drive commercial solar ROI are performance ratio (PR), specific yield, weather adjusted expected energy, inverter availability, string level current variance, demand charge avoidance (kW peak reduction), revenue grade meter accuracy, and fault detection mean time to repair. A 5% PR drift on a 500 kWp system at $0.14/kWh costs $3,500 per year, and undetected for six months it costs $1,750. Good monitoring catches it in under 30 days.
In this guide:
- Why kWh alone is the wrong commercial solar monitoring metric in 2026
- The 8 metrics that actually drive commercial solar ROI
- Performance ratio (PR), what causes drift, and how to spot it
- Demand charge avoidance using 15 minute interval data
- Peak shaving net present value math
- Weather adjusted performance forecasting
- Fault detection ROI: early failure catch saves real money
- Monitoring platform comparison: Locus, Also Energy, Solar-Log, Power Factors, SmartSolar
- Building owner dashboards versus installer dashboards
- ESG, LEED, and lender reporting requirements
- Common monitoring mistakes that destroy ROI
Latest Updates: Commercial Solar Monitoring 2026
The commercial monitoring market is in a quiet but real consolidation phase. Three changes matter for owners signing new contracts this year.
Commercial Solar Monitoring — Status Table May 2026
| Item | Status | Why It Matters |
|---|---|---|
| AlsoEnergy + Stem merger | Closed (2023) | PowerTrack now integrated with Athena AI; pricing shifts on renewals |
| Locus Energy product roadmap | Active | Independent fleet management still the C&I default; revenue grade meter focus |
| Solar-Log under BKW Engineering | Active | European utility reporting strength; expanding North American coverage |
| Power Factors acquisitions | Active | Acquired Greenbyte and 3megawatt; now the largest independent IPP platform |
| Encharge / Enphase Enlighten Pro | Active | Pushing into small commercial under 250 kW |
| IEC 61724 revisions (PR calculation) | 2024 update in effect | New “PRSTC” formula adjusts for module temperature more accurately |
| GRESB v5 reporting requirements | Mandatory 2026 | Asset level interval data required for institutional investors |
| SunSpec Modbus alliance | Active | Universal data standard now supported by most inverter brands |
Three Big 2026 Shifts
Performance ratio formulas changed. The 2024 update to IEC 61724-1 introduced PRSTC, which corrects more accurately for module cell temperature. Asset managers running pre-2024 monitoring contracts often see a 1 to 3 point difference in calculated PR after upgrading. This is real, not a measurement error. Confirm which PR formula your platform uses before benchmarking sites against each other.
Institutional investors now require interval data. GRESB v5 (effective 2026) and CDP climate disclosure both require asset level monthly interval data, not just annual production totals. Owners running C&I portfolios for institutional clients can no longer rely on inverter level monthly summaries.
Inverter API consolidation. SunSpec Modbus is now supported by SMA, Fronius, SolarEdge, Huawei, Sungrow, Power Electronics, and Tigo. Custom integrations that cost $5,000 to $15,000 in 2020 are now drop in for most platforms. If you are paying integration fees on a 2026 contract, push back.
Why kWh Alone Is the Wrong Monitoring Metric 2026
Most commercial monitoring dashboards open with a big green kWh number for the day. Owners feel reassured. The system “made energy.” But kWh on its own answers no operational question worth asking.
What kWh Hides
A real example. A 500 kWp warehouse rooftop in northern Italy produces 1,820 kWh on a clear May morning. The dashboard looks healthy. The truth: a single string out of 32 has failed, soiling has reduced one sub array by 7%, and an inverter is clipping for 90 minutes mid day. The expected output for that morning was 1,975 kWh. The site lost 155 kWh that day, which is 8% of expected production. Over 180 sunny days, that is roughly 14,000 kWh, or about $1,960 at $0.14/kWh. Also see: solar panel ROI in Italy. Read more about Commercial Rooftop Solar Case Study Italy.
The dashboard never flagged this because kWh on its own says nothing about expected versus actual. It is a backward looking, weather dependent, capacity dependent number.
The Five Questions kWh Cannot Answer
| Question | What kWh Tells You | What You Actually Need |
|---|---|---|
| Is the system underperforming? | Nothing without expected baseline | Performance ratio versus expected PR |
| Did I avoid demand charges this month? | Nothing | 15 minute peak kW reduction |
| Is a string or inverter failing? | Nothing at site level | String current variance, inverter availability |
| Should I clean the panels? | Nothing | Soiling index, PR trend over 30 days |
| Will I hit my lender’s covenant? | Late | Weather adjusted expected energy vs actual |
When kWh Becomes a Liability
Reporting kWh without context is worse than reporting nothing when it gives owners false confidence. A site that produces 5% less than expected for six months, with no alert, is a site whose owner stops paying attention. By the time the year end true up shows the shortfall, the lost revenue is gone and unrecoverable.
For the underlying methodology, the NREL Best Practices for Operation and Maintenance of Photovoltaic and Energy Storage Systems sets out the data hierarchy that any C&I monitoring stack should match.
The 8 Metrics That Actually Drive Commercial Solar ROI
These are the numbers a commercial solar asset manager should be able to pull up in under 30 seconds. If your platform makes any of them hard to find, that platform is wrong for C&I.
The 8 Metrics — At a Glance
| # | Metric | What It Measures | Why It Matters |
|---|---|---|---|
| 1 | Performance Ratio (PR) | Actual output ÷ expected output given irradiance and temperature | Catches soiling, shading, clipping, string faults |
| 2 | Specific Yield (kWh/kWp) | Annual production normalised by installed DC capacity | Compares sites across geographies and sizes |
| 3 | Weather Adjusted Expected Energy | Forecast from real time irradiance and temperature | Distinguishes weather loss from equipment loss |
| 4 | Inverter Availability (%) | Time inverter is operational ÷ time it should be | Drives O&M SLAs and lender covenants |
| 5 | String Level Current Variance | Coefficient of variation across parallel strings | Earliest signal of module or wiring fault |
| 6 | Demand Charge Avoidance (kW) | Peak kW reduction in each billing window | Hidden revenue stream worth $6K–$15K/yr per 50 kW peak reduction |
| 7 | Revenue Grade Meter Accuracy (%) | ANSI C12.20 0.5% class accuracy | Required for PPA settlement, ITC reporting, lender audits |
| 8 | Mean Time to Repair (MTTR) | Hours from fault detection to fault clear | Drives total energy loss per failure event |
Metric 1: Performance Ratio (PR)
Performance ratio is the closest thing the solar industry has to a single score for site health. It is calculated as actual AC output divided by theoretical output given measured plane of array irradiance and module temperature. A site at 82% PR is converting 82% of the theoretically available solar energy into delivered AC. See our full solar performance ratio guide and our walk through on how to calculate solar performance ratio for the formula and worked examples.
Healthy PR ranges:
- Year 1 commercial rooftop: 80–85%
- Year 1 commercial ground mount with trackers: 82–87%
- Year 5 commercial rooftop (after typical degradation): 76–82%
- Below 75% on Year 1: site visit within 30 days
- Below 70% any year: investigate same week
Metric 2: Specific Yield
Specific yield (kWh/kWp/year) normalises annual production by installed DC capacity. It lets owners compare sites across cities, system sizes, and tilt angles. Useful ranges:
- Northern Europe (Hamburg, Manchester): 850–1,000 kWh/kWp
- Central Europe (Munich, Lyon): 1,050–1,250 kWh/kWp
- Southern Europe (Madrid, Bari): 1,400–1,700 kWh/kWp
- US Midwest (Chicago, Indianapolis): 1,250–1,450 kWh/kWp
- US Southwest (Phoenix, Las Vegas): 1,650–1,950 kWh/kWp Also see: Best Solar Design Software India.
Specific yield is the easiest number to benchmark across a portfolio. See also our glossary entry for specific yield.
Metric 3: Weather Adjusted Expected Energy
This metric uses real time measured irradiance (from a pyranometer or satellite feed) and module temperature to calculate what the system should have produced this hour. It is the gold standard for separating “the sun was not shining” from “something is broken.”
Metric 4: Inverter Availability
Time based availability percentage. A 99.0% availability inverter is offline for 87.6 hours per year. A 95.0% inverter is offline for 438 hours per year. Commercial PPAs typically include availability guarantees of 97% to 99%.
Metric 5: String Level Current Variance
The coefficient of variation across parallel strings on the same MPPT input. When all strings see the same irradiance, their currents should differ by less than 3%. A 7% or higher variance on one string usually means a fault: open string, shaded module, hot spot, or wiring issue.
Metric 6: Demand Charge Avoidance
The most under reported number in commercial solar. Covered in depth in its own section below.
Metric 7: Revenue Grade Meter Accuracy
For PPA settlement, lender audits, and ITC reporting, the meter feeding monitoring data must meet ANSI C12.20 0.5% class accuracy (in the US) or IEC 62053-22 Class 0.5 (international). Inverter internal output readings are typically 2 to 5% accurate and do not satisfy lender requirements.
Metric 8: Mean Time to Repair (MTTR)
Hours from fault detection to fault clear. A 24 hour MTTR on a 500 kWp inverter offline event during peak sun costs roughly $390 in lost generation. A 72 hour MTTR costs $1,170. MTTR drops directly to the bottom line.
Pro Tip — Build a Simple Score
Combine metrics 1, 4, 5, and 8 into a single weekly score (e.g., PR × Availability × (1 - String Variance) × (1 - MTTR penalty)). Sites scoring above 0.85 get a green light. Sites scoring 0.75 to 0.85 get a scheduled review. Below 0.75 triggers an immediate site visit. This works for portfolios of 5 to 500 sites and is easier to scan than 8 separate gauges.
Performance Ratio (PR) and What Drives Site-Level Drift
Performance ratio sounds simple, but the value drifts over a site’s life for very different reasons, and the response to each is different. Understanding what drives drift is the heart of operations.
What Causes PR Drift
| Cause | Typical PR Impact | How Fast |
|---|---|---|
| Module degradation (natural) | −0.3 to −0.6% per year | Slow, predictable |
| Soiling (dust, pollen, snow) | −2 to −15% seasonal | Variable, often reversible |
| Inverter clipping (DC oversizing) | −1 to −3% annual | Steady, design driven |
| Shading from new construction | −3 to −15% | Sudden, irreversible |
| String fault or blown fuse | −3 to −10% per affected string | Sudden, recoverable |
| Inverter undersizing | −2 to −5% in summer | Steady |
| Bypass diode failure | −2 to −7% on affected modules | Sudden |
| Connector corrosion / DC arcing | −1 to −8% gradually | Slow, dangerous |
Real Cost of a 5% PR Drift
Take a 500 kWp commercial system in central Italy producing 700,000 kWh/year at full performance. Self consumed electricity is worth $0.14/kWh.
| Scenario | Energy Loss | $ Loss (annual) | $ Loss if Undetected for 6 Months |
|---|---|---|---|
| 2% PR drop (soiling, mild) | 14,000 kWh | $1,960 | $980 |
| 5% PR drop (string fault, shading) | 35,000 kWh | $4,900 | $2,450 |
| 8% PR drop (multiple issues) | 56,000 kWh | $7,840 | $3,920 |
| 12% PR drop (inverter clipping + soiling) | 84,000 kWh | $11,760 | $5,880 |
A 5% PR drop undetected for six months on a single 500 kWp site quietly burns about $2,450. On a portfolio of 20 such sites with average drift, that is $49,000 per year of recoverable revenue sitting on the table.
How to Detect Drift
Three signals fire before kWh ever shows the loss:
- Daily PR moving average crosses below 30 day baseline by more than 1.5 standard deviations. This is the cleanest mathematical alert.
- String current coefficient of variation exceeds 5% on any MPPT input for more than 3 consecutive days.
- Inverter clipping ratio (DC overbuild trip frequency) increases month over month. See our explainer on solar inverter clipping and DC oversizing.
The cheapest way to set this up is to feed clean inverter data into a time series database and run nightly comparisons. Most C&I monitoring platforms can do this. The default settings rarely do; you have to configure them. For the latest details on France, see Agricultural Solar Case Study. For France-specific information, see Floating Solar Farms France.
Key Takeaway — PR Drift Economics
A 1% PR drift on a 1 MW commercial system at $0.12/kWh costs about $1,400 per year. Catching drift within 30 days saves about 92% of the annual loss. Catching it within 90 days saves 75%. After 180 days, you have already paid for it.
Demand Charge Avoidance Tracking (15-min Interval Data)
Demand charges are the most misunderstood part of commercial utility bills. They are also where commercial solar quietly delivers half its real ROI for buildings in tariffs like California Edison TOU-GS-3, New York ConEd SC-9, and most C&I tariffs in Italy, Spain, and Australia. Also see: Spain net metering. For Australia-specific compliance details, see Australia comparisons/lgc-vs-stc.
What a Demand Charge Is
A demand charge is a per kW fee for the peak power draw a building hits in a given billing window, regardless of how long that peak lasted. Typical US C&I demand charges run $10 to $25 per kW per month. European peak power (kW) charges run €6 to €15 per kW per month. For Europe-specific compliance details, see Europe solar compliance.
A factory drawing a 250 kW peak for 15 minutes once during the month pays the same demand charge as one drawing 250 kW continuously. The peak triggers the fee.
How Solar Affects Demand Charges
If solar production coincides with the building’s demand peak, solar reduces the peak kW reading. If solar production happens at noon but the building’s peak is at 4 pm, solar reduces zero demand charge.
This is why interval data matters so much. The only way to know if solar reduced your demand charge in a given month is to compare actual peak kW reading versus what the peak would have been without solar, using 15 minute load and production data side by side.
The Math: Demand Charge Avoidance NPV
A 1 MW office park in Los Angeles on Southern California Edison TOU-GS-3-E pays roughly $19/kW/month on summer peak demand charges. The building’s pre solar peak was 540 kW. With solar, the peak dropped to 470 kW. The avoided demand: 70 kW.
| Calculation | Value |
|---|---|
| Avoided peak demand | 70 kW |
| Summer demand charge rate | $19/kW/month |
| Summer months | 6 |
| Annual avoided demand cost (summer) | 70 × $19 × 6 = $7,980 |
| Winter demand charge rate | $9/kW/month |
| Annual avoided demand cost (winter) | 70 × $9 × 6 = $3,780 |
| Total annual demand charge avoidance | $11,760 |
| 25 year NPV at 5% discount, 2% utility escalation | $179,400 |
For this 1 MW building, $11,760 per year is the entirely separate revenue stream from $135,000 per year in kWh savings. Demand charge avoidance alone covers a typical commercial monitoring platform’s annual fee 6 to 8 times over.
Why Most Owners Cannot See This Value
Three reasons:
- The utility bill reports the peak kW but does not show the counterfactual (“what your peak would have been without solar”). You have to calculate it.
- Inverter only monitoring does not include building load data. You need a building load meter or building submeter feed.
- Most monitoring platforms aggregate to 60 minute intervals by default. Demand charges use 15 minute windows.
The fix is to feed both production data (from inverter or revenue grade meter) and building load data (from utility AMI feed or building submeter) into the same monitoring platform at 15 minute resolution.
Peak Shaving Value Calculation
Where demand charges are high, pairing solar with battery storage moves the peak even further. For a 1 MW building with a 250 kWh / 125 kW battery configured for daily peak shaving, the additional demand reduction is typically 80 to 120 kW on top of the solar contribution. See our deep dive on commercial solar self consumption optimization for the full sizing math. See Adding Battery Storage Services for detailed guidance.
| Configuration | Avoided Peak | Annual $ Avoided | 25 Yr NPV |
|---|---|---|---|
| Solar only | 70 kW | $11,760 | $179,400 |
| Solar + 125 kW battery | 175 kW | $29,400 | $448,500 |
| Solar + 250 kW battery | 240 kW | $40,320 | $614,800 |
The battery sizing question is no longer “how big a battery do I need for backup?” It is “how much demand charge can I shave for what battery $?” That is a monitoring question first, because the right battery size depends on real interval load data, not nameplate building peak.
Weather-Adjusted Performance Forecasting
Weather adjusted expected energy is the most powerful single monitoring concept and the most under used. The principle is simple: at every 15 minute interval, calculate what the system should have produced given the irradiance and temperature it actually saw. Compare to what it did produce. The gap is equipment loss.
How It Works
Three inputs feed the forecast:
- Plane of array (POA) irradiance — from a calibrated pyranometer or satellite feed (Solcast, Solargis, NSRDB)
- Module cell temperature — from a module backsheet sensor or calculated from ambient
- System nameplate behaviour curve — DC capacity, inverter efficiency curve, thermal coefficient
The forecast formula (simplified):
Expected AC Power (kW) = (POA Irradiance / 1,000 W/m²) × DC Capacity (kWp) × (1 − γ × (Tcell − 25°C)) × η_inverter × η_other_losses
Where γ is the module power temperature coefficient (typically −0.30 to −0.40%/°C for modern modules) and η_other_losses bundles soiling, wiring, mismatch, and availability factors.
Why Satellite Irradiance Now Beats Cheap Pyranometers
A $400 pyranometer with no recalibration drifts 2 to 4% per year. By Year 5, the pyranometer is the largest source of error in your expected energy forecast. Modern satellite irradiance (Solcast, Solargis, Meteonomics) is now within 3 to 5% of ground truth on hourly data and does not drift. For commercial sites under 5 MW, satellite irradiance is now the standard data source. Our piece on solar weather monitoring tools compares the leading providers.
Forecasting Loss Categories
Once you have weather adjusted expected energy, you can split the gap into specific loss categories:
| Loss Category | How It Shows Up | Typical Range |
|---|---|---|
| Soiling | Gradual gap over weeks, recovers after rain | 1–8% |
| Snow cover | Sudden full loss, recovers on melt | 0–100% |
| Shading | Gap at specific hours, repeats daily | 2–15% |
| Inverter clipping | Gap only at high irradiance | 1–4% |
| Inverter offline | 100% gap for affected inverter | Variable |
| String fault | Steady 3–10% gap per string | Cumulative |
| Module degradation | Steady gap that grows year over year | 0.3–0.6%/yr |
The combination of weather adjusted forecasting plus loss decomposition is what turns monitoring from a wall display into an asset management tool. For a deeper read on how this fits into broader asset management, see our glossary entry on asset management for solar projects.
Design Commercial Solar With Monitoring Built In
SurgePV’s solar design software lets you model performance ratio, demand charge profile, and weather adjusted expected energy at the proposal stage, so the system you deliver is the system the monitoring platform expects. No more surprise PR shortfalls in Year 1.
Book a DemoNo commitment required · 20 minutes · Live project walkthrough
Fault Detection ROI: Early Failure Catch Saves Money
The dollar value of monitoring is largely the value of catching faults earlier. NREL’s O&M Best Practices guide documents a clear pattern: average fault duration for unmonitored commercial PV is 14 to 38 days. With proper alerting, average fault duration drops to 1 to 4 days.
Cost of Common Faults
For a 500 kWp system at $0.14/kWh and average production of 1,900 kWh/day:
| Fault Type | Daily Production Loss | Cost / Day | Typical Detection Lag (no monitoring) | Cost If Undetected 14 Days |
|---|---|---|---|---|
| Single inverter offline (200 kW unit out of 500 kW) | 760 kWh | $106 | 14–21 days | $1,484 |
| String fault (1 of 32 strings) | 60 kWh | $8 | 30–60 days | $112 |
| Soiling cluster (one row dirty) | 110 kWh | $15 | 21–45 days | $210 |
| Bypass diode failure on one module | 4 kWh | $0.56 | 60+ days | $7.84 |
| DC arc fault | Variable + safety risk | Variable | Until disaster | Catastrophic |
The arc fault row is not just about lost energy. A DC arc fault can start a roof fire. Modern arc fault detection (AFDI/AFCI) is mandatory in NEC 690.11 (US) and recommended under IEC 63027. Monitoring that integrates AFCI alerts is a safety system, not just a financial one. See our explainer on arc fault detection in solar PV for the full standard.
Net Fault Detection ROI
For a 500 kWp commercial site:
- Annual fault detection value (typical commercial site): $3,500–$6,800
- Commercial monitoring platform annual cost: $600–$1,800
- Net monitoring ROI: 2x to 8x annual fee
For a 5 MW asset, fault detection ROI alone is typically $35,000 to $68,000 per year, against a platform fee of $4,000 to $12,000.
Mean Time to Repair Matters Too
Detection alone is not enough. A fault detected on day 1 but cleared on day 14 still costs the same as no monitoring. The full ROI loop is detection plus response. Asset managers should track:
| Metric | Target | Why |
|---|---|---|
| Mean time to detect (MTTD) | < 24 hours | Determines monitoring quality |
| Mean time to dispatch (MTTD) | < 72 hours | Determines O&M contractor quality |
| Mean time to repair (MTTR) | < 7 days | Drives total energy loss per event |
| First time fix rate | > 80% | Avoids repeat truck rolls |
Truck rolls cost $400 to $1,200 each in the US, and a missed first time fix doubles that. A monitoring platform with diagnostic detail (string level current, inverter error codes, DC voltage curve) lets the field tech bring the right parts and tools on the first visit. For more on this topic, see DC Bus Voltage Optimization.
Monitoring Platform Comparison
The commercial monitoring market has consolidated to roughly six platforms that handle C&I assets seriously. Choosing one is mostly a data export, alert routing, and inverter coverage question, not a UI question.
Commercial Solar Monitoring Platform Comparison — 2026
| Platform | Best For | Inverter Brand Coverage | Revenue Grade Meter | API / Data Export | Typical Annual Cost (500 kWp) |
|---|---|---|---|---|---|
| Locus Energy | Independent C&I, IPP fleet | 30+ brands via Modbus | Native; default 0.5% class | REST API, scheduled CSV, OData | $600–$1,200 |
| Also Energy (PowerTrack) | Mid market C&I, EPCs | 25+ brands, strong with SolarEdge, SMA | Native option | REST API, CSV | $700–$1,500 |
| Solar-Log | Europe, utility reporting | 50+ brands, strong with Fronius, Kostal | External meter required | Modbus TCP, FTP push, CSV | €500–€1,100 |
| Power Factors (Drive + Greenbyte) | Large fleets, institutional IPPs | 60+ brands via SunSpec | Native | REST, GraphQL, full data lake | $1,000–$3,000+ |
| SmartSolar / Enphase Enlighten Pro | Small commercial under 250 kW | Microinverter and Enphase only | External meter | Limited API | $400–$900 |
| SolarEdge Monitoring Platform | SolarEdge inverters only | SolarEdge native | Native | Modbus, REST | Included with inverter |
What Each Platform Is Actually Good At
Locus Energy. The closest thing to a default for independent C&I asset management. Strong on revenue grade meter integration, lender reporting templates, and inverter brand neutrality. Weaker on demand charge tracking (you need to feed it building load data separately).
Also Energy (PowerTrack). Now part of Stem after the 2023 acquisition. The product is strong for EPC handoff workflows and mid market C&I (250 kW to 5 MW). PowerTrack’s Athena AI integration is the differentiator for sites with batteries.
Solar-Log. The European workhorse. If you have a multi country European C&I portfolio with mixed inverter brands (especially Fronius, Kostal, SMA), Solar-Log handles utility reporting and grid code compliance better than the US platforms. Weaker on demand charge analytics.
Power Factors. After acquiring Greenbyte (wind) and 3megawatt (solar), Power Factors is now the largest independent platform for IPP scale assets. Overkill for single sites under 1 MW; close to mandatory for portfolios above 50 MW. Built in compliance modules for GRESB, SFDR, and CSRD reporting.
SmartSolar and Enphase Enlighten Pro. Both are limited to their own ecosystem. SmartSolar (Victron) is strong for off grid and hybrid commercial. Enphase Enlighten Pro now reaches up to 250 kW commercial and gives microinverter level diagnostics that string monitoring cannot match. For a deeper compare, see our full piece on solar monitoring systems comparison.
SolarEdge Monitoring Platform. Free if you bought SolarEdge inverters. Excellent panel level diagnostics. The lock in is the trade off: switching inverter brand at refresh means switching monitoring platform.
How to Choose
Six questions in order:
- What inverter brands do my current and planned sites use? (Filters the list immediately.)
- Do I need revenue grade meter data for lender or PPA settlement? (Locus, Also Energy, Power Factors are strongest.)
- Do I need demand charge analytics? (Most platforms require external load data; ask for proof.)
- Will I report to GRESB, SFDR, CSRD, or LEED? (Power Factors and Locus have native templates.)
- How many sites under management? (Under 10 sites: smaller platforms work; over 50 sites: Locus or Power Factors.)
- What is the data export contract? (Avoid platforms that lock data in proprietary formats with no bulk export.)
The platform decision is reversible but expensive. Migrating five years of historical data between platforms costs $5,000 to $25,000 in setup and re mapping. Choose for a 10 year horizon.
Building Owner Dashboards vs Installer Dashboards
The single biggest mistake in commercial solar monitoring is giving the building owner the installer’s dashboard. They are different audiences with different needs.
What an Installer Dashboard Should Show
The installer / O&M tech needs operational depth:
- String level current and voltage curves
- Inverter error codes and event log
- Weather adjusted expected vs actual at 15 minute resolution
- Open alarms with severity classification
- Truck roll queue and MTTR tracking
- Fleet view across all managed sites
What a Building Owner Dashboard Should Show
The owner needs financial and operational outcomes:
- Monthly kWh produced (actual vs expected)
- Monthly $ saved on electricity bill
- Monthly $ avoided in demand charges
- System availability % (uptime guarantee tracking)
- CO2 avoided (for ESG and sustainability reports)
- Cumulative lifetime production and savings
A Working Two Tier Setup
| Tier | Audience | Cadence | Format |
|---|---|---|---|
| Tier 1 — Operational | O&M technician, asset manager | 15 minute live + weekly review | Full platform UI |
| Tier 2 — Financial | Building owner, CFO, sustainability lead | Monthly PDF + quarterly review | Branded report (1–2 pages) + read only portal |
The monthly PDF is the single most under invested deliverable in commercial solar. A clean one page report with kWh, $ saved, demand charges avoided, availability %, and CO2 avoided does more for client retention than any dashboard. Most platforms will generate it on a schedule once configured.
Pro Tip — Whitelabel the Owner Dashboard
If you are an EPC or asset manager serving multiple commercial owners, whitelabelling the owner portal (your logo, no platform branding) protects the client relationship and prevents the monitoring vendor from selling around you at renewal. Locus, Also Energy, and Power Factors all support this.
Reporting for ESG, LEED, and Lender Requirements
Commercial solar monitoring data feeds three regulatory or contractual reporting streams in 2026. Each has different requirements, and almost none can be satisfied with kWh alone.
Lender Reporting Requirements
Most C&I solar loans, lease financing, and PPA back leverage facilities require:
| Report | Frequency | Data Required |
|---|---|---|
| Monthly availability report | Monthly | % time system operational vs expected |
| Quarterly performance report | Quarterly | Actual vs expected energy, PR, downtime causes |
| Annual independent engineer review | Annual | Third party validated production, degradation, O&M log |
| Revenue reconciliation | Annual | Revenue grade meter data, PPA settlement statements |
| Insurance loss documentation | As needed | Pre and post event interval data, irradiance data |
The independent engineer (IE) review every 1 to 3 years requires raw interval data exports. Lenders will reject platforms that do not allow third party IE data access. Confirm this in the monitoring contract.
LEED Performance Reporting
LEED v4.1 and v5 require building energy performance data for the Energy and Atmosphere credits. Solar production data must be:
- Time stamped at 15 or 60 minute intervals
- Sourced from a meter with ANSI C12.20 0.5% class accuracy (or local equivalent)
- Aggregated to monthly totals for ENERGY STAR Portfolio Manager
- Reported as net energy (production minus on site consumption) where applicable
The USGBC’s LEED v4.1 Building Level Energy Metering credit is the reference. Inverter only data will not meet LEED requirements; a revenue grade meter is required.
ESG and GRESB Reporting
GRESB v5 (effective 2026), CDP Climate Change, and SFDR Article 9 funds all require asset level monthly interval data, not just annual production totals. Specifically:
- Monthly kWh produced (asset level)
- Annual CO2 emissions avoided (using local grid emission factor)
- System availability %
- Capacity factor over the period
- O&M incidents log
- For SFDR: alignment with EU Taxonomy substantial contribution criteria
For institutional investors, missing GRESB data costs portfolio rating, not just compliance points. Asset managers running funds with GRESB participation should confirm their monitoring platform can produce GRESB v5 templates natively.
PPA Settlement Reporting
For Power Purchase Agreement structured sites, the monthly settlement statement is calculated from revenue grade meter data. A PPA settled on inverter readings (typically 2 to 5% accurate) leaks 1 to 3% of total revenue to measurement error. On a 1 MW asset producing $135,000 per year, that is $1,350 to $4,050 per year. A revenue grade meter that costs $1,200 to $2,500 installed pays back in one year.
For broader project context, our commercial solar ROI calculator walks through how monitoring data integrates with the financial model used for solar proposal software delivered to clients.
Common Monitoring Mistakes (And How to Avoid Them)
After 300+ C&I commissionings, the same monitoring mistakes show up. Five of them eat the majority of avoidable ROI loss.
Mistake 1: No Baseline
Sites commissioned without a defined Year 1 expected energy curve have no reference for what “good” looks like. The fix is to lock the expected production model at commissioning, using the same software that produced the proposal. The expected energy file should become part of the project handoff documents and feed directly into the monitoring platform.
Mistake 2: Too Many False Alarms
A monitoring system that fires 30 alerts per inverter per month gets ignored. Alert fatigue is real. The fix is to:
- Set hard alarms (inverter offline, zero output during sun hours) at high priority with SMS and email
- Set soft alarms (PR drift, string variance) at low priority with weekly digest only
- Require alerts to persist for 15 to 60 minutes before firing
- Use seasonal baselines so winter performance does not trigger summer alerts
Target: fewer than 2 false alarms per inverter per month.
Mistake 3: Missing Inverter Clipping
Sites with high DC overbuild (DC/AC ratio > 1.30) lose 2 to 4% of annual production to clipping. This is often invisible because the inverter produces its rated AC output. The kWh number looks fine. Only by comparing weather adjusted expected to actual at high irradiance hours does the clipping show up. Configure the monitoring platform to flag hours where actual output is capped at inverter AC nameplate while irradiance is above 800 W/m².
Mistake 4: Single Point Pyranometer Failure
A site with one pyranometer and no satellite irradiance fallback loses its weather adjusted forecasting capability the day that sensor drifts or fails. Two fixes:
- Install two pyranometers and compare them weekly
- Or use satellite irradiance as primary and pyranometer as validation
Mistake 5: No Data Export Plan at Contract Signing
Three years into a monitoring contract, the platform is bought, sold, repriced, or sunset. Owners without a data export clause in the contract lose access to their history. Always negotiate:
- Right to bulk export raw 15 minute interval data at any time
- Annual export of all historical data in standard CSV format
- 90 day data retention guarantee after contract termination
Mistake 6: Confusing Inverter Data with Revenue Grade Data
Lender, PPA, ITC, and LEED reports require revenue grade meter data (0.5% accuracy class). Inverter internal output is typically 2 to 5% accurate. Using inverter data for these reports invalidates them. A revenue grade meter is a $1,200 to $2,500 install line item that owners should not skip.
ROI Example: 1 MW Office Park, Los Angeles
To pull this all together, here is the full monitoring ROI math for a real shape commercial site.
Site Profile
| Parameter | Value |
|---|---|
| System size | 1 MW DC (850 kW AC) |
| Location | Los Angeles, CA |
| Annual production | 1,650,000 kWh |
| Utility tariff | SCE TOU-GS-3-E |
| Pre solar peak demand | 540 kW |
| Post solar peak demand | 470 kW |
| Self consumption rate | 78% |
| Effective $/kWh self consumed | $0.18 |
| Effective $/kWh exported | $0.07 |
Annual Monitoring Value Streams
| Value Stream | Annual $ | How It Is Captured |
|---|---|---|
| Fault detection (typical commercial) | $5,800 | MTTR reduced from 18 to 4 days; ~2 events/yr |
| PR drift catch (early) | $4,200 | 3% PR drift caught within 25 days |
| Demand charge avoidance (validated) | $11,760 | 15 minute interval data tracking |
| Revenue grade meter (vs inverter only) | $2,800 | PPA settlement accuracy |
| O&M truck roll avoidance | $1,800 | First time fix rate >80% |
| Total annual monitoring value | $26,360 | |
| Monitoring platform cost | $1,400 | Locus or Power Factors mid tier |
| Net monitoring ROI | $24,960/yr | 18.8x annual platform fee |
25 Year NPV
At 5% discount rate and 2% utility escalation:
| Value Stream | 25 Yr NPV |
|---|---|
| Fault detection | $89,000 |
| PR drift catch | $64,000 |
| Demand charge avoidance | $179,400 |
| Meter accuracy | $42,700 |
| Truck roll avoidance | $27,500 |
| Total monitoring NPV (25 yr) | $402,600 |
| Platform cost NPV | $21,400 |
| Net monitoring NPV | $381,200 |
For a 1 MW commercial asset, professional monitoring delivers roughly $381,000 of value over 25 years on $21,000 of cost. The 18x ROI is consistent with the NREL fleet data and the Power Factors customer base benchmarks.
Pairing Monitoring with Design Software
The reason monitoring is hard for many commercial sites is that the design and the monitoring stack do not share the same expected energy model. The proposal said 1,650,000 kWh/year. The monitoring platform was built with default assumptions that produce 1,720,000 kWh/year. Year 1 actual is 1,610,000 kWh. Is that a 2.4% shortfall against the proposal or a 6.4% shortfall against the platform? Nobody knows.
The fix is to use the same model for design, proposal, and monitoring expected energy. Modern solar design software exports the expected energy curve directly to the monitoring platform at commissioning, so both stacks reference the same baseline. See our commercial solar design software buyer guide for the full evaluation criteria.
The same logic applies to solar shadow analysis software: the shading model used at design time should match the irradiance loss assumption fed into the monitoring forecast. Mismatches between these two models are the most common reason commercial sites “underperform” in Year 1 with no actual equipment problem.
Conclusion
Commercial solar monitoring in 2026 is not a dashboard. It is a financial system that captures fault detection value, demand charge avoidance, PPA settlement accuracy, and lender compliance, against an annual platform fee that is typically 2 to 18% of the value it returns.
The eight metrics that drive commercial solar monitoring ROI are performance ratio, specific yield, weather adjusted expected energy, inverter availability, string current variance, demand charge avoidance, revenue grade meter accuracy, and mean time to repair. None of them are kWh. All of them turn raw data into operational and financial outcomes.
Three actions for 2026:
- Audit your current monitoring platform against the eight metrics above. If demand charge avoidance is not tracked at 15 minute resolution, that is the first gap to close.
- Confirm a revenue grade meter (ANSI C12.20 0.5% class) is installed at every commercial site over 100 kW. The $1,200 to $2,500 install pays back in PPA settlement accuracy alone within 12 months.
- Negotiate data export rights into every monitoring contract before signing. The cost of switching platforms in Year 5 without your historical data is far higher than the cost of negotiating the clause at Year 0.
For deeper reads, see our guides to commercial solar system design, the commercial solar proposal software workflow, and the solar monitoring systems comparison. For market context on where C&I is heading, see our commercial solar market outlook 2026.
Frequently Asked Questions
What is the most important commercial solar monitoring metric beyond kWh?
Performance Ratio (PR) is the single most important metric beyond kWh because it normalises actual output against expected output given real irradiance and temperature. A 500 kWp system with a 5% PR drop loses about $3,500 per year at $0.14/kWh retail. PR captures inverter clipping, soiling, shading, string faults, and degradation in one number.
How do you calculate ROI from commercial solar monitoring?
Commercial solar monitoring ROI is calculated by summing four value streams: avoided lost production from earlier fault catch, avoided demand charges from confirmed peak shaving, avoided truck rolls from remote diagnostics, and avoided contract penalties from accurate availability reporting. A typical 500 kWp C&I asset sees $4,000 to $9,000 per year of measurable monitoring value.
What is a good performance ratio for commercial solar?
A well sited commercial PV system on a fixed tilt rooftop should land between 78% and 85% PR over the first five years. Tracker driven ground mount systems often hit 82% to 87%. Anything below 75% on a Year One asset indicates a real problem, and anything below 70% should trigger a site visit within 30 days.
What is demand charge avoidance tracking and why does it matter?
Demand charge avoidance tracking uses 15 minute interval data to measure how much solar reduced the building’s peak kW reading in each billing window. Commercial utility bills often charge $10 to $25 per kW of monthly peak, so a 50 kW peak reduction is worth $6,000 to $15,000 per year. Without interval data, this value is invisible to owners.
Which commercial solar monitoring platform is best?
It depends. Locus Energy and Power Factors lead on independent fleet management. Also Energy is strong for mid market C&I and EPC tools. Solar-Log is widely used for European installs with utility reporting. SmartSolar and Enphase Enlighten are stronger for residential and small commercial. Choose on data export rights, alert routing, and inverter brand coverage.
How often should commercial solar monitoring data be reviewed?
Three cadences work best. Automated alerts run every 15 minutes for hard faults. A human reviews the asset weekly for PR drift and string level losses. A monthly report compares expected versus actual energy, demand charge avoidance, and revenue. Lender, ESG, and LEED reporting is typically quarterly.
What is a false alarm in solar monitoring and how do you avoid it?
A false alarm is a monitoring alert triggered by normal behaviour, such as cloud cover, scheduled grid curtailment, or planned maintenance. The fix is to set thresholds with seasonal baselines, require alerts to persist for 15 to 60 minutes, and separate hard alarms (inverter offline) from soft alarms (PR drift). Aim for fewer than two false alarms per inverter per month.
What reports do commercial solar lenders and ESG auditors require?
Lenders typically require monthly availability reports, annual revenue reconciliation, and an independent engineer’s review every two to three years. LEED and ESG reporters need annual kWh production, CO2 avoided, building energy intensity (EUI), and timestamped data from a third party verified meter. GRESB and CDP submissions usually need monthly interval data exports.


