Quick Answer
Solar storage attachment rates in 2026: California 35–45% (NEM 3.0 driven), Germany 25–30% (KfW battery grants), Australia 20–25%, UK 15–20%, and US national average 25%. Markets with time-of-use rates or reduced net metering see higher attachment. Battery attachment increases average project value by $10,000–$20,000.
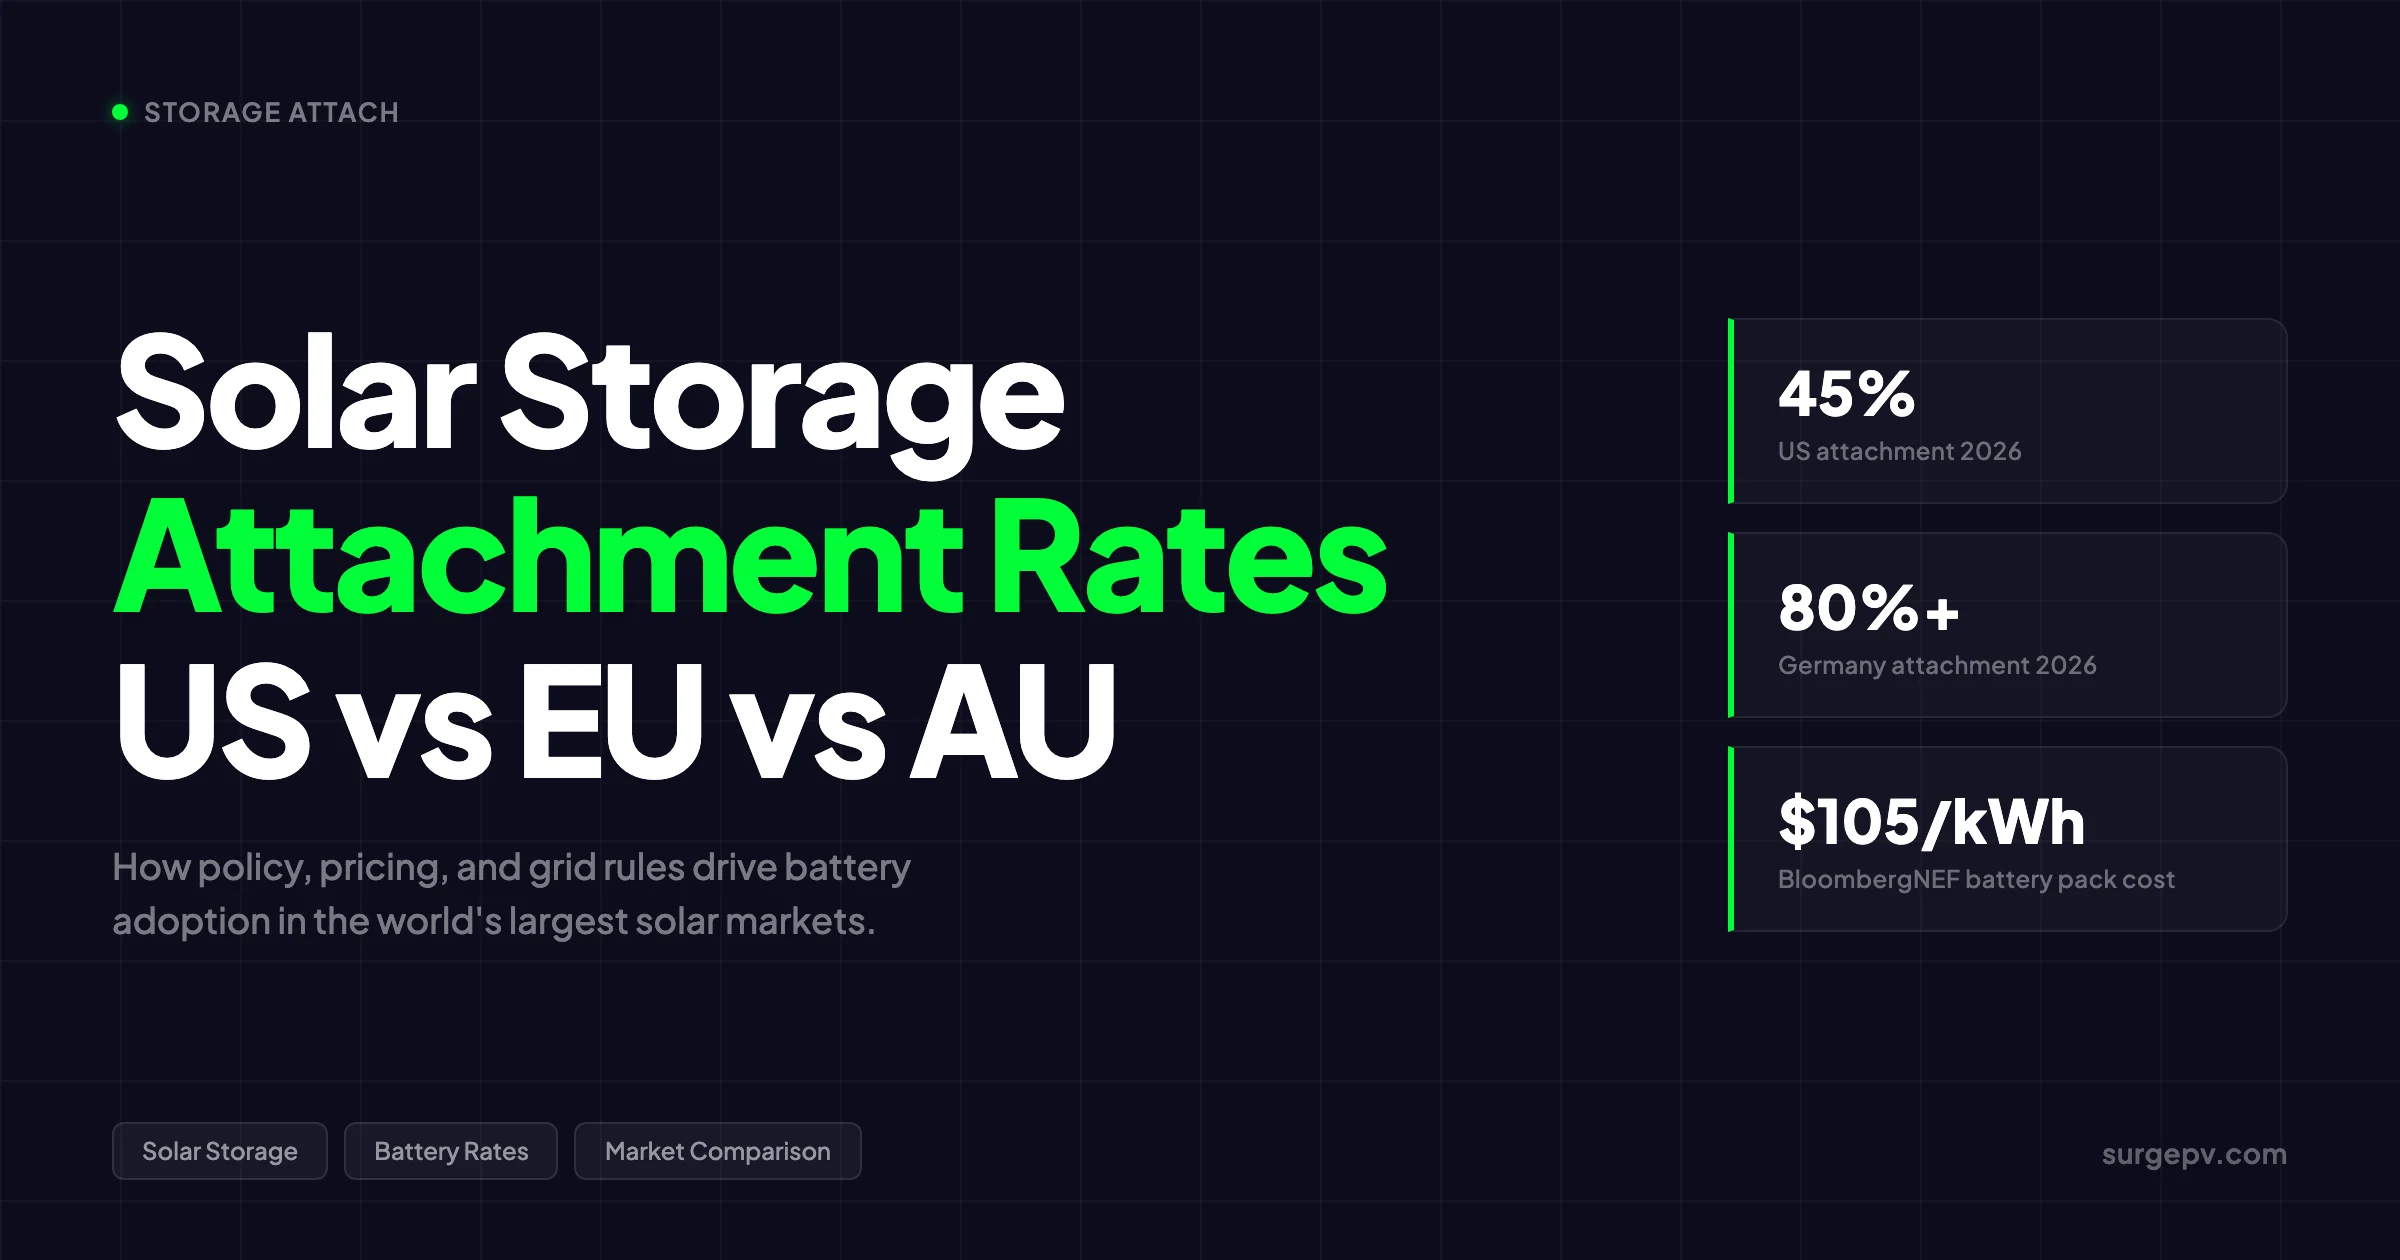
US residential solar storage attachment hit 45% in early 2026, according to EnergySage marketplace data. In Germany, the figure for new residential installations is above 80%. The gap is not about battery cost — Germany’s installed battery prices are not dramatically lower than California’s. It is about why people buy solar in each market, what the grid pays for exports, and whether the economics force self-consumption or reward it. Also see: Germany solar subsidies.
Solar storage attachment rates in 2026: California 35–45% (NEM 3.0 driven), Germany 25–30% (KfW battery grants), Australia 20–25%, UK 15–20%, and US national average 25%. Markets with time-of-use rates or reduced net metering see higher attachment. Battery attachment increases average project value by $10,000–$20,000. For the latest details on UK, see Battery Solar System Design UK. For Australia-specific compliance details, see Australia comparisons/lgc-vs-stc.
Solar storage attachment rates in 2026: California 35–45% (NEM 3.0 driven), Germany 25–30% (KfW battery grants), Australia 20–25%, UK 15–20%, and US national average 25%. Markets with time-of-use rates or reduced net metering see higher attachment. Battery attachment increases average project value by $10,000–$20,000.
This guide compares solar storage attachment rates across the four largest residential solar markets: the United States, Germany, Australia, and the United Kingdom. We look at the policy mechanisms that drive or suppress battery adoption, the real costs and paybacks in each market, the technology trends reshaping product choice, and the misconceptions that distort most industry reporting on this topic.
Quick Answer — Solar Storage Attachment Rates 2026
US: ~40-45% nationally, 69% in California. Germany: above 80% for new residential. Australia: ~25-30% and climbing rapidly with CHBP subsidies. UK: ~20% official (MCS), but true rate likely 50-70%+ due to non-mandatory certification. The single biggest driver is the gap between retail electricity price and export compensation rate. Where that gap is wide (Germany, California NEM 3.0), batteries become standard. Where net metering is generous (legacy US states), attachment rates stay low.
In this guide:
- Storage attachment rate snapshot by country — 2026 comparison table
- US market: why storage went mainstream and where it stalled
- Germany: feed-in tariffs, self-consumption, and the storage decision
- Australia: high penetration, export limits, and battery economics
- UK: export tariffs, SEG, and the hidden attachment rate
- What most storage attachment reports get wrong (contrarian take)
- Battery technology trends in 2026 — LFP dominance, DC vs AC coupling
- Cost trajectory and payback by market
- 2027-2030 outlook: which markets catch up
- Frequently asked questions
Storage Attachment Rate Snapshot by Country 2026
The table below summarizes the key metrics for each market. These figures are drawn from official sources where available — EnergySage and Wood Mackenzie/SEIA for the US, BSW-Solar and Bundesnetzagentur for Germany, CER and SunWiz for Australia, and MCS and SunWiz for the UK.
| Metric | United States | Germany | Australia | United Kingdom |
|---|---|---|---|---|
| Attachment Rate (New Residential) | 40-45% | above 80% | ~25-30% | ~20% official / 50-70%+ actual |
| Leading State/Region | California (69%) | Nationwide uniform | Queensland + NSW | Southeast England |
| Avg. Battery Size (Residential) | 13 kWh | 8-10 kWh | 10-14 kWh | 5-10 kWh |
| Median Battery Cost (Installed) | $11,000-15,000 | €5,500-8,000 | AUD $7,000-12,000 | £4,000-7,000 |
| Retail Electricity Price | $0.14-0.32/kWh | €0.35-0.40/kWh | AUD $0.25-0.35/kWh | £0.30-0.36/kWh |
| Export Compensation Rate | Varies widely | €0.08-0.12/kWh | AUD $0.05-0.16/kWh | £0.15-0.20/kWh (SEG) |
| Primary Policy Driver | NEM 3.0 / ITC | EEG feed-in tariff | CHBP / STCs | SEG / zero VAT |
| Top Battery Brand | Tesla Powerwall (63%) | BYD / Sungrow | Tesla / BYD | Tesla / GivEnergy |
| Payback (Battery Only) | 7-12 yr | 6-10 yr | 8-14 yr | 10-15 yr |
Sources: EnergySage Intel H2 2024; Wood Mackenzie/SEIA US Solar Market Insight 2026; BSW-Solar Q1 2026; CER Australia March 2026; MCS UK 2025 annual data; SunWiz analysis. Attachment rates are for new residential PV installations co-located with battery storage. Payback figures are indicative and vary by household consumption profile. Read Adding Battery Storage Services for a complete walkthrough.
The pattern is clear. Markets with a wide spread between retail electricity price and export compensation rate show high attachment rates. Germany’s retail rate of €0.35-0.40/kWh against an export value of €0.08-0.12/kWh creates a €0.25-0.30/kWh incentive to store and self-consume. California’s NEM 3.0 export rates of $0.05-0.08/kWh against retail rates of $0.28-0.32/kWh produce a similar dynamic. In markets where export compensation is closer to retail — legacy US net metering at 1:1, or the UK’s SEG at £0.15-0.20/kWh against retail of £0.30-0.36/kWh — the economic case for batteries is weaker and attachment rates are lower.
Key Takeaway
The attachment rate is not a technology adoption curve. It is a policy arbitrage indicator. When grid export is worth almost as much as grid import, homeowners do not need batteries. When export is worth a fraction of import, batteries become essential equipment.
US — Why Storage Went Mainstream and Where It Stalled
The US residential solar storage market crossed a threshold in 2024-2025. National attachment rates more than doubled from roughly 20% in 2022 to 40-45% in 2025-2026. But the national figure hides enormous state-level variation. California is at 69%. Texas is growing fast but from a lower base. The Northeast and Midwest still see attachment rates below 30% in many markets.
The California Effect
California drives the US narrative because it is the largest residential solar market and the most advanced in storage adoption. The state’s transition from Net Energy Metering 2.0 (NEM 2.0) to Net Billing (NEM 3.0) in April 2023 was the single most consequential policy shift for US residential storage.
Under NEM 2.0, homeowners received full retail credit for exported solar. A kilowatt-hour sent to the grid at noon was worth the same as a kilowatt-hour drawn at 8 PM. Batteries made little economic sense. Under NEM 3.0, export credits are based on avoided cost — roughly $0.05-0.08/kWh at midday, versus retail rates of $0.28-0.32/kWh. The incentive to self-consume became immediate and powerful.
California’s attachment rate jumped from roughly 15-20% under NEM 2.0 to above 60% within 18 months of NEM 3.0 taking effect. By Q4 2025, Sunrun reported a 71% attachment rate. Wood Mackenzie and SEIA confirmed California at 69% for 2026.
This is not a consumer preference story. It is a price signal story. When export is worth 20-25% of retail, homeowners do the math quickly.
National Attachment Rate Disparity
| State/Region | Estimated Attachment Rate | Key Driver |
|---|---|---|
| California | 69% | NEM 3.0 net billing |
| Hawaii | 80%+ | No net metering; TOU rates |
| Texas | 35-45% | Grid instability; no net metering |
| Arizona | 30-40% | APS export rates cut |
| Nevada | 25-35% | NEM 3.0-style transition |
| Northeast (MA, NY, NJ) | 20-30% | SREC markets; legacy NEM |
| Midwest | 15-25% | Generous net metering still active |
| Southeast | 10-20% | Utility resistance; low rates |
Sources: EnergySage marketplace data; Wood Mackenzie/SEIA US Solar Market Insight; state utility commission filings. Figures are estimates based on available data and installer surveys.
The Midwest and Southeast lag because legacy net metering is still in place. In states where 1:1 net metering persists, the economic case for a $12,000 battery is weak. A homeowner in Ohio with full net metering can export summer afternoon production and draw it back in winter evenings at full credit. Why spend $12,000 to shift energy by a few hours when the grid does it for free?
This creates a perverse dynamic. The states with the most generous solar policies (legacy net metering) now have the lowest storage attachment rates. The states that reduced solar compensation (California, Hawaii) drove the fastest battery adoption.
For installers running site assessments across these mixed-policy states, solar shadow analysis software helps quantify generation patterns that determine self-consumption potential before battery sizing decisions are finalized. Detailed shading data from PVGIS or US-equivalent irradiance databases is essential input.
US Battery Brand Landscape 2026
Tesla Powerwall dominates the US residential battery market with 61-70% market share depending on the data source. EnergySage Marketplace data from H2 2024 shows Tesla at 63%, Enphase IQ Battery at 17%, and SolarEdge Home Battery at 10.6%. The top three brands control over 90% of the market.
| Brand | Market Share | Typical Capacity | Price per kWh |
|---|---|---|---|
| Tesla Powerwall 3 | 63% | 13.5 kWh | ~$983 |
| Enphase IQ Battery 5P | 17% | 5.0 kWh (scalable) | ~$1,510 |
| SolarEdge Energy Bank | 10.6% | 9.7 kWh | ~$1,336 |
| FranklinWH aPower | 3.9% | 13.6 kWh | ~$1,200 |
| LG RESU Prime | 1.9% | 16 kWh | ~$1,100 |
Source: EnergySage Intel Report H2 2024; AgentSolar.ai installation quote data through March 2026. Prices are median installed cost per kWh including inverter and installation labor.
Tesla’s pricing is mid-range, not budget. Its dominance comes from brand recognition, installer familiarity, and the integrated hybrid inverter in Powerwall 3, which simplifies installation. Enphase commands a premium for its microinverter-based AC-coupled architecture, which appeals to installers already using Enphase microinverters on the PV side.
The Texas Wildcard
Texas is the most interesting US market to watch in 2026-2027. The state has no net metering mandate, volatile wholesale electricity prices (including negative pricing events), and a grid reliability reputation that makes backup power a genuine selling point. Attachment rates in Texas major metros (Houston, Dallas, Austin) are estimated at 35-45% and climbing.
The February 2021 Uri winter storm, the 2023 summer heat emergencies, and ongoing ERCOT volatility have created a unique US market where backup power is a primary purchase driver, not just an economic optimization. This is closer to the Australian dynamic than the California dynamic.
Germany — Feed-in Tariffs, Self-Consumption, and the Storage Decision
Germany’s solar battery attachment rate of above 80% is the highest of any major market. But the story is more nuanced than the headline figure suggests. Germany has roughly 5.9 million PV systems totaling over 121 GW of capacity. Only about 2.5 million of those have batteries. The 80%+ figure applies to new residential installations. The cumulative penetration of batteries across all German solar households is closer to 40%.
This distinction matters because Germany’s solar market is increasingly a retrofit market. Hundreds of thousands of systems installed during the 2000-2012 feed-in tariff boom are reaching the end of their 20-year guaranteed payment periods. Those homeowners face a choice: continue operating the system without FIT income, add a battery and shift to self-consumption, or replace the entire system. Also see: Us Residential Solar Market Trends 2026.
Why New German Solar Almost Always Includes a Battery
Three structural factors make batteries standard equipment for new German residential solar:
1. The feed-in tariff gap. New systems under the EEG 2023 framework receive roughly €0.08-0.12/kWh for exported energy. Retail electricity prices for German households average €0.35-0.40/kWh. Every kilowatt-hour stored and self-consumed saves €0.25-0.30. Over a year, a 10 kWh battery cycling daily can shift 3,000-3,500 kWh from export to self-consumption, worth €750-1,050 annually.
2. Twenty years of policy conditioning. Germany’s solar market has been shaped by two decades of energy transition policy. Installers, banks, and homeowners all understand self-consumption economics. Battery storage is not an upsell — it is part of the standard system design. German solar installers using solar design software typically model battery scenarios by default.
3. High retail electricity prices. Germany has among the highest residential electricity prices in the world. The price is driven by taxes, levies, and grid fees, not generation costs. This makes self-consumption extremely valuable regardless of what happens to wholesale power markets.
For accurate ROI modeling on German projects, the SurgePV generation and financial tool integrates BNetzA tariff data, regional irradiance from BSW-Solar, and self-consumption optimization based on real load profiles. The 30% delta between self-consumption rates of 35% vs 75% completely changes the battery sizing recommendation. For a direct comparison, see Arka 360 vs SurgePV.
German Battery Market Data Q1 2026
Germany added over 2 GWh of battery storage in Q1 2026, up 67% year-over-year. Residential storage (5-20 kWh systems) was roughly flat in unit terms but stable at high volume. Large-scale systems quadrupled. Cumulative German battery capacity reached approximately 28 GWh across 2.4+ million installations by end of March 2026.
| Segment | Q1 2026 Additions | Change vs Q1 2025 |
|---|---|---|
| Residential (5-20 kWh) | ~0.74 GWh | Largely constant |
| Commercial | ~0.16 GWh | +42% |
| Large-scale (>1 MWh) | >1 GWh | +270% |
| Total | >2 GWh | +67% |
Source: German Solar Association (BSW-Solar) Q1 2026 data; Battery Charts segment analysis. March 2026 alone saw 522.9 MW / 985.9 MWh added, with roughly 45,000 residential systems registered.
The residential segment is stable but not growing dramatically in percentage terms. The real growth story is large-scale and commercial. Germany’s grid-scale battery pipeline is expanding rapidly as the country integrates variable renewables and prepares for coal phase-out.
German Battery Brands
The German residential battery market is more fragmented than the US. BYD Battery Box, Sungrow, LG Chem RESU, E3/DC, and Sonnen are the leading brands. Tesla Powerwall has a presence but is not dominant. German consumers show strong preference for locally supported brands with German-language service and VDE certification.
| Brand | Typical Capacity | Price Range (Installed) |
|---|---|---|
| BYD Battery Box Premium HVM | 8-22 kWh (modular) | €4,500-9,000 |
| Sungrow SBR | 9.6-25.6 kWh (modular) | €5,000-10,000 |
| E3/DC S10 | 4.5-13.5 kWh | €5,500-9,500 |
| SonnenBatterie | 5-20 kWh | €6,000-12,000 |
| LG Chem RESU | 6.5-16 kWh | €4,000-7,500 |
Price ranges include installation and VAT. Actual prices vary by installer and region.
Narrative Fragment: The Mueller Family in Bavaria
The Muellers live in a detached house near Munich. In 2019 they installed a 7 kWp solar system with a 10 kWh BYD Battery Box. Their annual electricity consumption is 4,500 kWh. Before the battery, their self-consumption rate was 35%. With the battery, it rose to 72%.
Their system cost €18,500 all-in, including the battery. The battery alone added roughly €6,000. Their annual electricity bill fell from €1,800 to €480. The battery contribution to that saving is approximately €650 per year — the value of shifted solar energy that would otherwise have been exported at €0.09/kWh and is now consumed at €0.38/kWh.
Battery-only payback: roughly 9 years. But the Muellers did not buy the battery for payback alone. They bought it because their installer presented it as standard equipment, because their neighbors all have batteries, and because the idea of exporting valuable midday solar for pennies feels wrong. The economics work. The social norm is stronger.
Australia — High Penetration, Export Limits, and Battery Economics
Australia has the highest rooftop solar penetration rate in the world. Over one-third of Australian households have solar panels. The country has 3.8 million CER (Consumer Energy Resource) solar installations totaling 25.5 GW. But battery attachment has historically lagged — until 2025-2026, when policy intervention changed the trajectory.
The CHBP Effect
Australia’s federal Cheaper Home Batteries Program (CHBP), launched July 2025, provided approximately 30% upfront discount on home batteries through STCs (Small-scale Technology Certificates). The effect was immediate and dramatic.
- Over 236,000 batteries installed since CHBP launch (through February 2026)
- Cumulative battery installations reached 251,119 by end of March 2026 (AEMO Q1 2026)
- Total battery capacity: 6,716 MWh
- March 2026: record 1.6 GWh installed in a single month (SunWiz data)
The attachment rate for new solar installations is estimated at 25-30% in 2026, up from roughly 10-15% before CHBP. The program caused significant front-loading — consumers rushed to install before the May 2026 STC tier reduction.
State-Level Variation
| State | Cumulative Battery Capacity (MWh, Q1 2026) | Key Driver |
|---|---|---|
| New South Wales | 2,911 | Largest market; high electricity prices |
| Queensland | 1,533 | High solar penetration; export limits |
| Victoria | 1,406 | State battery rebate program |
| South Australia | 812 | Grid instability; blackout history |
| Tasmania | 54 | Smaller market; hydro dominance |
Source: AEMO Q1 2026 Quarterly Energy Dynamics.
South Australia is the most instructive case. The state experienced a statewide blackout in 2016 and has since built a reputation for grid instability. Battery attachment rates in SA are the highest in Australia, with many homeowners citing backup power as the primary motivation. This mirrors the Texas dynamic — when the grid fails, batteries sell themselves.
Queensland and NSW face a different driver: export limits. As rooftop solar penetration has surged, DNSPs (Distribution Network Service Providers) have imposed export limits on new connections. Homeowners in some areas can only export 1.5-3 kW to the grid. Excess midday production is effectively worthless unless stored. This creates a forced-storage dynamic similar to California’s NEM 3.0.
Australian Battery Economics
Australian residential electricity prices range from AUD $0.25-0.35/kWh. Export rates vary: some retailers offer generous feed-in tariffs (AUD $0.12-0.16/kWh), while others offer minimal rates or impose export limits. The spread is narrower than Germany’s, which is why Australian attachment rates remain lower despite high solar penetration.
A typical 10 kWh battery in Australia costs AUD $8,000-12,000 before CHBP discount, or roughly AUD $6,000-9,000 after the 30% STC reduction. Annual savings from self-consumption shifting are AUD $400-700, giving a payback of 8-14 years.
The payback is marginal. Most Australian battery purchases in 2026 are driven by the CHBP subsidy, export limits, or backup power desire — not pure economics. When the CHBP subsidy is fully absorbed, attachment rates may stabilize unless export limits expand.
Australian installers preparing client proposals can use the SurgePV solar proposal software to model state-level retail rates, network export caps from AER-regulated DNSPs, and CHBP subsidy values within a single financial scenario. For context on net metering rules globally, see the net metering glossary entry. For Global-specific compliance details, see Global net-metering-by-country.
UK — Export Tariffs, SEG, and Battery Economics
The UK solar battery market is the most data-challenged of the four. The official MCS (Microgeneration Certification Scheme) data shows a battery attachment rate of approximately 20%. But this is almost certainly a significant undercount.
The Certification Gap
Battery certification is not mandatory in the UK. Installers can install batteries without MCS accreditation, and many do. The administrative burden and cost of adding battery certification to an installer’s license discourages registration. SunWiz analysis concluded that the UK’s “actual battery attachment rate is far greater than previously thought” and is “fast approaching universality” in some regions.
MCS-certified battery installations grew 98.8% year-over-year in 2025, reaching 41,042 units. Over half of all MCS battery installations ever recorded were completed in 2025. March 2026 set a record with 6,346 certified installations. But these are just the certified ones.
Industry estimates suggest the true UK attachment rate is 50-70% or higher. The marginal cost of adding a battery to a new solar installation has fallen to just £1,000-1,500, making it an easy upsell. Unlike Germany, where batteries are standard, the UK market is split: some installers bundle batteries by default, others treat them as an optional extra.
UK Policy Context
The UK’s Smart Export Guarantee (SEG) requires large energy suppliers to offer export tariffs for small-scale generators. Rates vary by supplier:
| Supplier | SEG Rate (p/kWh) | Notes |
|---|---|---|
| Octopus Agile / Flux | 15-30+ | Variable; tracks wholesale |
| Octopus Fixed | 15 | Fixed rate |
| E.ON Next | 16.5p | Fixed |
| British Gas | 15p | Fixed |
| Scottish Power | 15p | Fixed |
Rates as of early 2026. Variable tariffs like Octopus Agile can spike during high-demand periods.
UK retail electricity prices are roughly £0.30-0.36/kWh. The SEG spread is £0.15-0.20/kWh — narrower than Germany’s €0.25-0.30/kWh gap but still meaningful. A 10 kWh battery shifting 3,000 kWh annually saves £450-600 per year. At a marginal add-on cost of £1,500, payback is 2.5-3.5 years for the incremental battery investment.
This is why the true attachment rate is likely far higher than the official 20%. The economics work. The data just does not capture it.
UK Battery Trends
UK battery installations show a trend toward larger systems. The emerging BESS-only segment (batteries without solar, typically 25 kWh+) is growing, driven by time-of-use arbitrage on variable tariffs like Octopus Agile. This is unique among the four markets — standalone battery installations for grid arbitrage are rare in the US, Germany, and Australia.
48V battery systems account for over 50% of recent UK installs, compared to roughly 25% in Australia. This reflects the UK’s preference for lower-voltage, installer-friendly systems that do not require specialized high-voltage training.
UK installers managing complex retrofit projects benefit from solar design software that handles existing inverter compatibility checks, panel-level DC arc fault considerations, and Smart Export Guarantee tariff modeling in a single workflow. Industry data from MCS and Solar Energy UK remains the primary reference for certification trends.
What Most Storage Attachment Reports Get Wrong
Most industry reporting on storage attachment rates makes three errors that distort understanding of the market.
Error 1: Treating attachment rate as a technology adoption curve. The attachment rate is not like smartphone adoption or EV adoption. It is a policy arbitrage indicator. When California had NEM 2.0, attachment was 15-20%. When NEM 3.0 cut export values, attachment jumped to 69% within 18 months. The technology did not change. The price signal did. Reporting that “US battery attachment is growing fast” misses the point. It is growing fast in states that cut net metering. It is stagnant in states that kept it.
Error 2: Comparing official statistics across markets without understanding certification rules. The UK’s official 20% attachment rate looks low compared to Germany’s 80%+. But the UK does not require battery certification. Germany does. Comparing MCS data to BNetzA data is comparing apples to oranges. The true UK rate is likely much closer to Germany’s than the official figures suggest.
Error 3: Ignoring the retrofit market. Germany has 5.9 million PV systems and 2.5 million batteries. The 80%+ attachment rate applies only to new installations. The real question for Germany is not whether new systems include batteries — they do — but how fast the remaining 3.4 million un-batteried systems get retrofitted as early feed-in tariffs expire. This is a massive market that attachment-rate reporting almost entirely misses.
The same retrofit opportunity exists in Australia (3.8 million solar systems, ~250,000 batteries) and will eventually emerge in the US as the 3+ million systems installed during the 2015-2022 boom age out of their productive lives.
Contrarian Take
The next major storage market is not new solar installations. It is retrofitting batteries onto existing solar systems. Germany’s retrofit wave is starting now. Australia’s will follow. The US will see it in the late 2020s. Companies positioned for retrofit installation — AC-coupled batteries, plug-and-play systems, financing for battery-only purchases — will capture growth that attachment-rate-focused analysts are not tracking.
Model Storage Economics for Any Market
SurgePV’s solar design software includes battery storage modeling with market-specific electricity tariffs, export rates, and incentive programs. Compare AC-coupled vs DC-coupled scenarios, size batteries for self-consumption or backup, and show clients accurate payback for US, German, Australian, or UK projects.
Book a DemoNo commitment required · 20 minutes · Live project walkthrough
Battery Technology Trends 2026
The battery technology market shifted decisively in 2024-2026. Three trends dominate: LFP chemistry dominance, DC-coupled integration, and larger average system sizes.
LFP Dominates Stationary Storage
Lithium iron phosphate (LFP) batteries now account for over 90% of new stationary storage installations globally, according to BloombergNEF. LFP overtook NMC (nickel manganese cobalt) in stationary applications because of lower cost, longer cycle life (6,000-10,000 cycles vs 3,000-5,000 for NMC), and improved thermal stability.
| Chemistry | Cycle Life | Cost per kWh | Best For |
|---|---|---|---|
| LFP (LiFePO4) | 6,000-10,000 | $105-130 | Residential, commercial |
| NMC (LiNiMnCoO2) | 3,000-5,000 | $120-150 | EVs, space-constrained |
| Sodium-ion (emerging) | 3,000-4,000 | $80-100 (projected) | Grid-scale, cost-sensitive |
Source: BloombergNEF battery price survey 2025; projected 2026 pricing. Cycle life figures are manufacturer claims under standard test conditions; actual performance varies by temperature, depth of discharge, and charge rate.
For a deeper comparison of battery chemistries for solar applications, see our guide to LFP vs NMC batteries for solar storage. See our guide on Agricultural Solar Case Study for more.
BloombergNEF reports global battery pack prices fell to $108/kWh in 2025 and are projected at $105/kWh for 2026. Stationary storage packs are cheaper than EV packs due to simpler thermal management and the absence of crash-safety requirements. Chinese manufacturing overcapacity continues to drive prices down, with pack-level prices in China at $84/kWh — 44% below North American prices and 56% below European prices. Also see: European Solar Tax Credits.
DC-Coupled vs AC-Coupled: The Tradeoff
The choice between DC-coupled and AC-coupled battery architecture is one of the most consequential technical decisions in a solar+storage system. Each approach has clear advantages and drawbacks. For more on this topic, see AC Coupled vs DC Coupled Battery Solar.
| Factor | DC-Coupled | AC-Coupled |
|---|---|---|
| Round-trip efficiency | 90-95% | 85-90% |
| Best for | New installations | Retrofits; flexible design |
| Inverter requirement | Hybrid inverter (solar + battery) | Separate battery inverter |
| Solar inverter compatibility | Must match hybrid inverter | Works with any solar inverter |
| Installation complexity | Lower (one inverter) | Higher (two inverters) |
| Cost (new install) | Lower | Higher |
| Cost (retrofit) | N/A or high | Lower |
| Backup during outage | Yes (with hybrid inverter) | Yes (with battery inverter) |
| Scalability | Limited by hybrid inverter | High (add batteries independently) |
Efficiency figures are typical; actual performance varies by manufacturer and operating conditions.
Tesla Powerwall 3 uses an integrated hybrid inverter (DC-coupled). Enphase IQ Battery is AC-coupled via microinverters. SolarEdge offers both architectures. For new installations, DC coupling’s 3-5% efficiency advantage and lower hardware cost make it the default choice. For retrofits, AC coupling is often the only practical option without replacing the existing solar inverter.
The retrofit wave discussed earlier strongly favors AC-coupled products. Installers retrofitting batteries onto existing solar systems need solutions that work with the inverter already on the roof. This is why Enphase and SolarEdge’s AC-coupled architectures may see disproportionate growth in the 2026-2030 retrofit market even as DC coupling dominates new installations.
For more on this tradeoff, see our detailed guide to AC vs DC coupled solar storage.
Larger Average System Sizes
Average residential battery sizes are increasing across all markets. In the US, the average grew from 9 kWh in 2021 to 13 kWh in 2025-2026. In Australia, March 2026 saw the average battery size hit a record 40 kWh — though this includes some larger commercial-residential systems. In Germany, 10-15 kWh is now standard for a typical 7-10 kWp solar system.
The driver is simple: as battery costs fall per kWh, the marginal cost of adding capacity decreases. A homeowner installing a 10 kWh battery for €6,000 faces only a small incremental cost to upgrade to 15 kWh. Larger batteries also extend backup duration and increase self-consumption rates.
Cost Trajectory and Payback by Market
Battery economics vary dramatically by market. The tables below show installed costs, annual savings, and payback periods for a typical 10 kWh residential battery in each country.
Battery Cost Comparison 2026
| Market | 10 kWh Battery (Installed) | Cost per kWh | Key Incentive |
|---|---|---|---|
| United States | $10,000-14,000 | $1,000-1,400 | ITC (30% through 2032) |
| Germany | €5,000-8,000 | €500-800 | None specific; VAT reduced |
| Australia | AUD $7,000-11,000 | AUD $700-1,100 | CHBP (~30% STC discount) |
| United Kingdom | £4,000-7,000 | £400-700 | Zero VAT on battery+ solar |
Costs include battery, inverter (if needed), installation, and applicable taxes. US costs are before ITC; Australian costs are before CHBP discount. Actual prices vary by installer, region, and system configuration.
Battery-Only Payback by Market
| Market | Annual Savings (10 kWh) | Payback (Years) | Key Assumptions |
|---|---|---|---|
| Germany | €750-1,050 | 6-10 | €0.38 retail, €0.09 export, 3,000 kWh shifted |
| California (NEM 3.0) | $700-1,100 | 7-12 | $0.30 retail, $0.06 export, TOU optimization |
| Australia | AUD $400-700 | 8-14 | AUD $0.30 retail, AUD $0.08 export, CHBP applied |
| UK | £450-650 | 10-15 | £0.33 retail, £0.15 SEG, marginal add-on cost |
| Texas | $500-900 | 8-14 | $0.14-0.20 retail, no net metering, backup value |
Payback calculations are indicative and vary significantly by household consumption profile, electricity tariff structure, and local installer pricing. Annual savings assume daily cycling during solar production months and partial cycling in winter.
The payback table reveals why attachment rates follow the pattern they do. Germany’s 6-10 year payback is the shortest because the retail-export spread is widest. California’s 7-12 year payback is acceptable for most homeowners, especially when backup power value is included. Australia’s 8-14 year payback is marginal without the CHBP subsidy. The UK’s 10-15 year payback at full standalone cost explains why many UK batteries are sold as marginal add-ons rather than standalone purchases.
Pro Tip — Sizing Batteries for Payback
The most common battery sizing error is oversizing. A battery that cycles only 200 days per year because the household does not generate enough excess solar delivers worse economics than a smaller battery that cycles 300+ days. Size the battery to match average daily solar surplus, not peak surplus. For most residential systems, this means 1-1.5 kWh of battery per kWp of solar capacity. A 7 kWp system pairs well with an 8-10 kWh battery.
For detailed battery sizing guidance, see our guide to residential battery sizing in kWh.
2027-2030 Outlook — Which Markets Catch Up
The next four years will see significant shifts in storage attachment rates across all four markets. Here is what to expect.
United States: Toward 60-70% National Average
California’s 69% attachment rate is the new normal for markets with NEM 3.0-style net billing. As more states transition away from 1:1 net metering — Arizona, Nevada, and Hawaii have already moved; Colorado, New Mexico, and others are considering it — the national average will rise. BloombergNEF and Wood Mackenzie project US residential storage additions of 3-5 GWh annually through 2030.
The wildcard is federal policy. The Investment Tax Credit (ITC) at 30% for solar+storage runs through 2032, providing stable support. If Congress extends or expands storage-specific incentives, attachment rates could accelerate faster.
Texas is the market to watch. If Texas reaches California-level attachment rates, it would unlock an estimated 2 GWh of annual residential battery demand by 2030.
Germany: The Retrofit Wave
Germany’s new-installation attachment rate will remain above 80%. The growth story is retrofitting. Roughly 3.4 million German solar systems lack batteries. As systems installed in 2005-2010 lose their 20-year feed-in tariff guarantees, owners face a choice. Many will add batteries rather than replace entire systems.
BSW-Solar estimates the German retrofit battery market at 200,000-400,000 systems per year by 2028-2030. This is larger than the new-installation battery market. Products designed for easy retrofit — AC-coupled, compatible with legacy inverters, plug-and-play installation — will capture disproportionate share.
Australia: Post-Subsidy Stabilization
Australia’s attachment rate surged to 25-30% on CHBP subsidy-driven demand. When the subsidy is fully absorbed, the rate may stabilize or dip unless export limits expand. The key variable is DNSP export restrictions. If more networks impose 1.5-3 kW export caps, batteries become effectively mandatory for systems above 5 kWp.
AEMO’s Integrated System Plan projects 50% of Australian homes will have solar by 2030. If even half of those add batteries, Australia’s cumulative battery stock would exceed 2 million systems — a tenfold increase from today’s 250,000.
United Kingdom: Data Catch-Up
The UK’s official attachment rate will rise toward 40-50% simply because MCS certification requirements may tighten and more installers will register batteries. The true rate is already much higher. The question is whether policy supports further growth.
The zero VAT rate on battery+solar installations (extended through the current parliament) helps. The emerging variable tariff market (Octopus Agile, etc.) creates new arbitrage opportunities for larger batteries. If the UK expands mandatory smart metering and time-of-use pricing, battery economics improve further.
Global Cost Trajectory
BloombergNEF projects battery pack prices below $60/kWh by 2030. At that price, a 10 kWh battery pack costs $600 — less than the installation labor to put it on a wall. Batteries will become standard equipment in solar installations by default, not by choice. The attachment rate conversation will become irrelevant because every system will include storage.
| Year | Projected Pack Price | 10 kWh Pack Cost | Impact on Attachment |
|---|---|---|---|
| 2025 | $108/kWh | $1,080 | Baseline |
| 2026 | $105/kWh | $1,050 | Marginal improvement |
| 2028 | $85-90/kWh | $850-900 | Batteries standard in high-spread markets |
| 2030 | $55-65/kWh | $550-650 | Batteries standard globally |
Source: BloombergNEF Long-Term Electric Vehicle Outlook and Energy Storage Outlook 2025. Projections are subject to raw material price volatility and trade policy changes.
External resources for tracking market data: BloombergNEF publishes annual battery price surveys and storage outlooks. SEIA tracks US installations quarterly. Clean Energy Council Australia publishes biannual rooftop solar and storage reports. SolarPower Europe tracks European storage attachment rates.
Country-Level Deep Dive: Five Pattern Comparisons
Beyond top-line attachment rates, five comparison patterns reveal how solar storage markets actually function. Read more about Floating Solar Farms France.
Pattern 1: Retail-Export Spread Drives Attachment
The single best predictor of battery attachment rate is the gap between what homeowners pay for grid power and what they receive for exports.
| Market | Retail Rate | Export Rate | Spread | Attachment Rate |
|---|---|---|---|---|
| Germany | €0.38/kWh | €0.09/kWh | €0.29 | 80%+ |
| California NEM 3.0 | $0.30/kWh | $0.06/kWh | $0.24 | 69% |
| Hawaii | $0.37/kWh | $0.10/kWh | $0.27 | 80%+ |
| UK (Octopus Fixed) | £0.33/kWh | £0.15/kWh | £0.18 | 50-70% true |
| Australia | AUD $0.30/kWh | AUD $0.08/kWh | AUD $0.22 | 25-30% |
| US Legacy NEM (Midwest) | $0.13/kWh | $0.13/kWh | $0.00 | under 20% |
When the spread is below 50% of retail price, batteries struggle to pay back. When the spread exceeds 70% of retail, batteries become standard. Australia is the outlier with a strong spread but moderate attachment rate, explained by recent subsidy timing and cultural lag.
Pattern 2: Solar System Size Predicts Battery Size
The ratio of battery capacity to solar capacity is remarkably consistent across markets when normalized for self-consumption goals.
| Solar System | Typical Battery (Self-Cons. Optimization) | Typical Battery (Backup Focus) |
|---|---|---|
| 3-5 kWp | 5-7 kWh | 10-13 kWh |
| 5-8 kWp | 8-12 kWh | 13-16 kWh |
| 8-12 kWp | 12-18 kWh | 18-25 kWh |
| 12-20 kWp | 18-30 kWh | 25-40 kWh |
The rule of thumb: 1-1.5 kWh of battery per kWp of solar for self-consumption optimization. For whole-home backup, double that ratio. Markets with strong backup-power motivation (Texas, South Australia, Florida) see larger battery sizes per kWp than markets with pure self-consumption motivation (Germany, California).
Pattern 3: Installer Bundling Determines Adoption Velocity
Germany reached 80% attachment over 15+ years through cultural and policy evolution. California reached 69% in 18 months through a single policy change. The accelerator was installer bundling.
When 90% of installers quote PV + battery as their default proposal, attachment rates rise quickly. When 50% quote PV-only and present batteries as optional upgrades, attachment rates stay below 40%. The installer’s framing matters more than the homeowner’s preference.
US installers operating in markets transitioning from NEM 2.0 to NEM 3.0-style rules have a 12-18 month window to retrain sales teams. Those who shift default proposals first capture market share.
Pattern 4: Cumulative vs New-Install Attachment Tells Different Stories
When discussing attachment rates, always specify which metric:
- New-install attachment: % of new solar systems including batteries (what most reports cite)
- Cumulative attachment: % of all installed solar systems that include batteries (the true market saturation)
- Retrofit attachment: % of existing solar systems adding batteries in a given year
Germany’s 80% new-install rate translates to ~40% cumulative rate. Australia’s 25-30% new-install rate translates to ~8% cumulative rate. The US lacks reliable cumulative data because system age tracking is fragmented across utilities.
For business planning, retrofit attachment is the most important metric. It indicates the size of the addressable retrofit market — the opportunity for AC-coupled batteries, battery-only financing, and installer service offerings.
Pattern 5: Brand Concentration Varies Inversely with Market Maturity
The US has 90%+ market concentration in three brands (Tesla, Enphase, SolarEdge). Germany has 60-70% concentration across five brands. The UK is moving toward concentration. Australia is consolidating.
Newer markets concentrate around the most-marketed brand (Tesla’s case in the US). As markets mature, local brands gain share through service quality, installer relationships, and language support. Germany’s market shows where the US may head in 5-10 years: more brand diversity, less Tesla dominance, more locally-supported products.
Storage Attachment Rate Sources and Methodology
Because this is one of the most-confused metrics in solar reporting, here is a transparent guide to the data behind the numbers in this article.
| Source | Coverage | Methodology | Limitations |
|---|---|---|---|
| EnergySage Marketplace Reports | US national + state | Aggregated quotes through their platform | Sample skews toward online-first consumers |
| Wood Mackenzie / SEIA US Solar Market Insight | US national + state | Utility interconnection data + installer surveys | Quarterly lag; revisions common |
| BSW-Solar Fact Sheets | Germany | BNetzA registration data + industry survey | New installs only; cumulative requires inference |
| Clean Energy Regulator (CER) | Australia | STC certificate data | Captures CHBP-eligible installs; misses some larger systems |
| SunWiz | Australia + UK | Distributor sell-through + installer surveys | Proprietary methodology; estimates have wider error bands |
| MCS UK | UK official | Certification database | Voluntary certification — significant undercount |
| BloombergNEF | Global pack pricing | Manufacturer surveys + market analysis | Pack prices not directly comparable to installed system prices |
When this article cites a percentage, the source is named. When two sources disagree (as on UK attachment), both figures are provided with context.
Conclusion
Solar storage attachment rates in 2026 tell a clear story: batteries follow policy, not preference. Germany’s 80%+ rate exists because feed-in tariffs for new systems are a fraction of retail prices. California’s 69% rate exists because NEM 3.0 made export nearly worthless. Australia’s surge exists because the CHBP subsidy made batteries affordable. The UK’s hidden high rate exists because the marginal cost of adding a battery to solar is now trivial.
The markets with low attachment rates — legacy net metering states in the US, some Australian regions with generous feed-in tariffs — are not laggards. They are rational. When the grid pays full retail for exports, batteries do not pay back.
Three actions for solar professionals tracking this market:
-
Watch policy, not technology. The next attachment rate jump will come from a policy change — a net metering reform, an export limit, a subsidy — not a battery breakthrough. Track state utility commission dockets, not just product launches.
-
Position for retrofit. The largest untapped battery market is existing solar systems. In Germany, 3.4 million systems need batteries. In Australia, 3.5 million. In the US, 3+ million systems installed 2015-2022 will age into retrofit decisions. AC-coupled products and battery-only financing will win here.
-
Use accurate market data. Do not rely on official attachment rates where certification is not mandatory. The UK’s true rate is 2-3x the official figure. Australia’s cumulative penetration is higher than monthly attachment rates suggest. Build business plans on ground truth, not reported statistics.
For solar installers and solar sales professionals building proposals across markets, understanding these attachment rate drivers is essential to pricing, product selection, and client conversations. SurgePV’s solar proposal software includes market-specific tariff modeling, battery payback calculations, and self-consumption optimization for US, German, Australian, and UK projects.
For related reading, see our guides to community solar projects in Germany, European solar incentives, solar energy policies in Europe, and solar energy in Australia.
Frequently Asked Questions
What is the solar storage attachment rate in the US in 2026?
The US residential solar storage attachment rate is approximately 40-45% nationally in 2026, according to EnergySage and industry data. California leads at 69% (Wood Mackenzie/SEIA), driven by NEM 3.0 net billing rules that make self-consumption critical. Sunrun, the largest US residential installer, reports a 71% attachment rate. The national rate has more than doubled since 2022, when it stood at roughly 20%.
Why is Germany’s solar battery attachment rate so much higher than the US?
Germany’s solar battery attachment rate exceeds 80% for new residential installations because of three structural factors: (1) feed-in tariff rates for new systems are far below retail electricity prices, making self-consumption the only viable economic model; (2) 20 years of policy support created a mature installer ecosystem where batteries are standard; and (3) German households face high retail electricity prices (€0.35-0.40/kWh), so shifting solar generation to evening consumption delivers immediate savings. The US, by contrast, had generous net metering until recently, which reduced the economic case for batteries.
What is the UK solar battery attachment rate in 2026?
The official MCS-certified UK battery attachment rate is approximately 20%, but this significantly undercounts actual adoption. Battery certification is not mandatory in the UK, and many installers skip the administrative burden. SunWiz analysis suggests the true UK attachment rate is “fast approaching universality” in some regions, with actual rates likely 50-70% or higher. MCS-certified battery installations grew 98.8% year-over-year in 2025, reaching 41,042 units.
How much does a home solar battery cost in 2026?
Home solar battery costs in 2026 vary by market and chemistry. In the US, median installed cost is $800-1,200/kWh, with a typical 13 kWh system running $10,000-15,000 before incentives. In Germany, a 10 kWh LFP system costs €5,000-8,000 installed. In Australia, the federal Cheaper Home Batteries Program provides roughly 30% upfront discount through STCs, bringing a 10 kWh system to AUD $6,000-9,000. In the UK, marginal battery add-on cost is just £1,000-1,500 when co-installed with solar. BloombergNEF reports global battery pack prices fell to $108/kWh in 2025 and are projected at $105/kWh for 2026.
Which battery brand has the highest market share in 2026?
Tesla Powerwall holds 61-70% of the US residential battery market in 2026, depending on the data source. EnergySage Marketplace data shows Tesla at 63% (H2 2024), while Ohm Analytics reports 70% as of February 2026. Enphase IQ Battery is second at 17%, followed by SolarEdge Home Battery at 10.6%. The top three brands control over 90% of the US residential battery market. In Germany, the market is more fragmented with BYD Battery Box, Sungrow, LG Chem RESU, and E3/DC as leading brands.
Does adding a battery to solar pay back in every market?
No. Battery payback varies dramatically by market. In Germany, battery payback is 6-10 years due to high electricity prices and low feed-in tariffs. In California under NEM 3.0, battery payback is 7-12 years depending on TOU rates and backup value. In Australia, payback ranges from 8-14 years, though state rebates shorten this in Victoria and South Australia. In the UK, payback is 10-15 years at current electricity prices, which is why some homeowners add batteries primarily for backup rather than economics. The key variable is the gap between retail electricity price and export compensation rate.
What is AC-coupled vs DC-coupled battery storage?
AC-coupled batteries connect to the home’s AC electrical panel via a separate battery inverter. They work with any solar inverter and are ideal for retrofitting existing solar systems. DC-coupled batteries connect directly to the DC bus between solar panels and the hybrid inverter, avoiding one conversion step and achieving 3-5% higher round-trip efficiency. DC coupling is cheaper for new installations but requires a compatible hybrid inverter. Tesla Powerwall 3 uses an integrated hybrid inverter (DC-coupled), while Enphase IQ Battery is AC-coupled via microinverters.
Will solar storage attachment rates keep rising through 2030?
Yes, with regional variation. The US national rate is projected to reach 60-70% by 2030 as NEM 3.0-style net billing spreads to more states. Germany’s rate will likely stay above 80% but growth will shift to retrofitting 5.9 million existing PV systems as early feed-in tariffs expire. Australia’s rate could reach 40-50% with continued CHBP subsidy support. The UK true rate is already approaching universality in some regions; official MCS data will gradually catch up. BloombergNEF projects battery pack prices below $60/kWh by 2030, which will make batteries standard equipment in most solar markets regardless of policy.


