Quick Answer
PV Magazine reported the 28.3 GW milestone in February 2026 alongside a surge in home battery uptake. The Clean Energy Council projects rooftop solar in the NEM will reach 36 GW by 2030, and AEMO's modelling points to 42.5 GW by 2036. System output — measured in megawatt-hours of electricity the system is expected to generate 2.
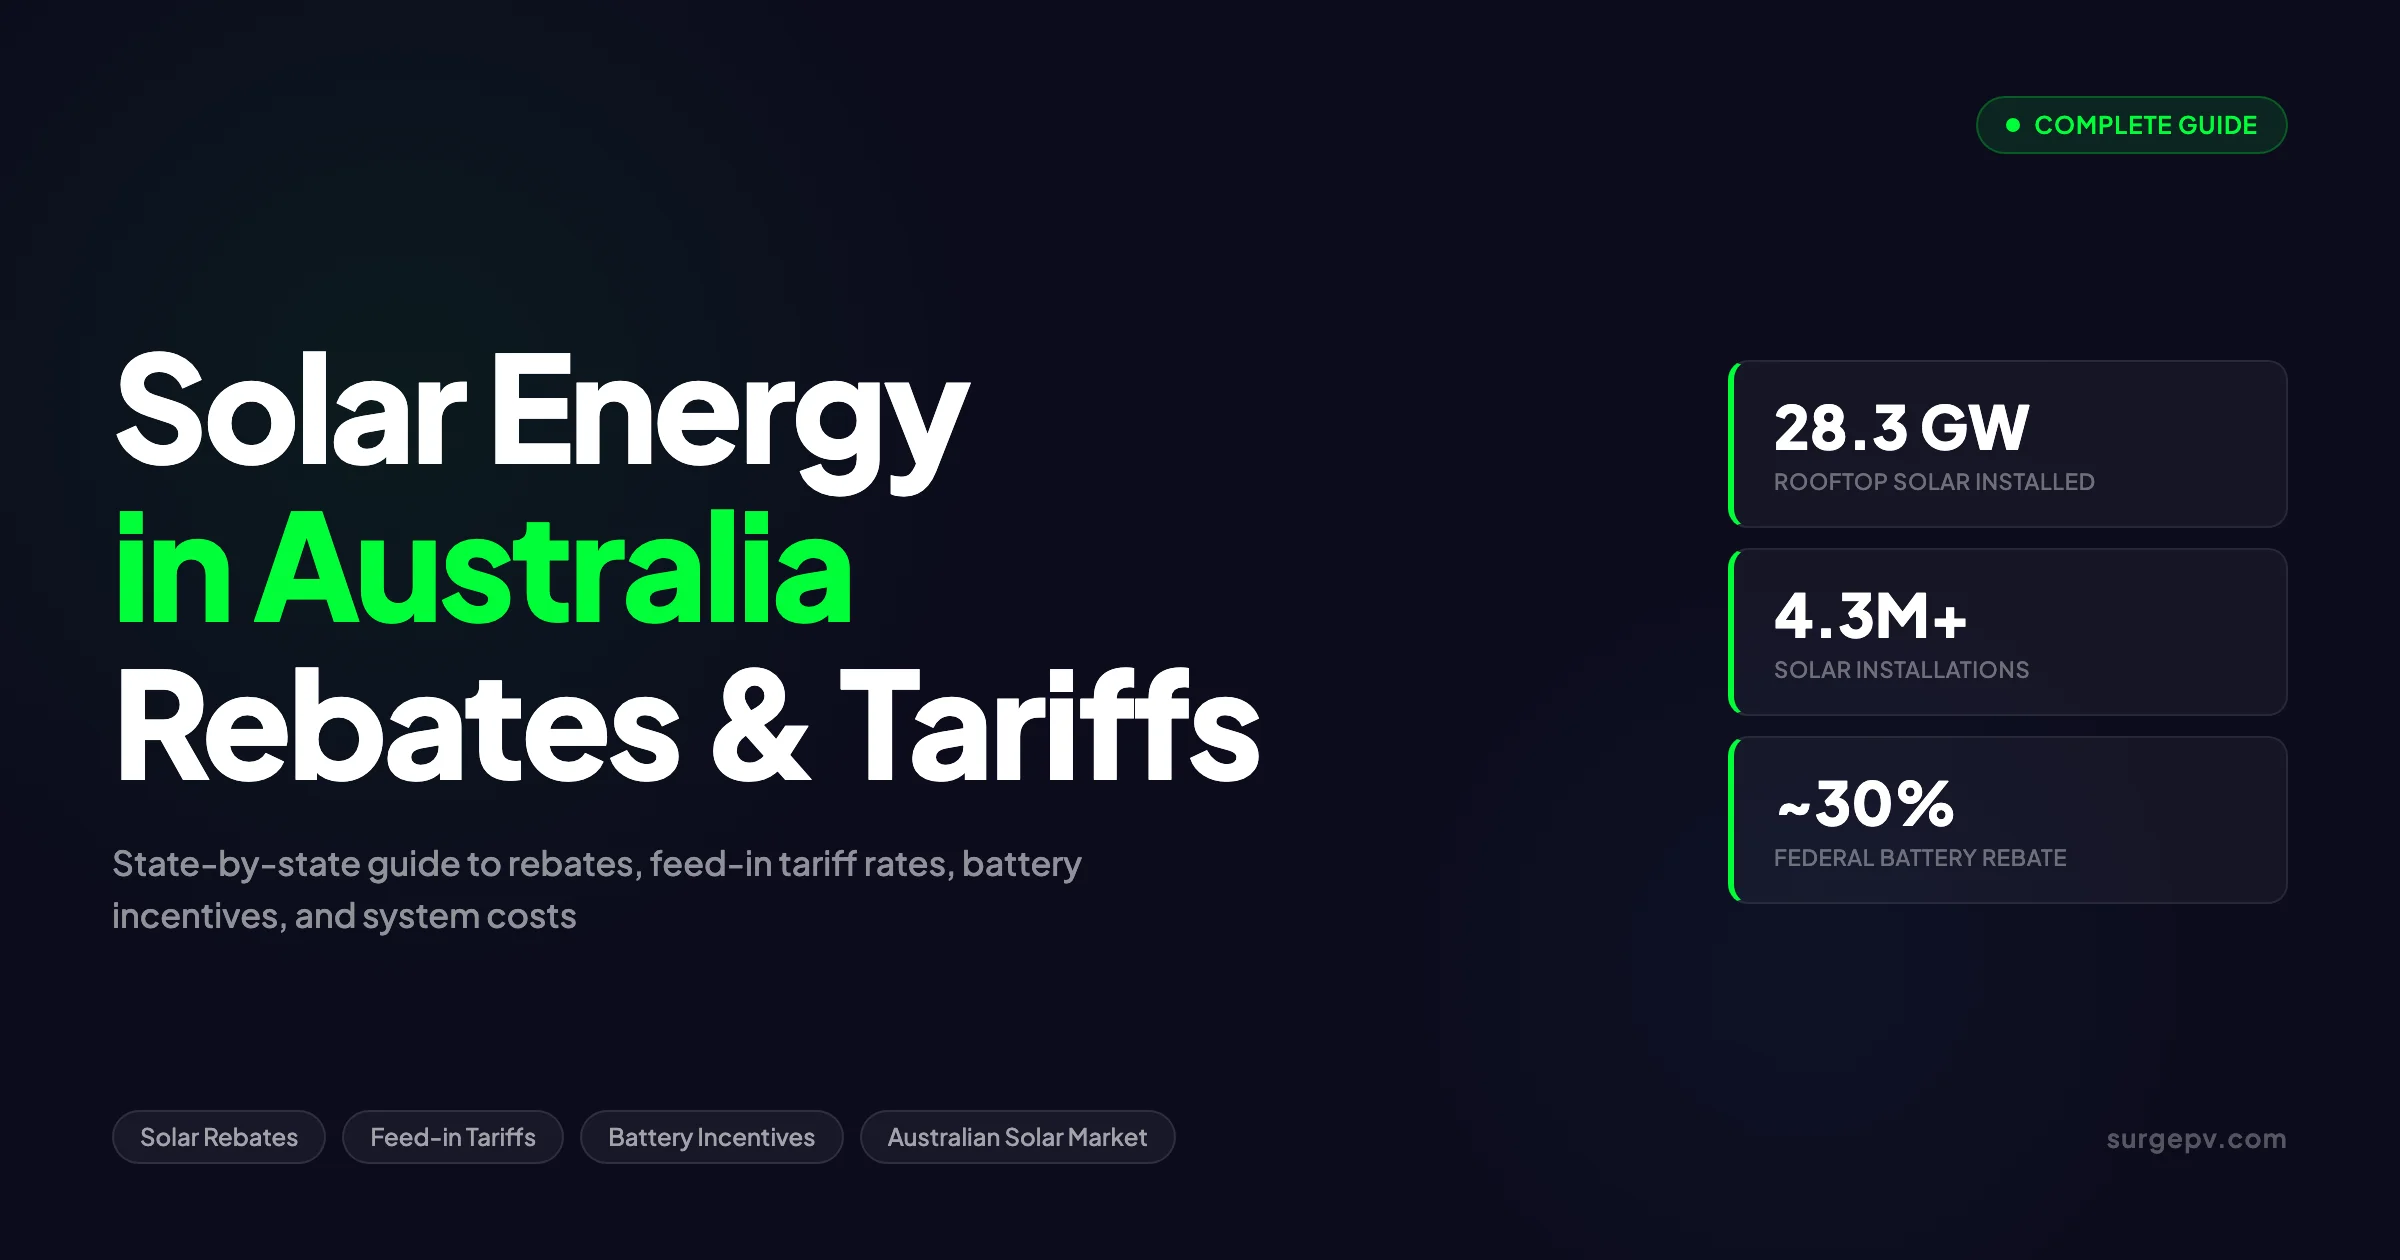
Australia installs more rooftop solar per capita than any other country on Earth. With 28.3 GW of installed rooftop capacity across 4.3 million homes and businesses — and renewables already supplying nearly half of National Electricity Market generation — the country is not chasing a solar future. It is already living it. This guide covers every federal and state rebate available in 2026, current feed-in tariff rates for all states and territories, how the battery rebate overhaul in May 2026 changes the numbers, what a system realistically costs after incentives, and where the market is headed through 2030. For Australia-specific compliance details, see Australia comparisons/lgc-vs-stc.
PV Magazine reported the 28.3 GW milestone in February 2026 alongside a surge in home battery uptake. The Clean Energy Council projects rooftop solar in the NEM will reach 36 GW by 2030, and AEMO’s modelling points to 42.5 GW by 2036. System output — measured in megawatt-hours of electricity the system is expected to generate 2.
TL;DR — Australian Solar in 2026
A 6.6kW system costs $5,000–$6,000 after the STC rebate. Feed-in tariff rates range from 1–25c/kWh depending on state and retailer, though self-consumption is worth 3–6x more. The Cheaper Home Batteries Program now covers ~30% of battery costs. Australia targets 82% renewable electricity by 2030 and is on track.
Australia’s Solar Market: Current Scale and 2026 Outlook
Australia’s solar buildout is not modest. As of early 2026, rooftop solar alone has reached 28.3 GW across approximately 4.3 million installations — a figure that makes Australia the global leader in per capita rooftop solar. That number is climbing. For Global-specific compliance details, see Global net-metering-by-country.
PV Magazine reported the 28.3 GW milestone in February 2026 alongside a surge in home battery uptake. The Clean Energy Council projects rooftop solar in the NEM will reach 36 GW by 2030, and AEMO’s modelling points to 42.5 GW by 2036.
| Metric | Figure |
|---|---|
| Rooftop solar installed capacity (early 2026) | 28.3 GW |
| Total solar installations (homes + businesses) | ~4.3 million |
| New installs forecast for 2026 | 3.0–3.37 GW |
| Total solar market capacity (rooftop + utility), 2025 | ~47.5 GW |
| Projected total solar capacity by 2030 | 91.74 GW |
| Rooftop solar in NEM by 2030 | ~36 GW |
| Renewables share of NEM generation (2025 full year) | 42.9% |
| Renewables share of NEM generation (Q4 2025) | 49.9% |
| Federal renewable energy target by 2030 | 82% |
Queensland has the most individual rooftop installations (1.16 million), while New South Wales leads on total installed capacity at nearly 8 GW. Both states benefit from high solar irradiance, CEC-accredited installer networks, and competitive retail markets that push feed-in tariff rates higher than the national average. For the latest details on UK, see Battery Solar System Design UK.
The 2026 installation rebound — from 2.7 GW in 2025 to a projected 3.0–3.37 GW — is driven by the expanded Cheaper Home Batteries Program, record-low panel prices, and growing demand for battery-paired systems in states where grid export limits are tightening.
Pro Tip
In every state, self-consuming your own solar saves roughly 30–40c/kWh (your avoided import rate). Exporting earns 3–12c/kWh. Maximise self-consumption first — shift loads like dishwashers, washing machines, and EV charging to solar hours before considering a battery.
Federal Incentives: The Small-scale Renewable Energy Scheme (STCs)
The most significant solar incentive in Australia operates federally: the Small-scale Renewable Energy Scheme (SRES), which issues tradable Small-scale Technology Certificates (STCs) for eligible solar and battery installations.
How STCs Work
STCs are not a cheque from the government. Your installer generates them on your behalf and sells them — typically to electricity retailers obligated to surrender certificates under the scheme. The revenue from that sale is passed to you as an upfront point-of-sale discount on the installation invoice.
The number of STCs your system earns depends on three variables:
- System output — measured in megawatt-hours of electricity the system is expected to generate
- Solar zone — Australia is divided into four zones based on solar irradiance (Zone 1 = highest, Northern Territory; Zone 4 = lowest, Tasmania)
- Years remaining — the scheme multiplier decreases by one each year from now until the scheme ends on 31 December 2030
For a 6.6kW system in Zone 3 (which covers Sydney, Melbourne, and Adelaide), the STC discount in 2026 runs approximately $2,000–$2,500 depending on the prevailing STC market price.
| Solar Zone | States/Regions | Relative STC Value |
|---|---|---|
| Zone 1 | Northern Territory, far north QLD | Highest |
| Zone 2 | Most of QLD, northern WA, north SA | High |
| Zone 3 | NSW, VIC, southern WA, SA, ACT, southern QLD | Medium |
| Zone 4 | Tasmania | Lowest |
Phase-out Timeline
The SRES multiplier drops by one every 1 January. A 6.6kW system installed in 2026 earns STCs multiplied by 4 (for 4 remaining full years). That same system installed in 2028 earns STCs multiplied by 2. Waiting reduces your rebate — and the scheme ends completely on 31 December 2030.
Key Takeaway
Every January 1st reduces the STC multiplier by one. If you are comparing quotes across calendar years, factor in the rebate reduction. A $300–$500 drop in the STC discount is common between December and January installs.
Eligible Technologies
The SRES covers:
- Rooftop and ground-mounted solar PV
- Solar water heaters and heat pumps
- Small wind turbines
- Hydropower systems below 100 kW Read Ground Mounted Solar Design Guide for a complete walkthrough.
For more details, see our guide on solar farm design guide.
For more details, see our guide on wind turbine vs solar.
Battery systems accessed the scheme separately through the Cheaper Home Batteries Program (see below).
The Cheaper Home Batteries Program: What Changed in May 2026
Australia’s federal battery rebate underwent a significant restructure on 1 May 2026. Understanding the new model matters if you are comparing quotes from before and after that date.
Original Structure (Pre-May 2026)
Before 1 May 2026, eligible battery installations (5–100 kWh) received STCs at a flat rate of approximately $336 per usable kWh, delivering roughly 30% off installation costs. Also see: Us Residential Solar Market Trends 2026.
For more details, see our guide on residential battery sizing guide.
New Tiered Model (From 1 May 2026)
From 1 May 2026, the program uses a tiered STC structure based on battery capacity. The discount rate per kWh falls as system size increases:
| Tier | Battery Capacity | STC Rate | Approx. Discount per kWh |
|---|---|---|---|
| Tier 1 | 0–14 kWh | 100% of STC rate | ~$252/usable kWh |
| Tier 2 | 14–28 kWh | 60% of STC rate | ~$151/usable kWh |
| Tier 3 | 28–50 kWh | 15% of STC rate | ~$38/usable kWh |
A standard 10 kWh home battery falls entirely in Tier 1 and qualifies for approximately $2,520 in rebate value. A 20 kWh system spans Tier 1 and Tier 2, receiving the full rate on the first 14 kWh and 60% on the remaining 6 kWh.
For more details, see our guide on Tesla Powerwall vs BYD vs Sonnen.
The program was expanded from the original $2.3 billion to an estimated $7.2 billion over four years in December 2025, according to the Department of Climate Change, Energy, the Environment and Water.
Eligibility Requirements
- System must be installed by a Solar Accreditation Australia (SAA) accredited installer
- On-grid battery systems must be VPP-capable at installation
- No income or means test — open to all Australian homeowners with eligible properties
- System size: 5–100 kWh usable capacity
- The rebate factor decreases annually: from 8.4 STCs per kWh in 2026 down to 2.1 STCs per kWh in 2030
For more details, see our guide on virtual power plant design.
Pro Tip
The VPP-capable requirement is often misread as mandatory VPP enrolment. It is not. The battery must have VPP capability, but participation in a virtual power plant remains optional. Check this with your installer before purchase — some cheaper batteries do not qualify.
Solar Feed-in Tariff Rates by State (2026)
Feed-in tariffs in Australia are set either by a regulated minimum (in some states) or by competitive retail markets. The rates below reflect the current situation for each state and territory.
New South Wales
NSW has no mandatory minimum feed-in tariff — rates are set by retailers competing for customers. The Independent Pricing and Regulatory Tribunal (IPART) recommends a “reasonable” benchmark range of 4.8–7.3c/kWh for flat FiTs in 2026.
In practice, the market is more competitive than that benchmark suggests. As of early 2026:
- Highest maximum rate available: 10c/kWh (Engie, Alinta Energy, GloBird Energy)
- Highest minimum guaranteed rate: 5.5c/kWh (Engie, CovaU)
- Typical retail offer: 4–8c/kWh flat
NSW homeowners combining a battery with VPP enrolment can access an additional incentive of up to $1,500 through the Productivity and Employment Growth Device (PDRS) VPP scheme, on top of the federal battery rebate.
Victoria
Victoria’s feed-in tariff situation changed on 1 July 2025. The Essential Services Commission previously set a regulated minimum — that minimum was removed, and retailers now set their own rates.
Current market rates in Victoria:
- Typical flat FiT: 4–10c/kWh
- Premium time-of-export plans: up to 12–15c/kWh for the first 10 kWh exported per day
Victoria also retains a solar panel rebate of up to $1,400 for eligible households installing a new solar system. This is the Solar Homes Program rebate and is means-tested — households with a combined income below $210,000 qualify.
Queensland
Queensland has two distinct feed-in tariff structures depending on your distribution network:
South-East Queensland (Energex network — AusGrid, Ergon retailers): The regulated minimum FiT is 8.782c/kWh (as of 1 July 2025 through 30 June 2026). Some retailers offer up to 22c/kWh on competitive plans.
Regional Queensland (Ergon Energy network): Regional customers on Ergon’s network have a regulated minimum FiT of 12.377c/kWh — the highest guaranteed rate in any Australian state. This reflects the higher cost of grid supply in regional areas.
South Australia
South Australia has no regulated minimum FiT and has seen rates decline sharply as rooftop solar penetration has saturated daytime grid capacity. Retailers currently offer:
- Flat rates: 1–8c/kWh
- Time-of-export rates: up to 22c/kWh during peak demand periods
SA is also home to one of the largest virtual power plant networks in the country (AGL Virtual Power Plant, Tesla Energy Plan), which can boost effective export earnings significantly beyond the base FiT.
Western Australia
Western Australia operates outside the National Electricity Market on the South West Interconnected System (SWIS). Synergy is the primary retailer, and the government-set Distributed Energy Buyback Scheme (DEBS) applies:
- Peak rate (3pm–9pm): 10c/kWh
- Off-peak rate (all other times): 2c/kWh
The time-based structure rewards systems with batteries that can shift generation to the evening peak window. A standalone solar system without storage exports most of its output at 2c/kWh during the day, making self-consumption and battery storage especially valuable in WA. For more on this topic, see Adding Battery Storage Services.
Tasmania
Tasmania is supplied almost entirely by Aurora Energy, which offers a fixed FiT of 9c/kWh. There is minimal retailer competition in the state, and solar uptake is lower due to reduced irradiance compared to the mainland.
Australian Capital Territory
The ACT has strong retail competition and some of the highest advertised FiTs in the country, with some retailers posting rates up to 25c/kWh. However, these premium rates typically apply under specific time-of-export or demand-based plans and may require battery storage.
Northern Territory
The NT operates under the Power and Water Corporation and offers a FiT of approximately 8c/kWh under the Renewable Energy Feed-in Scheme. The NT also runs the Home and Business Battery Scheme, which offers interest-free loans for battery systems.
National FiT Summary Table
| State/Territory | Regulated Minimum | Typical Range | Peak Offer |
|---|---|---|---|
| NSW | None | 4–8c/kWh | Up to 10c/kWh |
| VIC | None (from Jul 2025) | 4–10c/kWh | Up to 15c/kWh |
| QLD (SE) | 8.782c/kWh | 8–15c/kWh | Up to 22c/kWh |
| QLD (Regional Ergon) | 12.377c/kWh | 12–15c/kWh | — |
| SA | None | 1–8c/kWh | Up to 22c/kWh |
| WA (DEBS) | 2c/kWh off-peak | 2–10c/kWh | 10c/kWh (3–9pm) |
| TAS | 9c/kWh (Aurora) | ~9c/kWh | 9c/kWh |
| ACT | None | 5–15c/kWh | Up to 25c/kWh |
| NT | ~8c/kWh | ~8c/kWh | — |
Key Takeaway
The self-consumption arbitrage is the real opportunity. Grid electricity in 2026 costs 30–40c/kWh in most states. Every kWh you use from your own panels saves that full amount — compared to 3–12c earned from exporting. Design your system and load patterns around self-consumption first.
Design Solar Systems That Maximise Self-Consumption
SurgePV’s generation and financial tool models self-consumption vs export scenarios for any site in Australia, with real irradiance data and tariff structures built in.
Book a DemoNo commitment required · 20 minutes · Live project walkthrough
For a direct comparison, see Arka 360 vs SurgePV.
State-by-State Solar Rebates and Incentive Programs
Beyond the federal STC rebate and the Cheaper Home Batteries Program, several states maintain their own solar and battery incentive schemes in 2026.
Victoria: Solar Homes Program
Victoria’s Solar Homes Program provides a point-of-sale rebate of up to $1,400 for households installing a new solar PV system. Key conditions:
- Household annual income must be below $210,000 combined
- Property must be owner-occupied (renters and investment properties do not qualify under most pathways)
- Must use an approved installer from the program’s list
- System must be a new installation (retrofits to existing solar may not qualify for panel rebates)
The battery component of the Solar Homes Program has wound down, with Victorian battery incentives now channelled through the federal Cheaper Home Batteries Program.
New South Wales: VPP Incentive (PDRS)
NSW’s Productivity and Employment Growth Device (PDRS) includes a battery storage incentive for households connecting eligible batteries to virtual power plant networks. Value: up to $1,500 stacked on top of the federal battery rebate.
Combined, an NSW household installing a 10 kWh battery in 2026 could access:
- Federal battery rebate: ~$2,520 (Tier 1, $252 × 10 kWh)
- NSW VPP incentive: up to $1,500
- Total rebate stack: up to ~$4,020
Queensland: No State Battery Rebate in 2026
Queensland does not have an active state-level battery rebate program. Queenslanders rely on the federal Cheaper Home Batteries Program. However, several Queensland retailers offer VPP enrolment bonuses and time-of-use tariff structures that can improve the financial return from battery storage.
South Australia: Home Battery Scheme (Closed to New Applicants)
South Australia’s original Home Battery Scheme, which offered subsidies of up to $6,000, closed to new applicants in 2021 after exhausting its budget. SA residents now access only the federal battery program. The state does have an active VPP ecosystem through AGL, Tesla, and several retailers that can improve battery economics through aggregation.
Western Australia: Interest-Free Battery Loans
The WA government’s Household Battery Loan Program provided interest-free loans of up to $10,000 for battery installations. Check the current status directly with energy.gov.au as state-level programs change more frequently than federal ones.
Northern Territory: Home and Business Battery Scheme
The NT’s Home and Business Battery Scheme offers interest-free loans for battery systems. Eligibility requirements and loan amounts should be confirmed directly with the NT Government, as the scheme operates separately from the federal program.
| State | Solar Panel Rebate | Battery Incentive | VPP Bonus |
|---|---|---|---|
| NSW | STC (federal) | Federal (up to ~$2,520 for 10 kWh) | Up to $1,500 |
| VIC | Up to $1,400 (income-tested) | Federal | Varies by retailer |
| QLD | STC (federal) | Federal | Varies by retailer |
| SA | STC (federal) | Federal | Varies by retailer |
| WA | STC (federal) | Federal | — |
| TAS | STC (federal) | Federal | — |
| ACT | STC (federal) | Federal | Varies |
| NT | STC (federal) | Interest-free loan | — |
Solar System Costs in Australia (2026)
Panel prices have fallen dramatically over the past decade and continue to drop. In 2026, Australian homeowners are entering at one of the most favourable price points in the market’s history.
Residential System Pricing
| System Size | Pre-Rebate Cost | After STC Rebate | Typical Payback |
|---|---|---|---|
| 6.6 kW | $7,000–$8,500 | $5,000–$6,000 | 4–6 years |
| 10 kW | $10,500–$13,000 | $8,000–$10,500 | 4–7 years |
| 13 kW | $13,000–$16,000 | $10,500–$13,000 | 5–7 years |
The installed price per watt in 2026 sits at approximately $0.88–$0.95/W including GST and the STC rebate, according to the Solar Choice Price Index (May 2026). As a rule of thumb, budget $1,000 per kW installed for a quality system.
Premium systems — using high-efficiency panels above 430W per panel, Tier 1 manufacturers, and branded microinverters or hybrid inverters — cost 20–30% more but typically carry stronger warranties and better long-term output guarantees.
For more details, see our guide on microinverters vs string inverters vs optimizers.
For more details, see our guide on hybrid inverter guide.
What Drives Price Variation
Location: Labor and logistics costs differ. Remote areas or those with limited installer competition see higher prices. Darwin and regional WA tend to cost more than Sydney or Melbourne.
Roof complexity: A simple single-pitch north-facing roof is the cheapest to install. Multiple pitches, tiles (versus metal), steep angles, or structural reinforcement requirements add cost.
Inverter type: String inverters are cheapest. Microinverters or power optimisers add $500–$1,500 per system but improve output on shaded or complex roofs.
Panel brand and efficiency: Budget panels from lesser-known brands cost less upfront but may have weaker degradation guarantees. The premium for a Tier 1 panel with a 30-year performance warranty is typically $300–$600 per system.
Battery addition: A 10 kWh battery (e.g., Tesla Powerwall 3, BYD Battery-Box Premium HV, SENEC.Home 4) adds $8,000–$12,000 before the federal rebate, and $5,500–$9,500 after a Tier 1 rebate of ~$2,520.
Key Takeaway
The STC rebate automatically reduces your installer’s quoted price at point of sale — you should never see a full pre-rebate invoice. If a quote does not reflect the STC discount, ask the installer to restate it correctly or seek another quote.
Payback Periods in Practice
Payback depends heavily on self-consumption rate, grid tariff, and export rate. Two scenarios for a 6.6kW system in Sydney ($5,500 net cost after rebate):
Low self-consumption (20%):
- Annual bill savings: ~$800–$1,000
- Payback: 5.5–7 years
High self-consumption (60%):
- Annual bill savings: ~$1,400–$1,800
- Payback: 3–4 years
Shifting load to solar hours — running the dishwasher, washing machine, pool pump, and EV charger during daylight — is the single highest-return change you can make after installing a system.
Commercial and Large-Scale Solar in Australia
The residential market dominates by installation count, but large-scale solar is where Australia’s capacity additions happen fastest.
Commercial Solar (C&I)
Commercial and industrial solar installations above 100 kW access the Large-scale Renewable Energy Scheme (LRET) rather than STCs. They generate Large-scale Generation Certificates (LGCs) for each megawatt-hour of electricity produced.
For more details, see our guide on commercial solar system design.
In 2026, LGC prices have stabilised in the $30–$45/MWh range, providing meaningful revenue for commercial systems over their operating life.
Common commercial system sizes in 2026:
- 100–300 kW: Warehouses, factories, large retail — fully self-consuming, strong ROI
- 300 kW–5 MW: Industrial facilities, large commercial — may require grid export agreements
- 5 MW+: Solar farms, utility-scale — project finance, PPA structures
Large-Scale Solar Farms
Australia added 7 GW of total renewables capacity in 2025, with solar farms contributing substantially to that figure. The federal government approved 54 large-scale projects across all states and territories in a single year, reflecting the speed of the current buildout.
The Clean Energy Finance Corporation (CEFC) and the Australian Renewable Energy Agency (ARENA) continue to fund utility-scale projects through debt and grant structures. Large-scale solar in Queensland, NSW, and South Australia is generating electricity at costs that compete directly with gas peakers.
Pro Tip
Commercial sites above 100 kW should model LGC revenue alongside avoided import costs before signing a PPA or purchasing outright. At $35/LGC, a 500 kW system producing 750 MWh/year earns $26,250/year in LGC revenue alone — a material component of the financial case.
Virtual Power Plants: Turning Batteries Into Revenue
Virtual power plants (VPPs) aggregate home batteries across hundreds or thousands of households, allowing them to collectively provide grid services — frequency response, peak demand shifting, and emergency capacity — in exchange for payment to participants.
Australia has the most developed residential VPP ecosystem outside Europe. Key programs active in 2026: Also see: European Solar Incentives.
| VPP Program | State | Incentive Structure |
|---|---|---|
| AGL Virtual Power Plant | SA, VIC, QLD | Enhanced FiT + VPP revenue share |
| Tesla Energy Plan (Origin Energy) | SA, QLD | Flat FiT 10c/kWh (exported) + VPP |
| Simply Energy / EnergyAustralia VPP | Multiple | Retailer-set; typically $2–$5/month |
| SA Power Networks VPP | SA | Grid services revenue |
| NSW PDRS VPP | NSW | Up to $1,500 upfront incentive |
VPP participation does not prevent you from using your own battery for self-consumption. The grid operator only dispatches your battery when grid conditions require it, typically for short durations.
The requirement that new battery installations under the Cheaper Home Batteries Program must be VPP-capable (from May 2026) will accelerate VPP uptake — the hardware is already compatible; participation is a software enablement step.
Solar Design Considerations for Australian Conditions
Australia’s climate creates specific design considerations that differ from European or North American norms.
Orientation and Tilt
The optimal panel orientation in Australia is north-facing (not south, as in the northern hemisphere). The optimal tilt angle generally equals the latitude of the installation site:
- Darwin (~12° S latitude): 10–15° tilt
- Brisbane (~27° S latitude): 22–28° tilt
- Sydney (~34° S latitude): 28–34° tilt
- Melbourne (~38° S latitude): 32–38° tilt
- Hobart (~43° S latitude): 37–43° tilt
East-west split configurations are increasingly popular where self-consumption is the priority — they flatten the generation curve across the day rather than peaking at solar noon, which reduces export and increases the portion of solar consumed directly.
Cyclone Zones
Installers working in northern Queensland, the NT, and northern WA must design to cyclone wind loading standards. Mounting systems must comply with AS/NZS 1170.2 wind load requirements for the specific site’s cyclone classification (Region C or D). This adds cost but is non-negotiable for structural safety and warranty validity.
Export Limits
Network operators in high-penetration solar areas are applying export limits to new connections. In some parts of SA and QLD, new residential systems are approved for zero export or limited export (1.5–5 kW). Using solar design software that accounts for export limits in the generation and financial model is important for setting realistic customer expectations.
The Australian Energy Market Operator is developing the Distributed Energy Integration Program (DEIP) to better coordinate distributed solar with grid needs, which may eventually allow dynamic export limits that open up more export capacity during low-demand periods.
Shading Analysis
Australia’s high solar irradiance means shading has an outsized impact on annual yield. A module shaded for 2 hours per day in Sydney loses a higher absolute energy output than the same shading scenario in cloudy northern Europe, because the baseline irradiance is so much higher.
Solar shadow analysis software using LiDAR data or 3D modelling is the accurate way to quantify shading losses from nearby trees, chimneys, or adjacent buildings before quoting a customer. Claiming X% self-sufficiency without shading analysis is guesswork.
Net Metering vs Gross Metering in Australia
Australia uses net metering as the standard billing arrangement for rooftop solar. Your meter records the net difference between generation and consumption in each interval:
- When you generate more than you consume, the surplus is exported and credited at the feed-in tariff
- When you consume more than you generate, you import from the grid and pay the retail rate
Gross metering — where all generation is exported and all consumption is separately purchased — is no longer the standard arrangement but exists in some legacy connections.
A small number of network areas use time-of-use (TOU) net metering, where both the FiT and the import rate vary by time of day. TOU tariffs are expanding across the NEM, and pairing them with a battery optimised for time-of-use arbitrage is becoming the highest-return battery strategy in most states.
Export Limits and Grid Management
Australia’s high solar penetration has created what the industry calls the “duck curve” problem — daytime solar generation can exceed consumption in some network areas, causing voltage issues and negative wholesale prices. Network operators have responded with:
Static export limits: New connections approved with a cap (often 5 kW for residential, sometimes zero in oversupplied areas).
Dynamic export limits (emerging): Under AEMO’s Distributed Energy Integration Program, some networks are piloting real-time export adjustment based on grid conditions. This could allow unlimited export at low-solar periods and throttle export only when the grid is constrained.
Solar curtailment: Some systems connected to high-penetration networks are automatically curtailed during periods of very high solar output. This reduces annual generation but is increasingly becoming a condition of new connections.
Understanding your local network’s export limits before system design is important — not just for financial modelling, but because oversized systems that cannot export the surplus generation have longer payback periods than the nameplate capacity suggests.
Key Takeaway
Always check your local DNSP’s (Distribution Network Service Provider) export limit policy before finalising system size. In high-penetration areas, a 10 kW system with a 5 kW export cap performs no better than a 6.6 kW system in terms of export revenue — but costs more. Size to self-consumption first.
Accreditation and Quality Standards
Solar installers in Australia must hold CEC (Clean Energy Council) accreditation to install systems that qualify for the STC rebate and the Cheaper Home Batteries Program. This is a non-negotiable minimum — work by non-accredited installers does not generate STCs and may void equipment warranties.
What CEC accreditation means:
- Installer holds a relevant electrical licence and has completed CEC-approved training
- Installation follows AS/NZS 5033 (solar PV systems) and AS 4777 (inverter grid connection)
- System design meets CEC guidelines for component selection and string configuration
When selecting an installer, also look for:
- Membership in the Solar Energy Industries Association (SEIA) or the CEC installer program (formerly known as the Solar Retailer Code of Conduct)
- An independent quote comparison through a broker or the government’s Energy Made Easy comparison tool For France-specific information, see Agricultural Solar Case Study. For the latest details on France, see Floating Solar Farms France.
The solar software your installer uses matters too. Design software that outputs CEC-compliant documentation reduces the administrative burden on installers and speeds up network connection approval.
Streamline Australian Solar Project Design and Proposals
SurgePV handles system design, shading analysis, and financial modelling in one platform — with generation reports formatted for CEC and DNSP submissions.
Book a DemoNo commitment required · 20 minutes · Live project walkthrough
The 2030 Roadmap: Where Australian Solar Is Headed
Australia’s renewable transition is one of the fastest in the world on a per capita basis, and solar is carrying most of that load.
Key Milestones Through 2030
| Year | Target / Projection |
|---|---|
| 2026 | 28.3+ GW rooftop solar; ~3 GW new rooftop installs |
| 2027 | ~31 GW rooftop solar (CEC projection) |
| 2029/30 | 36 GW distributed PV in NEM (AEMO Integrated System Plan) |
| 2030 | 82% renewable electricity generation (federal target); ~91.74 GW total solar capacity |
| 2030 | SRES ends — STC scheme phases out completely |
| 2036 | 42.5 GW rooftop solar projected (AEMO) |
The End of STCs in 2030
The SRES scheme ends on 31 December 2030. From 2031, there will be no federal upfront rebate for residential solar installations. The government has not announced a replacement mechanism. This creates a structural deadline for homeowners who want to capture the rebate.
For more details, see our guide on how to design a residential solar system.
The practical implication: the STC discount will shrink each year until it disappears. 2026 is one of the last years with a meaningful multiplier. By 2028, the multiplier will halve, and by 2029 it will be minimal.
Battery Adoption Acceleration
AEMO projects Australia could install up to 12 GWh of residential battery storage in 2026 alone. The expanded Cheaper Home Batteries Program, falling battery costs, and VPP income potential are converging to make battery-paired solar the dominant installation type within the next 2–3 years.
The average cost of a 10 kWh battery system (before rebate) has dropped approximately 50% in five years and continues to fall at roughly 10–15% per year. By 2028, battery payback periods in high-tariff states may reach 5–6 years without subsidies.
Grid Modernisation and EV Integration
The intersection of solar, batteries, and electric vehicles is reshaping Australian household energy management. Bidirectional EV charging (V2H and V2G) is commercially available in 2026 through several vehicle platforms and is eligible for VPP integration in pilot programs. An EV battery paired with rooftop solar effectively provides 50–100 kWh of storage at a cost already justified by the vehicle purchase.
Installer businesses that can design and quote solar-battery-EV charger systems as an integrated package are positioning for the highest-growth segment in the Australian market.
ROI and Financial Modelling for Australian Solar
Solar financial returns in Australia vary significantly by state, FiT, self-consumption rate, and whether a battery is included. The generation and financial tool approach matters here — rough rules of thumb hide the variation that matters to customers.
6.6 kW System, No Battery — Three State Scenarios
Sydney, NSW (Zone 3):
- System cost (net): $5,500
- Annual generation: ~9,200 kWh
- Self-consumption at 40%: 3,680 kWh × 33c saved = $1,214
- Export at 60%: 5,520 kWh × 6c = $331
- Total annual benefit: ~$1,545
- Simple payback: ~3.6 years
Melbourne, VIC (Zone 3):
- System cost (net): $5,500
- Annual generation: ~8,500 kWh
- Self-consumption at 40%: 3,400 kWh × 31c saved = $1,054
- Export at 60%: 5,100 kWh × 5c = $255
- Total annual benefit: ~$1,309
- Simple payback: ~4.2 years
Brisbane, QLD (Zone 2, SE Energex):
- System cost (net): $5,200
- Annual generation: ~10,200 kWh
- Self-consumption at 40%: 4,080 kWh × 32c saved = $1,306
- Export at 60%: 6,120 kWh × 8.8c = $539
- Total annual benefit: ~$1,845
- Simple payback: ~2.8 years
Queensland’s combination of high irradiance, lower system cost (Zone 2 STCs are higher), and the regulated 8.782c/kWh FiT produces the best pure payback among the major states.
Key Takeaway
Queensland delivers the fastest payback for most residential systems due to Zone 2 STC values, high irradiance, and a regulated minimum FiT. Brisbane installations targeting 40% self-consumption can pay back in under 3 years in 2026.
Adding a Battery: The Numbers
A 10 kWh battery (post-rebate cost: ~$6,500–$9,000) shifts export to self-consumption. If a household exports 5,520 kWh/year at 6c (earning $331) and a battery captures 80% of that export (4,416 kWh) for self-consumption at 33c (saving $1,457), the net gain from the battery is approximately $1,126/year.
At $7,000 battery net cost, payback is approximately 6.2 years — before accounting for VPP income or time-of-use arbitrage. In states with stronger FiTs or lower grid tariffs, the battery case weakens. In states with poor FiTs (WA daytime at 2c) or high grid tariffs, it strengthens significantly.
Use a solar proposal software that can model these scenarios transparently — customers who see the numbers make faster decisions and raise fewer post-sale objections.
Conclusion
- Act before 2028 on solar installations if you want a meaningful STC rebate — the annual multiplier reduction makes delay costly, and the scheme ends in 2030.
- Stack battery incentives: the federal Cheaper Home Batteries Program plus state VPP bonuses can reduce a 10 kWh battery’s net cost to $3,000–$5,000 in NSW, making the financial case straightforward.
- Design for self-consumption: the gap between what you save by using your own solar (30–40c/kWh) and what you earn by exporting (3–12c/kWh) is the largest lever in any Australian solar financial model — shift loads to daylight hours before considering storage.
Frequently Asked Questions
What solar rebates are available in Australia in 2026?
Two main federal programs apply: the Small-scale Renewable Energy Scheme (STCs), which delivers an upfront point-of-sale discount of roughly $2,000–$2,500 on a typical 6.6kW system, and the Cheaper Home Batteries Program, which covers about 30% of battery installation costs. State-level incentives vary — Victoria still offers a solar panel rebate of up to $1,400, and NSW provides a VPP connection incentive of up to $1,500.
What is the solar feed-in tariff rate in Australia in 2026?
Feed-in tariff rates range from 1–25c/kWh depending on your state and retailer. Queensland (south-east) has a regulated minimum of 8.782c/kWh. NSW ranges from 4.8–10c/kWh. Victoria has no regulated minimum since July 2025, with most retailers offering 4–12c/kWh. Western Australia’s DEBS pays 10c/kWh at peak (3–9pm) and 2c/kWh off-peak.
How much do solar panels cost in Australia in 2026?
A 6.6kW system costs $5,000–$6,000 after the STC rebate in most states. Installed cost runs approximately $880–$950 per kW. Premium systems with high-efficiency panels and branded inverters cost 20–30% more. System size, location, roof complexity, and installer margins all affect the final price.
How do Small-scale Technology Certificates (STCs) work?
STCs are tradable certificates generated by eligible solar and battery installations. Installers typically purchase them upfront, reducing your invoice immediately. The number of certificates depends on your system size, location (solar zone), and years remaining until the scheme ends in 2030. For a 6.6kW system in Zone 3 (Sydney, Melbourne), this currently equals a $2,000–$2,500 discount.
What is the Cheaper Home Batteries Program in Australia?
The federal Cheaper Home Batteries Program provides an upfront discount of approximately 30% on eligible battery systems (5–100 kWh). From 1 May 2026, it uses a tiered STC model: Tier 1 (0–14 kWh) receives 100% of the STC rate (~$252/usable kWh), Tier 2 (14–28 kWh) receives 60%, and Tier 3 (28–50 kWh) receives 15%. The program was expanded to an estimated $7.2 billion over four years in December 2025.
Which Australian state has the best solar feed-in tariff?
Queensland offers strong rates — the south-east minimum is 8.782c/kWh, and the regional Ergon network guarantees 12.377c/kWh. Some ACT retailers post up to 25c/kWh. However, the best strategy is self-consumption first: using your own solar saves ~30c/kWh (your usage rate), which is 3–6 times more valuable than exporting at current rates.
Is solar worth it in Australia in 2026?
Yes. A well-sized system in a sunny state typically pays back in 4–7 years with a 25-year panel warranty. The STC rebate cuts upfront costs by $2,000–$2,500, and self-consumption of solar avoids purchasing grid electricity at 30–40c/kWh. Adding a battery extends payback but provides energy independence and VPP income in states where virtual power plant programs exist.
For more details, see our guide on microgrid design with solar and storage.
What is Australia’s renewable energy target for 2030?
Australia’s federal government targets 82% renewable electricity generation by 2030. In Q4 2025, renewables already accounted for 49.9% of National Electricity Market generation. Rooftop solar is projected to reach 36 GW in the NEM by 2030, and total solar market capacity (rooftop + utility) is forecast to grow from 47.5 GW in 2025 to 91.74 GW by 2030.
For more details, see our guide on solar market size by country.