

Back to Blog
solar business 11 min read

Solar Procurement 2026: A Global Installer's Guide to Sourcing & Cost Control

Solar procurement in 2026 means more than buying panels. Learn how installers source modules, inverters, and BOS, negotiate terms, and control project margins.

Akash Hirpara

Written by

Akash Hirpara

Co-Founder · SurgePV

Rainer Neumann

Edited by

Rainer Neumann

Content Head · SurgePV

Published ·Updated

A mid-sized installer in Texas lost $340,000 on a 12-project portfolio in 2024. The modules were Tier 1, the price looked competitive, and the supplier had a polished website. The failure was not fraud. It was procurement. The buyer optimized for module price per watt and ignored total landed cost, payment terms, and warranty enforceability. When tariffs shifted and the supplier could not deliver on time, the installer paid spot-market premiums and ate the margin.

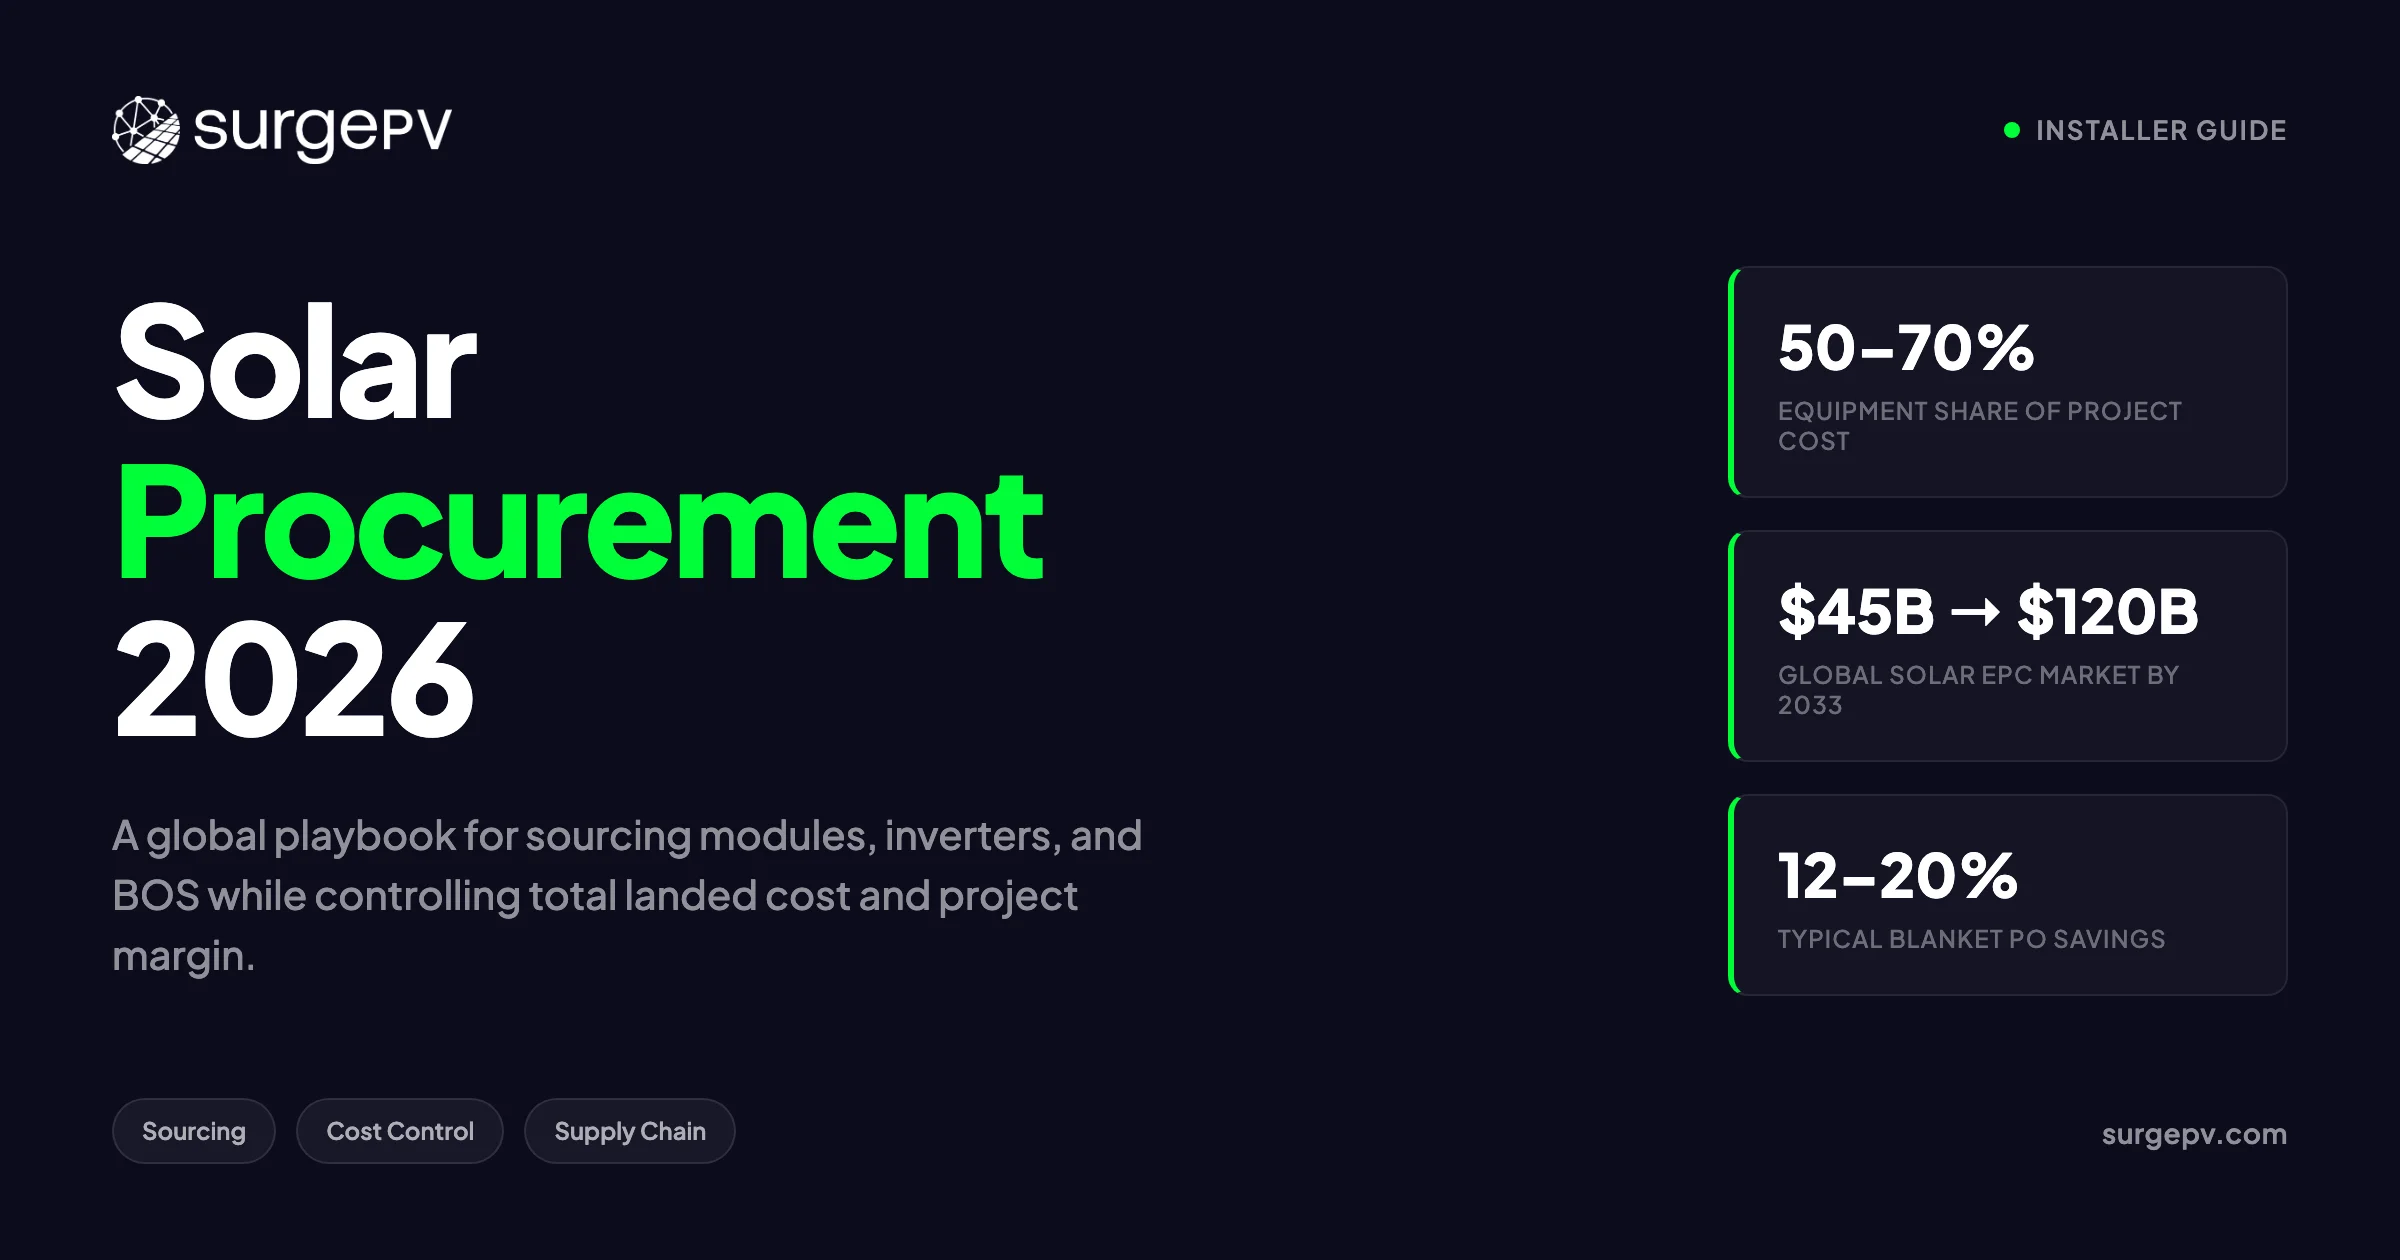
That story is more common than the industry admits. Solar procurement in 2026 is not a shopping exercise. It is a margin discipline. Equipment still accounts for 50–70% of project cost for most installers, according to NREL bottom-up cost benchmarks (2024). A 5% procurement improvement on a $2 million annual material spend is $100,000 straight to EBITDA. This guide is for installers, EPCs, and project developers who want that margin back.

Quick Answer

Solar procurement is the end-to-end process of sourcing, evaluating, negotiating, and buying solar equipment and services. In 2026, the best procurement teams control total landed cost, lock supply early, and use accurate design data to prevent BOM errors.

In this guide, you will learn:

  • What solar procurement covers beyond panels and inverters
  • A 9-step procurement framework you can use on every project
  • How to evaluate suppliers without falling for the Tier 1 trap
  • Spot, contract, and blanket PO pricing models
  • How payment terms change real project cost
  • Risk management for tariffs, lead times, and quality failures
  • Why design software accuracy directly affects procurement waste
  • The procurement metrics every installer should track

Solar Procurement in 2026: Market Snapshot

The solar procurement environment in 2026 is defined by three forces: oversupply in some segments, policy-driven cost shocks in others, and a growing gap between headline module prices and real project economics.

Global solar PV EPC market revenue was estimated at roughly $45 billion in 2024 and is projected to reach $100–120 billion by 2033, growing at 12–13.5% annually, according to industry market reports published in early 2026. Utility-scale projects drive about 65% of that revenue, with Asia-Pacific holding roughly 50% of regional share, North America around 25%, and Europe around 15%.

In the U.S., solar accounted for 60% of new electricity-generating capacity in Q1 2026, and combined with battery storage reached 91%, according to SEIA’s Solar Market Insight report. Yet manufacturing and procurement remain uncertain due to foreign entity of concern rules and ongoing trade cases.

Europe tells a different story. The European Solar Procurement Managers’ Index stood at 69 in February 2026, indicating expansion, but buyers are shifting from on-demand procurement to early locking because delivery certainty now matters as much as price, according to sun.store and Maysun Solar market updates.

India added a record 44.6 GW of solar capacity in FY 2025–26, with roughly 42.5 GW expected in 2026, according to IndexBox. Tender activity in Q1 2026 reached nearly 6 GW, almost double Q4 2025, according to Mercom India. That volume is pushing procurement teams to manage both scale and compliance with the ALMM list and BIS certification. For India-specific pricing, see our post on 5kW solar panel price in India.

Corporate procurement is also reshaping the market. Large buyers are moving from single-project power purchase agreements to multi-gigawatt portfolio partnerships, driven by data center power demand. Meta and Zelestra partnered on nearly 1.2 GWdc across seven U.S. projects in early 2026, including a hybrid solar plus 400 MWh battery storage facility, according to Enkiai’s corporate solar analysis. That scale affects module availability and pricing for everyone downstream.

Key Takeaway

Low module prices do not guarantee low project cost. Procurement success in 2026 depends on managing policy, logistics, payment terms, and specification drift together.

What Solar Procurement Actually Covers

Solar procurement is broader than buying modules. A complete procurement scope for a typical installer includes:

CategoryTypical ItemsShare of Equipment Spend
ModulesMonocrystalline, TOPCon, HJT, bifacial35–50%
InvertersString, microinverters, power optimizers, central10–18%
Mounting & RackingRails, clamps, flashings, ballast, trackers8–15%
Electrical BOSCables, connectors, combiner boxes, disconnects, conduit8–12%
StorageBatteries, inverters, battery management systems10–25% (if included)
ServicesEngineering, logistics, warehousing, installation labor5–15%

Each category has its own supplier base, certification requirements, and lead-time profile. Treating them as one basket is a common mistake. Module procurement might be global and price-sensitive. Racking procurement is often regional because freight costs destroy savings on bulky steel. Inverter procurement in 2026 is increasingly constrained by lead times and firmware compatibility.

For a deeper look at material-level sourcing, see our guide on solar material procurement.

Solar Procurement by Project Size

The procurement strategy for a 5 kW residential system is not the same as for a 5 MW utility project. Size changes everything: supplier base, pricing power, contract structure, and risk profile.

Residential and Small Commercial (Under 100 kW)

Small installers usually buy through distributors. The distributor handles import logistics, warehousing, and credit. The installer trades some margin for convenience and speed. Procurement here is about reliability and availability more than price per watt. A distributor who can deliver next-day and accepts returns is often worth a 3–5% premium.

Commercial and Industrial (100 kW to 5 MW)

At this scale, installers can negotiate directly with manufacturers or master distributors. Contract pricing becomes available. Procurement teams should run competitive RFQs, lock inverter lead times early, and coordinate deliveries with construction schedules. Storage integration is increasingly common at this scale, adding battery procurement to the scope.

Utility-Scale (Above 5 MW)

Utility procurement is dominated by EPC contracts, long-term supply agreements, and project finance requirements. Bankability and Tier 1 status matter because lenders require them. Procurement timelines stretch 12–24 months. Price is critical, but delivery certainty and warranty enforceability are equally important.

Project SizeTypical Buying ModelKey Procurement Priority
Under 100 kWDistributor / dealerAvailability and support
100 kW – 5 MWManufacturer / master distributorTotal landed cost and lead time
Above 5 MWEPC / direct manufacturer contractBankability and delivery certainty

The Solar Procurement Process: A 9-Step Framework

A repeatable procurement process protects margins and reduces firefighting. Here is the framework we use:

Step 1 — Lock the Design and BOM

Procurement starts with design, not purchasing. The bill of materials (BOM) must match the approved electrical and mechanical design. Every unspecified item becomes a change order later. Use solar design software to generate module quantities, inverter models, string layouts, and cable lengths before contacting suppliers.

Step 2 — Define Technical Specifications

Specifications should include rated power, efficiency, temperature coefficient, dimensions, weight, connector type, certification, warranty, and compatibility with existing inventory. Vague specs invite substitutions.

Step 3 — Build the Supplier Shortlist

For each category, maintain at least two qualified suppliers and one backup. Qualification criteria include certification, financial stability, manufacturing capacity, references, and local service presence.

Step 4 — Issue the RFQ

A good request for quotation includes specs, quantities, delivery schedule, incoterms, payment terms, warranty terms, and required documentation. The more specific the RFQ, the more comparable the quotes.

Step 5 — Evaluate Total Landed Cost

Compare quotes on total landed cost, not unit price. Include freight, insurance, customs, tariffs, financing, inspection, and inland logistics. A module that is $0.02/W cheaper can become more expensive after tariffs and freight.

Step 6 — Negotiate Terms, Not Just Price

Payment terms, delivery windows, cancellation rights, and warranty terms are negotiable. A 2% cash discount or net-60 terms can be worth more than a lower sticker price.

Step 7 — Place and Track Purchase Orders

Use PO numbers, delivery schedules, and milestone payments. Confirm production slots and shipping dates in writing. Delays usually announce themselves early if you ask.

Step 8 — Inspect on Receipt

Check quantities, physical damage, labels, and certificates against the PO. Photograph any discrepancies immediately. Warranty claims are much harder without delivery documentation.

Step 9 — Manage Inventory and Returns

Track what arrives, what goes to site, and what sits in warehouse. Excess inventory ties up cash. Shortages cause delays. Both hurt margin.

How to Evaluate Suppliers and Avoid Tier 1 Traps

Tier 1 status is useful but widely misunderstood. BloombergNEF’s Tier 1 list measures bankability — the ability of a manufacturer to be used in non-recourse financed projects. It does not measure product quality, service quality, or financial health for small buyers.

A Tier 1 module from a manufacturer in financial distress is not a safe buy. A Tier 2 module with strong local support and a 25-year performance warranty can be the better choice for a residential installer.

A Real-World Supplier Decision

Consider two module quotes for a 500 kW commercial project in Arizona:

  • Supplier A: Tier 1 manufacturer, $0.31/W, 12-week lead time, payment terms 30% deposit / 70% against B/L, no U.S. warehouse.
  • Supplier B: Tier 2 manufacturer, $0.34/W, 4-week lead time, net-30 terms, local warehouse and service team.

On a 500 kW project, Supplier A saves $15,000 on module cost. But the 8-week earlier delivery from Supplier B reduces labor idle time, avoids a crane re-rental, and lets the project invoice sooner. The net result often favors Supplier B. Procurement decisions must be modeled at the project level, not the component level.

Supplier Evaluation Checklist

FactorWhat to VerifyRed Flag
CertificationsIEC 61215/61730, UL 61730, CEC listing, BIS, local grid codesMissing or expired certificates
BankabilityTier 1 status, credit reports, financial statementsRecent defaults or restructuring
WarrantyProduct and performance warranty terms, transferability, claim processVague or non-transferable warranties
CapacityManufacturing output relative to your order sizeOvercommitment or allocation risk
ReferencesOther installers who have used the productRefusal to provide references
Local SupportService center, spare parts, technical support in your regionNo local presence

For European-specific sourcing risks, see solar procurement challenges in Europe.

Pricing Models: Spot, Contract, and Blanket POs

Solar equipment is bought through three main pricing models. Each suits a different business model.

Spot Pricing

Spot pricing reflects current inventory and immediate availability. It works for urgent needs, small orders, or testing new suppliers. The downside is volatility. In Q1 2026, U.S. DDP TOPCon module spot prices ranged from $0.28–$0.44/W, while ex-factory China prices were roughly $0.07–$0.09/W, according to Portlandia Electric Supply wholesale data. The gap is tariffs, freight, and margin.

Contract Pricing

Contract pricing locks in rates for future deliveries, usually with volume commitments. It activates at volumes like 10+ pallets and can cut spot prices by 7–12%. Contract pricing suits installers with predictable project pipelines.

Blanket Purchase Orders

Blanket POs lock pricing and capacity for multiple releases over months or years. They typically require 50+ pallets or equivalent annual volume and can deliver 12–20%+ discounts. The tradeoff is forecasting risk. If your pipeline slows, you may face cancellation penalties or inventory pileup.

ModelBest ForPriceFlexibility
SpotUrgent/small ordersHighestHighest
ContractPredictable 3–6 month pipelineMediumMedium
Blanket POSteady high-volume pipelineLowestLowest

Regional Pricing Realities

Module pricing in 2026 varies sharply by delivery terms and origin. Ex-factory China prices for TOPCon modules were roughly $0.07–$0.09/W in early 2026. The same module delivered duty-paid in the U.S. ranged from $0.28–$0.44/W. That gap is not distributor greed. It includes ocean freight, insurance, customs clearance, Section 201 and 301 tariffs, and inland logistics.

European DDP prices typically sit between U.S. and China levels, influenced by anti-dumping investigations and the strength of the euro. Indian prices for ALMM-compliant modules are shaped by domestic manufacturing capacity and import restrictions. The lesson is simple: compare like-for-like incoterms, or the comparison is meaningless.

Common Solar Procurement Mistakes

Even experienced procurement teams make the same errors. Here are the most costly ones:

Optimizing only for module price. A $0.02/W module saving disappears when freight, tariffs, and financing are added. Always model total landed cost.

Ignoring incoterms. Ex-works, FOB, CIF, and DDP place different risks and costs on the buyer. DDP is easiest to budget but usually most expensive. Ex-works looks cheap until you manage freight and customs yourself.

Skipping delivery inspection. Warranty claims require proof of condition at delivery. Photograph pallets, check quantities, and document damage before signing the delivery note.

Overcommitting to blanket POs. A 20% discount is attractive, but if your pipeline slows, you may pay cancellation fees or hold excess inventory. Match blanket PO volume to realistic forecasts.

Neglecting warranty enforceability. A 25-year warranty from a manufacturer with no local presence is hard to enforce. Check who handles claims in your region.

Payment Terms: The Hidden Cost Lever

Payment terms are the most underutilized lever in solar procurement. A 2% discount for cash-in-advance sounds small until multiplied across $2 million in annual spend. Net-60 terms from a distributor sound convenient until you calculate the 2.5% financing premium baked into their pricing.

Common Payment Structures

TermTypical DiscountWhen It Works
Cash in advance1–3%Strong cash position, trusted supplier
30% deposit, 70% against B/L0–1%Standard for imports, balances risk
Letter of credit0%New supplier, high-value order
Net-30 / Net-60None, often premiumNeed cash flow flexibility

The right structure depends on your cost of capital and supplier reliability. If your weighted average cost of capital is 12% annually, a 2% discount for paying 60 days early is roughly equivalent to a 36% annualized return. That is usually worth taking.

Risk Management: Tariffs, Lead Times, and Quality Failures

Solar procurement in 2026 carries risks that can erase margins overnight. The companies that survive supply chain shocks build risk management into procurement strategy, not react after the fact.

Tariff and Policy Risk

The U.S. maintains Section 201 tariffs at 14.25% on modules and Section 301 tariffs at 25% on Chinese cells and modules. The EU has imposed provisional anti-dumping duties on some Chinese solar components. India maintains the ALMM list, restricting eligible module suppliers for subsidy-backed projects. These rules change. Build a 10–15% policy contingency into total landed cost for cross-border procurement.

Lead Time Risk

Inverter lead times in 2026 remain stretched, often 8–16 weeks for commercial power electronics, according to European procurement data. Module lead times vary from a few days for stocked product to 8–12 weeks for factory-direct orders. Lock inverter orders early. A project ready for installation but waiting on inverters burns labor and customer goodwill.

Quality Failure Risk

Quality failures include underperforming modules, connector corrosion, inverter firmware bugs, and racking galvanic corrosion. Mitigation includes factory audits, sample testing, third-party inspection before shipment, and delivery inspection on receipt.

Logistics and Currency Risk

Ocean freight rates and currency swings can change total landed cost by 5–10% between quote and delivery. A container from Shanghai to Los Angeles that cost $2,500 in 2019 spiked above $20,000 during the 2021–2022 supply chain crisis and has since normalized but remains volatile. Lock freight rates where possible, and consider hedging currency exposure on large orders.

For more on supply chain dynamics, see solar supply chain trends 2026.

Software’s Role: Why Accurate Design Cuts Procurement Waste

The most expensive procurement mistake often starts in design. A BOM generated from an inaccurate roof layout or an incompatible string configuration leads to wrong quantities, wrong specs, and rush orders at spot prices.

Modern solar design software reduces procurement waste in four ways:

  1. Accurate quantities. Precise module counts and cable lengths prevent over-ordering and shortages.
  2. Spec consistency. The software enforces inverter and module compatibility, reducing substitutions.
  3. Rapid redesign. If a preferred module is unavailable, the design can be re-optimized quickly.
  4. Proposal alignment. Procurement matches what was sold, reducing change orders and customer disputes.

For financial modeling tied to procurement assumptions, use the generation and financial tool.

Procurement Technology Stack

Beyond design software, procurement teams should use:

  • ERP or inventory system to track POs, receipts, and stock levels.
  • Supplier scorecard to track on-time delivery, quality, and response rate.
  • Contract repository to store pricing agreements, warranty terms, and certificates.
  • Communication log to document every supplier commitment in writing.

Spreadsheets work for small teams, but they break above 50 projects per year. The cost of a proper system is usually recovered through fewer stockouts and less expedited shipping.

Cut Procurement Waste Before You Buy

SurgePV gives installers accurate BOMs, compatible equipment specs, and fast redesigns so procurement teams buy once and buy right.

Book a Demo

No commitment required · 20 minutes · Live project walkthrough

Procurement Metrics Every Installer Should Track

What gets measured gets managed. The procurement metrics that matter most are:

MetricFormulaTarget
Total Landed Cost per Watt(Equipment + freight + tariffs + financing) / system wattageBenchmark against prior quarter
Purchase Price Variance(Actual price – Standard price) × QuantityWithin 2% of budget
Supplier On-Time Delivery RateOn-time deliveries / Total deliveriesAbove 90%
Inventory TurnoverAnnual material cost / Average inventory value6–12× per year
Warranty Claim RateClaims / Total units purchasedBelow 0.5%
RFQ Response RateSuppliers responding / Suppliers invitedAbove 70%

Track these monthly. Trends matter more than single data points. A supplier with a 95% on-time rate that drops to 80% is sending a signal before a project fails.

Conclusion: 3 Actions for 2026

Solar procurement is not about finding the cheapest module. It is about building a system that delivers the right equipment, at the right total cost, at the right time, with acceptable risk. In 2026, that means three things:

  • Lock supply early. On-demand procurement is expensive. Use contracts or blanket POs where your pipeline justifies it.
  • Negotiate terms, not just price. Payment terms, delivery windows, and warranty terms often move project margin more than unit price.
  • Start with accurate design. A precise BOM from reliable solar design software prevents the costly procurement errors that show up during installation.

Frequently Asked Questions

What is solar procurement?

Solar procurement is the process of sourcing, negotiating, and purchasing all equipment and services needed for a solar project. It includes modules, inverters, mounting, BOS, logistics, and sometimes labor or EPC contracts.

How do I choose a solar panel supplier in 2026?

Verify IEC 61215/61730 or UL 61730 certification, Tier 1 bankability status, warranty terms, and local support. Request references, inspect sample shipments, and compare total landed cost rather than just module price.

What is the difference between spot and contract pricing for solar panels?

Spot pricing reflects current inventory and market rates with short lead times. Contract pricing locks in rates for future deliveries, usually at lower prices but with volume commitments and longer planning horizons.

How do tariffs affect solar procurement costs?

U.S. Section 201 and 301 tariffs, EU anti-dumping duties, and India’s ALMM rules can add 10–50% to module costs depending on origin and technology. Buyers must factor these into total landed cost, not ex-factory price.

What payment terms are typical in solar procurement?

Common terms include cash-in-advance with 1–3% discounts, 30% deposit with 70% against bill of lading, and net-30 to net-60 with financing premiums. The best terms depend on your cash flow and supplier relationship.

How can solar design software reduce procurement costs?

Accurate design software produces precise BOMs, prevents over-ordering, matches module and inverter specs, and reduces change orders. Errors in design often become expensive procurement mistakes.

What is a blanket purchase order in solar procurement?

A blanket PO is a long-term agreement that locks pricing and capacity for multiple deliveries over months or years. It suits installers with steady project pipelines and can cut costs by 12–20% compared to spot buying.

What are the biggest risks in solar procurement?

The biggest risks are price volatility, tariff changes, supplier insolvency, long inverter lead times, quality failures, and logistics delays. Diversifying suppliers and locking contracts early are the main defenses.

About the Contributors

Author
Akash Hirpara
Akash Hirpara

Co-Founder · SurgePV

Akash Hirpara is Co-Founder of SurgePV and at Heaven Green Energy Limited, managing finances for a company with 1+ GW in delivered solar projects. With 12+ years in renewable energy finance and strategic planning, he has structured $100M+ in solar project financing and improved EBITDA margins from 12% to 18%.

Editor
Rainer Neumann
Rainer Neumann

Content Head · SurgePV

Rainer Neumann is Content Head at SurgePV and a solar PV engineer with 10+ years of experience designing commercial and utility-scale systems across Europe and MENA. He has delivered 500+ installations, tested 15+ solar design software platforms firsthand, and specialises in shading analysis, string sizing, and international electrical code compliance.

Get Solar Design Tips in Your Inbox

Join 2,000+ solar professionals. One email per week - no spam.

No spam · Unsubscribe anytime

Book Free Demo
