Quick Answer
Solar supply chain trends in 2026 show module prices stabilizing at $0.10–$0.15/W, polysilicon at $8–$12/kg, and manufacturing shifting to Southeast Asia and India to avoid tariffs. Wafer and cell capacity expansions reduce reliance on Chinese supply chains.
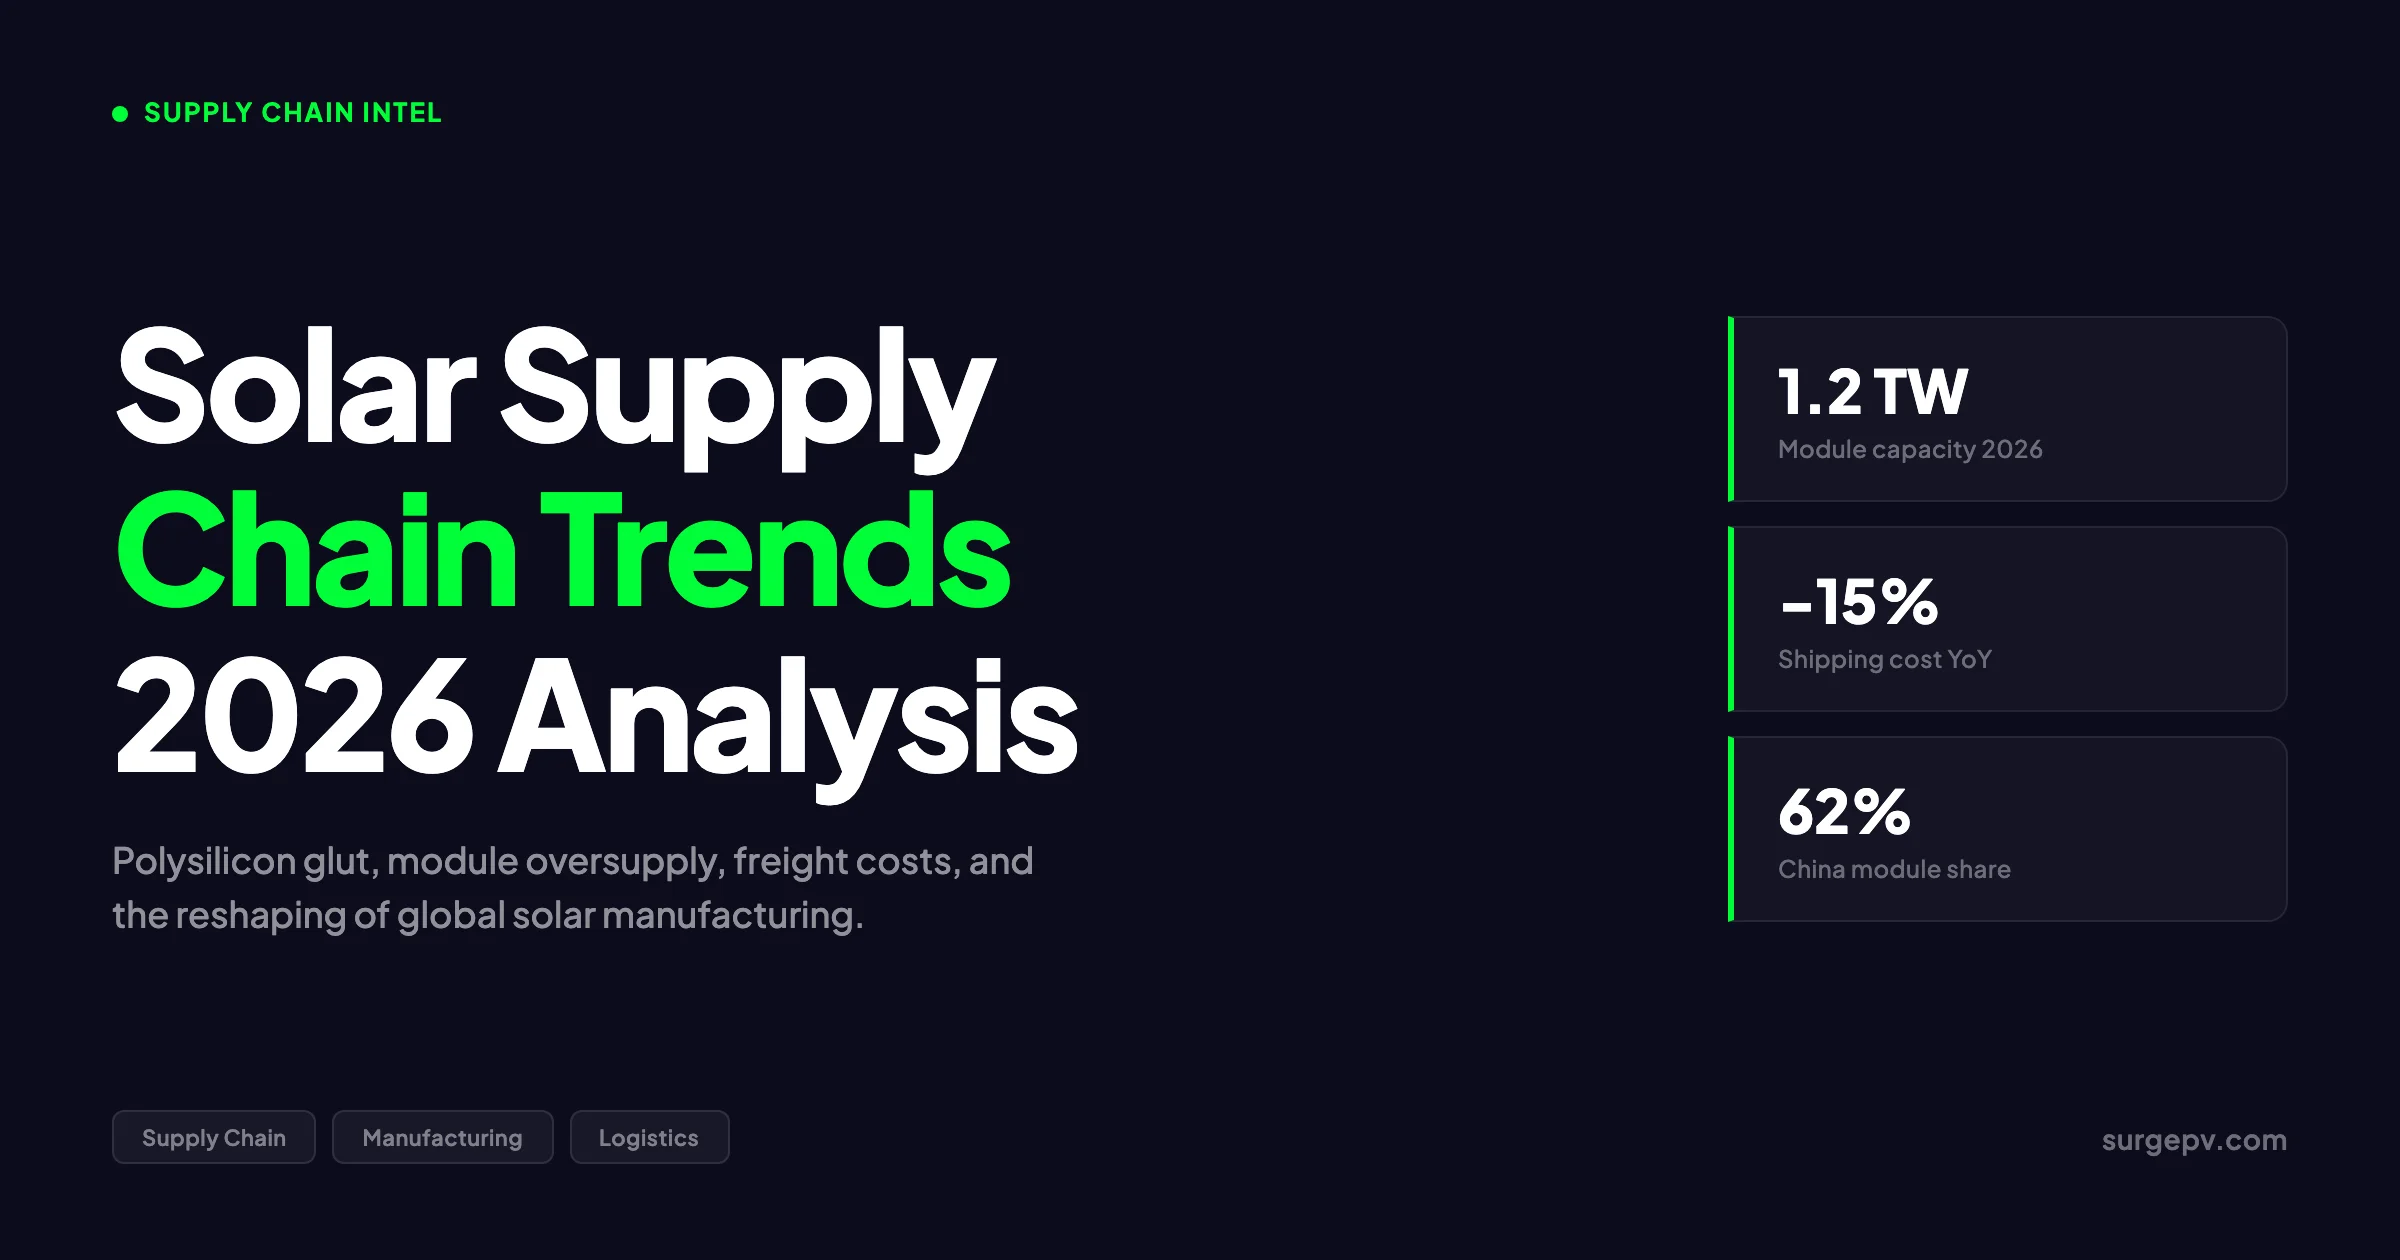
The defining feature of the solar supply chain in 2026 is not scarcity, it is structural oversupply. Global module manufacturing capacity sits above 1,100 GW against roughly 650 GW of installation demand, and polysilicon spot prices have fallen 84% from the 2022 peak according to BloombergNEF. Tongwei, GCL Tech, and Daqo New Energy are throttling production rather than expanding. China booked $130 billion of solar manufacturing investment between 2022 and 2024, and the comedown has arrived. For Global-specific compliance details, see Global net-metering-by-country. For Global-specific compliance details, see Global solar-permitting-speed-by-country.
Solar supply chain trends in 2026 show module prices stabilizing at $0.10–$0.15/W, polysilicon at $8–$12/kg, and manufacturing shifting to Southeast Asia and India to avoid tariffs. Wafer and cell capacity expansions reduce reliance on Chinese supply chains. Also see: Best Solar Design Software India. For the latest details on India, see 5kW Solar Panel Price in India.
For installers and developers, the practical question is no longer whether modules will be available. It is which suppliers will still be solvent in 18 months, which trade lanes will stay open, and which contracts protect margin when freight, silver, and tariff shocks land at the same time. This guide maps the 2026 solar supply chain end to end — polysilicon to panel, freight to financing — with named entities, current prices, and a procurement playbook installers and EPCs can use this quarter.
TL;DR — Solar Supply Chain Trends 2026
Global capacity over 1,100 GW vs roughly 650 GW demand (IEA, 2025). China holds 80%+ of polysilicon, wafer, cell, and module capacity (Wood Mackenzie, 2025). Module prices stabilizing near $0.085/W ex-China after an 84% polysilicon price decline since 2022 (BloombergNEF). Freight at 4% of module cost, with Asia-Europe at $2,000–$2,800/FEU. Inverter market contracting 9% in 2026 to 523 GWac (Wood Mackenzie). US delivered prices stay elevated at $0.30–$0.45/W because of AD/CVD duties up to 3,404%.
In this guide:
- The full solar supply chain map 2026 — polysilicon, wafer, cell, module, BOS
- Polysilicon capacity and the 84% price drop, plus 2026–2028 outlook
- Wafer and cell bottlenecks (silver, n-type transition)
- Module manufacturing: China’s 80% share vs IRA, PLI, EU Net-Zero Act reshoring
- What most supply chain reports get wrong about 2026
- Ocean freight, Red Sea diversions, and landed cost math
- Inverter and BOS component availability through 2026
- 2027–2028 supply outlook and where the next squeeze will appear
- A procurement playbook for installers and developers
For more details, see our guide on N-type vs P-type solar cells.
Solar Supply Chain Map 2026 — From Polysilicon to Panel
The solar supply chain runs through five physical tiers and three commercial layers. Understanding the choke points starts with knowing where value, capacity, and risk concentrate at each step.
The Five-Tier Physical Supply Chain
| Tier | Input | Output | Key Players 2026 | China Share |
|---|---|---|---|---|
| 1. Polysilicon | Metallurgical silicon | Solar-grade poly | Tongwei, GCL Tech, Daqo, Xinte, Wacker, OCI | 93% |
| 2. Ingot & Wafer | Polysilicon | Mono wafers | LONGi, TCL Zhonghuan, JinkoSolar, JA Solar | 97% |
| 3. Solar Cell | Wafer | PERC/TOPCon/HJT cell | LONGi, JinkoSolar, Tongwei, Aiko, Trina | 90% |
| 4. Module | Cell + glass + frame | Finished PV module | JinkoSolar, JA Solar, Trina, LONGi, Canadian Solar | 85% |
| 5. BOS / Inverter | Power electronics | Inverter, racking, cabling | Sungrow, Huawei, Enphase, SolarEdge, SMA | 65% |
Source: BloombergNEF 2025, Wood Mackenzie 2025, IEA Renewables 2025. China share reflects production capacity, not necessarily shipments.
Each tier has a different financial profile. Polysilicon is capital-heavy and cyclical, with new fabs taking 18–30 months to ramp. Wafer is mid-capital and increasingly automated. Cell is technology-sensitive — the PERC-to-TOPCon transition that ate 2023–2025 will be followed by an HJT and back-contact transition through 2027. Modules are commodity assembly. BOS is fragmented and regional.
Where Value Concentrates in 2026
A breakeven $0.085/W module manufactured in China splits roughly as follows, based on BloombergNEF’s January 2026 cost stack:
| Cost Bucket | Share of Module Cost | $/W |
|---|---|---|
| Polysilicon | 11–14% | $0.010–$0.012 |
| Wafer (ex-poly) | 9–12% | $0.008–$0.010 |
| Cell (ex-wafer, silver intensive) | 22–28% | $0.019–$0.024 |
| Glass, EVA, backsheet, frame | 24–30% | $0.020–$0.026 |
| Cell-to-module assembly + overhead | 18–24% | $0.015–$0.020 |
| Margin / freight at factory gate | 4–7% | $0.003–$0.006 |
Source: BloombergNEF module cost model January 2026; assumes integrated Tier 1 Chinese producer, n-type TOPCon, 580 W module.
The interesting fact is that polysilicon is no longer the dominant cost line. Silver paste, glass, and the cell processing step now matter more for marginal economics. That changes how procurement teams should hedge in 2026 — locking polysilicon contracts buys less protection than locking silver and glass prices.
Key Takeaway — Where the Choke Points Are
The 2026 supply chain is not constrained at polysilicon. It is constrained at non-China cell capacity (3.2 GW in the US, 26 GW in India per official January 2026 data), at FEOC-compliant cells for IRA-eligible US projects, and at hybrid inverters with cybersecurity certification for EU markets. If you are buying for the US or EU markets, those three are your real risk lines.
For sizing decisions that depend on accurate module spec data and BOS counts, solar design software that pulls live datasheets and cross-references regional availability removes a class of procurement error that becomes expensive when modules are repriced mid-quote.
Polysilicon Capacity and Pricing Dynamics
Polysilicon is the original chemical input that makes a solar cell possible. It is also the most volatile line in the 2026 supply chain. The five-year price chart looks like a heart attack — a 4× spike in 2021–2022, then an 84% crash through 2024–2025, then a tentative floor in early 2026.
Global Polysilicon Capacity 2026
| Producer | Country | 2026 Capacity (kt/year) | Notes |
|---|---|---|---|
| Tongwei | China | 900+ | Largest by capacity; integrated downstream into cells |
| GCL Tech | China | 480 | Pioneered FBR (granular) polysilicon at scale |
| Daqo New Energy | China | 305 | NYSE-listed; Inner Mongolia and Xinjiang |
| Xinte Energy | China | 300 | Subsidiary of TBEA |
| Asia Silicon | China | 90 | Qinghai-based |
| Wacker Chemie | Germany / US | 80 | Burghausen (DE) + Charleston (TN) |
| OCI (Malaysia) | Malaysia | 35 | Non-Chinese supply for US/EU buyers |
| REC Silicon | US | 0 (idled) | Moses Lake restarted 2024, idled mid-2024 |
| Hemlock Semiconductor | US | 36 | Primarily electronics-grade |
Source: company filings, BloombergNEF, S&P Global Platts polysilicon tracker, late 2025. Capacity figures are nameplate.
That table tells the story. Roughly 2.2 million tonnes of nameplate polysilicon capacity exists globally. The 2026 demand envelope is approximately 1.0–1.1 million tonnes. Capacity is double demand, and most non-Chinese capacity is either idled (REC), captive to semiconductors (Hemlock), or small enough to be price-takers rather than market-setters.
The 84% Price Crash, in One Table
| Date | Polysilicon Spot ($/kg) | Source |
|---|---|---|
| September 2022 (peak) | $39.00 | S&P Global Platts |
| June 2023 | $9.20 | BloombergNEF |
| December 2024 | $5.10 | BloombergNEF |
| Q1 2026 average | $6.20 | InfoLink Consulting |
China’s January 2026 removal of the 9% export VAT rebate for PV products has put a soft floor under spot prices, since exporters can no longer dump below variable cost and still recover tax credits. That is the first concrete reason in three years to expect prices to stabilize rather than fall further.
What That Means for Module Prices
A 580 W TOPCon module needs about 2.0 g of polysilicon per watt. At $6.20/kg, polysilicon adds $0.012/W to module cost. At the 2022 peak of $39/kg, it added $0.078/W — almost the entire price of a 2026 module. The polysilicon price collapse is the single largest reason finished modules are at $0.085/W and not $0.20/W.
Pro Tip — Polysilicon Hedging in 2026
If you sign a 12-month module supply agreement in 2026, lock pricing rather than indexing to polysilicon spot. With the floor near $6/kg and capacity discipline returning, polysilicon-linked formulas are now a one-way bet against the buyer. Fixed-price contracts at $0.085–$0.095/W FOB are the standard ask from Tier 1 Chinese suppliers this year.
Trade Policy Wildcards
Two policy moves can move 2026 polysilicon pricing more than market fundamentals. The US Department of Commerce opened a Section 232 investigation into polysilicon imports in late 2025, with findings expected in mid-to-late 2026. If duties land on Chinese or Malaysian polysilicon, the US delivered price spread widens further. Separately, the EU’s Forced Labour Regulation, effective from December 2027, will require chain-of-custody documentation through to the silica mine. Xinjiang polysilicon is already excluded under the US UFLPA, and the EU is closing the gap.
Wafer and Cell Bottlenecks
Wafer and cell are the steps where 2026’s real bottlenecks live — not in raw poly, but in the conversion capacity that turns poly into electricity-generating semiconductor.
Wafer Manufacturing 2026
LONGi remains the world’s largest wafer manufacturer, with TCL Zhonghuan a close second. Together they hold roughly 50% of global wafer capacity. The non-China alternatives are small: Vietnam at about 30 GW of wafer capacity per InfoLink, and India ramping toward 22 GW by year-end 2026 through Adani New Industries, Waaree, and Reliance New Energy.
A wafer fab takes 18 months to build and 6 months to qualify. That lead time matters because the n-type transition (from p-type PERC to n-type TOPCon and HJT) made roughly 200 GW of legacy p-type wafer capacity uneconomic between 2023 and 2025. Wood Mackenzie tracked approximately 200 GW of cancelled wafer capacity projects in 2024 — roughly $25 billion of capex deferred or written off.
Cell Manufacturing — The Real Bottleneck
| Region | Cell Capacity 2026 (GW) | Module Capacity 2026 (GW) | Cell:Module Ratio |
|---|---|---|---|
| China | 950+ | 1,100+ | ~0.86 |
| India | 26 | 162 | 0.16 |
| United States | 3.2 | 65 | 0.05 |
| Vietnam | 65 | 40 | 1.6 |
| Thailand | 34 | 22 | 1.5 |
| South Korea | 14 | 12 | 1.2 |
| Europe | 4 | 9 | 0.4 |
Source: SEIA, MNRE India, InfoLink Consulting January 2026, IEA-PVPS Trends 2025.
That table is the single most useful chart in this guide. The US module capacity (65 GW) looks impressive — until you see the 3.2 GW of cell capacity behind it. Most US “manufactured” modules in 2026 are assembly operations using cells from Southeast Asia. India is in a similar position: 162 GW of module nameplate against just 26 GW of cell.
That cell-to-module mismatch is why the February 2026 US Commerce Department preliminary determination on Indonesia, Laos, and India transshipped cells matters so much. With 80%+ AD/CVD duties on those origins, the US module supply for utility-scale buyers narrows fast.
Silver, TOPCon, and the Cost Squeeze
n-type TOPCon cells use roughly 14–16 mg of silver paste per cell. With silver trading above $30/oz through most of 2025 and approaching $35/oz in early 2026, silver paste alone now accounts for $0.005–$0.008 per watt of module cost. That is more than polysilicon. Silver paste suppliers Heraeus, DuPont, and Fusion New Materials are the unsung names every solar procurement team should know.
The technology roadmap is clear: HJT cells use less silver (8–10 mg through copper plating innovations), and back-contact cells like LONGi’s HPBC and SunPower’s IBC architecture use silver more efficiently. But the transition from TOPCon to HJT or BC won’t reach scale until 2027–2028. Until then, silver risk sits inside every cell contract.
Module Manufacturing — China Dominance vs Reshoring
The module assembly tier is where industrial policy hits markets hardest. China still controls 85% of nameplate capacity in 2026, but the more interesting story is the 220+ GW of non-China capacity built up under the IRA, India’s PLI, and the EU Net-Zero Industry Act.
Top 10 Module Manufacturers 2026 (Shipped Volume Basis)
| Manufacturer | HQ | Estimated 2026 Shipments (GW) | Vertical Integration |
|---|---|---|---|
| JinkoSolar | China | 100+ | Polysilicon to module |
| LONGi | China | 95–105 | Wafer to module, polysilicon JV |
| JA Solar | China | 80–90 | Wafer to module |
| Trina Solar | China | 75–85 | Wafer to module |
| Canadian Solar | China/Canada | 50–55 | Wafer to module |
| Tongwei Solar | China | 45–55 | Polysilicon to module |
| Astronergy (Chint) | China | 45–50 | Cell + module |
| First Solar | United States | 18–20 | CdTe thin-film |
| Hanwha Qcells | South Korea / US | 14–16 | Cell + module, Georgia hub |
| Waaree Energies | India | 12–15 | Module + cell ramp |
Source: company guidance, Wood Mackenzie module tracker Q1 2026, BNEF Tier 1 list.
Notice First Solar’s position. It is the only top-10 manufacturer using thin-film CdTe rather than crystalline silicon, which exempts it from polysilicon-linked trade risk entirely. That structural difference is why First Solar’s order book runs into 2027–2028 at sold-out levels while crystalline competitors fight on price.
Reshoring Reality Check
| Region | Policy Lever | Cost Penalty vs China | Effective Capacity 2026 |
|---|---|---|---|
| United States | IRA Section 45X | 4–5× higher integrated cost | 65 GW (assembly), 3.2 GW (cells) |
| India | PLI Scheme + ALMM | 2–3× higher | 162 GW module, 26 GW cell |
| EU | Net-Zero Industry Act | 4× higher pre-subsidy | ~9 GW module |
| Southeast Asia | Tax holidays | 1.25× higher | 90 GW module |
Source: BloombergNEF integrated module manufacturing cost study January 2026.
BloombergNEF’s headline number bears repeating: building a fully integrated solar value chain in the US costs roughly 4× a Chinese equivalent before subsidies. With IRA 45X production credits ($0.07/W for modules, $0.04/W for cells, $0.04/W for wafers), domestic US manufacturers can close most of that gap on a unit-economics basis. The credit was made permanent by the IRA. The risk is not the credit’s existence — it is the FEOC restriction that excludes manufacturers with Chinese ownership ties from claiming it from 2026 onward.
Quotable Opinion
China’s manufacturing supremacy in 2026 is not a deficiency of Western capital. It is a deficiency of Western patience. Tongwei spent 12 years and roughly $15 billion to dominate polysilicon. Most US manufacturing announcements in 2022–2024 had three-year ROI assumptions. The math never added up unless 45X credits were treated as permanent, which they now are, but only for FEOC-clean projects. That is the rub of 2026.
What Most Supply Chain Reports Get Wrong
Most 2026 solar supply chain analysis is built on three assumptions that fail under inspection. If you are using these reports to make procurement decisions, the framing matters more than the numbers.
Misconception 1: “There Is a Polysilicon Shortage”
There is not. The supposed shortage stories from late 2025 reflect inventory de-stocking at four major Chinese producers (Tongwei, GCL, Daqo, Xinte), which collectively chose to throttle output rather than run cash-negative. Nameplate capacity exceeds demand by roughly 2:1. The genuine risk is producer solvency, not raw material availability. Daqo’s 2024 EBITDA went negative for the first time in eight quarters of public reporting. If two of the top five producers go through restructuring in 2026, that is a cash-flow shock for buyers on contract-with-Daqo terms, not a physical shortage.
The Real Misconception About Inverter “Shortages”
Wood Mackenzie’s December 2025 forecast is for the global inverter market to contract 9% in 2026 to 523 GWac, after a 2% contraction in 2025. That is the opposite of a shortage. The narrative confusion is regional — in the US, the IRA’s pivot to FEOC restrictions and the December 2025 Treasury guidance has caused some buyers to switch from Sungrow and Huawei to Enphase, SolarEdge, SMA, and Fronius. That switching looks like scarcity at the SKU level but not at the market level. Anyone telling you 2026 has a global inverter shortage has not read the Wood Mackenzie data.
Tradeoff: Domestic Content vs Cost
The honest 2026 tradeoff for US installers and developers is straightforward. To claim the IRA 45X bonus credit (10% adder) on a project, you need 40% domestic content in 2026, rising to 55% in 2027. Hitting that threshold using FEOC-clean modules and inverters typically adds $0.08–$0.15/W to landed cost. The math works for utility-scale developers on a 25-year PPA. For commercial rooftop installers competing on quoted system price, the same calculation often does not pencil. Whoever tells you “domestic content is a no-brainer for everyone” has not run the spreadsheet.
Narrative: A Procurement Story From 2025
A friend who runs procurement at a UK-based EPC told me his 2025 lesson plainly. He locked a Q3 2025 module contract at $0.092/W FOB with a Tier 2 Chinese supplier, against a job that needed Q4 delivery. The Red Sea was already in full diversion. The supplier had cleared payment, then went into restructuring before shipment. He recovered the inventory by physically sending a buyer to the Ningbo factory floor with an attorney. He now writes a 10-day inspection clause and a payment-on-bill-of-lading term into every PO over $200k. That paragraph is the single best supply chain risk mitigation strategy I have read all year, and it does not appear in any BNEF report. For UK-specific information, see Battery Solar System Design UK.
Opinion — The 2026 Supply Chain Is About Counterparties, Not Components
The 2026 risk is no longer “will modules arrive on time.” Capacity says they will. The risk is whether your specific supplier is still operating, has clean FEOC documentation, has insurance against silver and freight shocks, and can produce a valid UFLPA/EUDR audit trail. Pick the counterparty first. Pick the SKU second.
Stop losing margin to mid-project module repricing
Auto-update procurement specs when supplier datasheets change, lock in BOS counts before quotes go out, and run accurate ROI math against current 2026 component pricing inside one platform.
Book a DemoNo commitment required · 20 minutes · Live project walkthrough
Shipping, Freight Rates, and Logistics 2026
Freight is the unsung 4% of module cost that can become 20% overnight, as 2021–2022 proved. In 2026 freight is back near normalised levels, but with Red Sea diversions and Q4 surcharges, the variance band is wider than the headline rate suggests.
Container Spot Rates Q1 2026
| Trade Lane | Q1 2026 Rate ($/FEU) | YoY Change | Source |
|---|---|---|---|
| Asia → US West Coast (FBX01) | $2,127 | -10% | Freightos Baltic Index |
| Asia → US East Coast (FBX03) | $3,069 | -8% | Freightos Baltic Index |
| Asia → North Europe (FBX11) | $2,707 | -5% | Freightos Baltic Index |
| Asia → Mediterranean (FBX13) | $3,850 | +12% | Freightos Baltic Index |
| Asia → South America East | $4,200 | +5% | Drewry WCI |
| Asia → Africa East Coast | $2,900 | -3% | Drewry WCI |
Source: Freightos Baltic Index FBX, Drewry World Container Index, January 2026 weekly composite. Rates are spot, not contract.
What a Container of Modules Actually Costs to Ship in 2026
A standard 40HQ container holds 600–700 modules of the 580 W TOPCon class, totalling roughly 350–410 kW of nameplate capacity per container. At $2,500/FEU Asia-Europe, that is approximately $0.006–$0.007 per watt for ocean freight alone.
Landed cost on a £10,000 FOB shipment to UK, per Freightos pricing in Q1 2026:
| Line Item | Cost | Cumulative |
|---|---|---|
| FOB China value | £10,000 | £10,000 |
| Ocean freight (40HQ) | £2,000 | £12,000 |
| UK import duty (0–2.5% on solar) | £250 | £12,250 |
| UK VAT (20% on duty + freight + goods) | £2,450 | £14,700 |
| Broker, handling, inland transport | £400 | £15,100 |
Source: HMRC tariff schedule, Freightos UK calculator, January 2026.
UK VAT recovery applies for VAT-registered EPCs, so the effective landed cost for a registered business is closer to £12,650. For B2C residential installers, the full landed cost stands.
Red Sea Risk Premium
Houthi-related Red Sea diversions remain operationally active in early 2026. Most carriers are still routing around the Cape of Good Hope on Asia-Europe lanes, which adds:
- 10–14 days of transit time
- Approximately $300–$600 per FEU in bunker and surcharge
- Vessel capacity utilisation roughly 15% above 2023 baseline
If the Red Sea normalises in 2026, expect Asia-Europe rates to drop $400–$700 per FEU within a quarter. That is worth tracking weekly for any buyer with quarterly shipments scheduled.
Air Freight as Emergency Lever
For inverter and high-value BOS components — not modules — air freight from Shanghai to Frankfurt runs $4–$6 per kilogram in Q1 2026. A 50 kW commercial string inverter weighs 50–75 kg, so air freight adds $200–$450 per unit, roughly $0.005/W on a 50 kW system. For a project running against an incentive deadline, that math is occasionally worth it for the inverter. It is essentially never worth it for modules.
See also: microinverters vs string inverters.
Inverter and BOS Component Availability
Outside the panel itself, the 2026 supply chain story is set by inverters, racking, switchgear, and increasingly by batteries. Each component has its own bottleneck.
Inverter Market — Contraction, Not Shortage
Wood Mackenzie’s December 2025 forecast: the global solar inverter market will contract from 587 GWac in 2024 to 577 GWac in 2025 to 523 GWac in 2026 — a 9% drop next year. The decline is concentrated in three regions:
| Region | 2025 (GWac) | 2026 (GWac) | YoY Change |
|---|---|---|---|
| China | 304 | 280 | -8% |
| United States | 47 | 37 | -22% |
| Europe | 83 | 76 | -8% |
| Rest of World | 143 | 130 | -9% |
Source: Wood Mackenzie Global Solar Inverter Strategic Planning Outlook, December 2025.
The major manufacturers — Sungrow, Huawei, Ginlong (Solis), GoodWe, SMA, Enphase, SolarEdge, Fronius, Tesla — all have ample inventory through 2026. Pricing is falling, with Chinese three-phase string inverters expected to drop below $0.02/W AC in 2026 per Wood Mackenzie’s projection.
The exception is FEOC-clean inverters for US IRA-eligible projects. Enphase, SolarEdge (US-assembled lines), SMA, and Fronius are the main FEOC-clean suppliers. Lead times for those specific SKUs run 12–20 weeks in early 2026, against 4–8 weeks for Chinese-origin equivalents.
Inverter Cybersecurity Compliance — The 2026 Wild Card
Both the US Department of Commerce and the EU are tightening rules on remote-access capabilities in grid-tied inverters. Republican lawmakers have urged restrictions on Chinese inverter imports, and Europe is expected to expand the Cyber Resilience Act with PV-specific requirements through 2026. The practical effect is that some Chinese inverter SKUs available today may need re-certification before late 2026, which could create temporary regional shortages by SKU even while global supply stays loose.
Racking, Cabling, and BOS
Racking is the unsexy part of the BOS story. Steel and aluminium account for roughly 90% of racking cost, and the 2024–2025 aluminium price spike (LME 3-month above $2,700/tonne through most of 2025) pushed racking prices up 8–12% even as modules fell. For 2026, the main racking suppliers — Schletter, K2, Esdec, Unirac, IronRidge — are reporting normalising lead times of 4–8 weeks. Galvanised steel substrate is in shorter supply for ballasted flat-roof systems, where lead times stretch to 10–14 weeks.
For shading-aware site layouts that minimise racking quantity, solar shadow analysis software often shaves 3–5% off racking cost by avoiding suboptimal panel positions before procurement is finalised.
Batteries — The Tightest Sub-Market in 2026
Lithium iron phosphate (LFP) cells are the dominant battery chemistry for solar-plus-storage in 2026. CATL, BYD, EVE Energy, and Gotion control over 70% of LFP cell production. With grid-scale storage demand growing 60%+ year-over-year per IEA data, LFP cell allocations are tight even though nameplate capacity exceeds demand. The squeeze in 2026 is on cell-level FEOC sourcing for US battery storage projects claiming IRA Section 45X credits, where the domestic content rules now apply at the cell level rather than just the pack level. For more on this topic, see Adding Battery Storage Services.
Pro Tip — BOS Procurement Sequence in 2026
Order inverters first. Lead time on FEOC-clean inverters is the longest single component path on any US IRA-eligible project, often 16–20 weeks. Order modules second, with a 6–10 week window. Order racking and BOS last, since lead times are 4–8 weeks and prices are still moving down. Reversing this order is the single most common procurement mistake we see on commercial projects.
2027-2028 Supply Outlook
Predicting 2027–2028 in commodity markets is a fool’s errand. But the structural inputs — capacity, technology transitions, and policy — are knowable. Here is what they imply.
Capacity Pipeline Through 2028
Wood Mackenzie expects approximately 200 GW of further polysilicon and wafer capacity to be cancelled or deferred through 2027 as Chinese producers consolidate. Even after those cancellations, capacity will exceed demand through 2028 by a comfortable margin.
| Year | Module Demand (GW DC) | Module Capacity (GW) | Capacity / Demand |
|---|---|---|---|
| 2025 | 655 | 1,150 | 1.76 |
| 2026 | 753 | 1,200 | 1.59 |
| 2027 | 800 | 1,250 | 1.56 |
| 2028 | 870 | 1,300 | 1.49 |
Source: BloombergNEF May 2026 demand forecast, IEA Renewables 2025 supply outlook.
The capacity-to-demand ratio narrows from 1.76 in 2025 to 1.49 in 2028 — still well above the 1.20 ratio that historically supports stable pricing. The implication is that 2027–2028 will look more like a normal commodity market than the meltdown of 2023–2024 or the squeeze of 2021–2022.
Technology Transitions to Watch
n-type TOPCon currently holds approximately 75% of new cell production. The next transitions are HJT (heterojunction) and BC (back-contact, including LONGi’s HPBC2 and SunPower IBC). BloombergNEF projects HJT to reach 15% market share by 2028 and BC to reach 12%, with TOPCon settling around 65%. Each transition is silver-light, which structurally lowers the silver cost line that bites 2026 economics.
Trade and Policy Outlook
Three policy developments will shape 2027–2028:
- US Section 232 polysilicon ruling — expected mid-to-late 2026, with potential duties on Chinese and Malaysian-origin polysilicon shipping to US.
- EU Forced Labour Regulation enforcement — effective December 2027, requiring documented chain of custody for solar imports.
- IRA 45X domestic content thresholds rising — from 40% in 2026 to 55% in 2027 to 75% post-2028, increasing the premium for fully US-sourced systems.
The net of those three: US delivered module prices likely remain $0.30–$0.45/W through 2028, while ex-China prices stay in the $0.08–$0.10/W range. The transatlantic price gap is structural for the rest of the decade.
Where the Next Squeeze Will Appear
If I had to bet on the 2027 squeeze, my money would be on wafer, not polysilicon or module. The reasons: silver paste prices are still rising, n-type wafer capacity write-downs have removed marginal capacity, and the HJT/BC transition will demand thinner wafers and tighter quality control that fewer producers can deliver at scale. LONGi and TCL Zhonghuan can write that quality book. Tier 2 wafer producers will struggle.
Procurement Strategies for Installers and Developers
The procurement playbook for 2026 is different from any year since 2019. Oversupply means buyer leverage. The discipline is to use that leverage without taking on counterparty risk that bites later.
Five-Step Procurement Playbook 2026
1. Multi-source every tier above 50 kW. Single-source contracts above 50 kW total system value are the highest-risk move in a 2026 procurement strategy. Split between at least two Tier 1 manufacturers. Trina + JinkoSolar, or LONGi + JA Solar, are common pairings. The 1–2% price premium of dual-sourcing is cheaper than a stalled project.
2. Lock pricing, not formulas. With polysilicon at a soft floor and silver rising, indexed contracts no longer protect the buyer. Negotiate fixed-price 12-month contracts at $0.085–$0.095/W FOB China for utility-scale, or $0.10–$0.12/W DDP for European mid-market.
3. Demand documented FEOC and UFLPA chain of custody. For US projects, this is a 45X eligibility issue. For EU projects from December 2027, it is a regulatory compliance issue. For UK and rest-of-world, it is a future-proofing investment. The cost of building chain-of-custody documentation post-shipment is roughly 8–12% of module value. The cost of demanding it pre-shipment is approximately 1% as a price premium.
4. Sequence orders inverter-first. As covered above, FEOC-clean inverters carry the longest lead time. Place inverter POs 16–20 weeks before commissioning, modules 8–10 weeks, BOS 4–6 weeks. Reverse the standard 2022 procurement sequence.
5. Run quoted system economics against current component pricing weekly. Module prices moved by 14% in Q2 2025 alone. A quote drafted on May 1 component costs and signed June 15 can be 10% under or over the actual landed cost. Use solar proposal software that ingests live component pricing rather than spreadsheet snapshots.
Contract Clauses That Matter in 2026
Three clauses, taken from procurement leaders at three different EPCs, deserve to be in every PO:
- Bill-of-lading payment trigger instead of full payment on invoice. Releases 70–85% on documented loading rather than 100% on invoice. Reduces counterparty solvency risk if the supplier enters restructuring between order and shipment.
- Force majeure carve-out for Red Sea / Suez routing. Specifies that supplier bears extra freight if vessel routing changes mid-shipment. Industry norm in 2024 was that buyer absorbed Red Sea surcharges. The norm shifted in 2025 toward shared responsibility; in 2026, shift it further toward the supplier.
- Independent inspection clause with named third-party. TÜV, SGS, or Bureau Veritas inspection on a 5% sample lot at the factory before shipment, paid by buyer at roughly $0.001/W. This catches QC issues — incorrect cell binning, mis-rated bypass diodes, glass batch defects — before modules cross the ocean.
For commercial and utility-scale projects where ROI math is sensitive to a 3–5% cost variance, running the project’s generation and financial tool with stress scenarios for 10% module price moves, 15% freight moves, and 8 weeks of delivery delay is the cheapest 30 minutes of risk mitigation in the entire process.
Geographic Hedging
In 2026, the geographic split of manufacturing makes hedging cheap. A US developer can pair a domestically-assembled module from Hanwha Qcells Georgia (FEOC-clean, IRA-bonus-eligible) with a Vietnamese or Thai backup from Trina or JA Solar (lower price, AD/CVD exposure). A European developer can pair a Chinese Tier 1 with a REC Group (Norway) or Meyer Burger (Germany) backup at a 25–35% price premium for the European-made volume. Indian developers benefit from PLI-incentivised domestic supply (Waaree, Adani, Reliance) plus Chinese imports through the ALMM-listed pathway. See our guide on Community Solar Projects Germany for more. See Community Solar Business Model for detailed guidance.
The geographic hedge no longer costs much in 2026 because oversupply has compressed the price differential between Tier 1 and Tier 2 origins.
Conclusion
The solar supply chain in 2026 is fundamentally a buyer’s market with hidden counterparty risk. Capacity is double demand. Polysilicon is cheap. Freight is normalised. But Chinese manufacturer solvency is wobbling, FEOC restrictions are tightening, and silver and tariff shocks are real. Three concrete action items for any installer, developer, or EPC reading this:
- Renegotiate any indexed module contract before Q3 2026. With polysilicon at a soft floor and silver rising, formulas linked to polysilicon spot are now a one-way bet against the buyer. Convert to 12-month fixed-price contracts at $0.085–$0.095/W FOB.
- Audit your top three suppliers’ FEOC and UFLPA documentation now. December 2027 EU Forced Labour Regulation enforcement and ongoing US IRA 45X requirements both demand documented chain of custody. Building it retroactively is 8–10× more expensive than demanding it pre-shipment.
- Sequence procurement inverter-first for any US IRA-eligible project. FEOC-clean inverter lead times of 16–20 weeks are the binding constraint on commissioning timelines, not module availability.
The companies that win in 2026 will not be the ones that buy the cheapest module. They will be the ones whose suppliers, freight contracts, and certification paperwork all still work in October 2026 when the next policy shock lands.
For procurement teams running live module cost scenarios, solar software with integrated component pricing and financial modeling removes the spreadsheet guesswork from every sourcing decision.
Frequently Asked Questions
What are the biggest solar supply chain trends 2026?
The biggest solar supply chain trends 2026 are structural oversupply rather than scarcity. Global module manufacturing capacity sits above 1,100 GW against roughly 650 GW of demand, polysilicon spot prices have fallen 84% from the 2022 peak, and modules ex-China sell at $0.08–$0.09 per watt. The shift in 2026 is from volume race to margin discipline, driven by China’s January 2026 removal of the 9% export VAT rebate and the US Section 232 polysilicon investigation.
Will there be a solar panel shortage in 2026?
No. A solar panel shortage in 2026 is unlikely at the global level. Wood Mackenzie projects 523 GWac of inverter shipments and BloombergNEF expects roughly 753 GW DC of module installations against more than 1,100 GW of manufacturing capacity. Regional bottlenecks exist for US buyers exposed to AD/CVD tariffs and for European buyers needing FEOC-compliant modules, but the wider 2026 market is oversupplied.
How much does it cost to ship a container of solar modules in 2026?
Shipping a 40HQ container of solar modules from China in early 2026 costs roughly $2,000–$2,800 to North Europe and around $2,100/FEU to the US West Coast on the Freightos Baltic Index. That works out to about $0.01 per watt on a 250 kW container load. Freight currently represents close to 4% of module landed cost, down from the 20% peak during the 2021–2022 pandemic spike.
Who controls the polysilicon supply chain in 2026?
China controls the polysilicon supply chain in 2026. Tongwei, GCL Tech, Daqo New Energy, and Xinte Energy together produce more than 80% of global polysilicon. Outside China, Wacker Chemie in Germany and OCI in Malaysia run the only meaningful non-Chinese capacity, and REC Silicon restarted Moses Lake in 2024 before idling it again in mid-2024 when offtake conditions weakened.
Are solar module prices going up or down in 2026?
Solar module prices are roughly flat to slightly up in 2026 after the 2023–2024 free fall. BloombergNEF tracks Chinese mainstream TOPCon module prices near $0.085 per watt. Silver paste cost increases, the removal of China’s 9% export rebate, and disciplined production cuts are putting a soft floor under prices for the first time in three years. US delivered prices remain $0.30–$0.45 per watt because of tariffs.
What is happening with US solar manufacturing capacity in 2026?
US solar module assembly capacity reached 65 GW by early 2026 according to SEIA, against roughly 40 GW of domestic demand. Cell capacity sits at 3.2 GW and wafer capacity near 5 GW, so most US modules still rely on imported cells. First Solar, Hanwha Qcells in Georgia, Silfab, and Heliene have led the build-out under the IRA Section 45X production credit, which now requires non-FEOC sourcing from 2026 onward.
How are shipping disruptions in the Red Sea affecting solar projects in 2026?
Red Sea diversions are still adding 10–21 days to Asia-Europe transit times in 2026 as carriers route around the Cape of Good Hope. The detour ties up vessel capacity and pushed Asia-Mediterranean rates 15% higher to roughly $3,850/FEU in late 2025. For installers running on incentive deadlines, the practical effect is two extra weeks of buffer stock and earlier purchase orders rather than absolute scarcity.
Which solar manufacturers will dominate the supply chain in 2026?
LONGi, JinkoSolar, JA Solar, Trina Solar, and Tongwei are still the top five integrated module manufacturers in 2026. Outside China, First Solar leads US thin-film, Hanwha Qcells leads US silicon assembly, Waaree and Adani lead India, and REC Group leads Europe. The big shift in 2026 is internal — top players are cutting capacity expansion plans and writing down upstream capacity for the first time in five years.
Further Reading
- Wood Mackenzie: China to hold over 80% of global solar manufacturing capacity 2023–26
- IEA Renewables 2024 — Electricity manufacturing supply chain
- PV Magazine: Wood Mackenzie predicts two-year decline in global solar inverter demand
- SEIA / Wood Mackenzie U.S. Solar Market Insight Q4 2025
- Freightos Baltic Index — container shipping cost benchmarks
- IEEFA: New paradigms of the global solar supply chain
For deeper reading on adjacent topics, see our analysis of European solar incentives, solar installation cost per kWp in Europe, and the solar market size by country.


