Solar modules, inverters, and mounting hardware account for 55–65% of total installed cost on a typical commercial solar project. For an EPC installing 10 MW annually, that translates to $3.5–$5.5 million in material spend. A 10% improvement in procurement economics — achievable through disciplined volume discount negotiation and vendor strategy — drops $350,000–$550,000 straight to gross margin. That is the difference between a profitable year and a break-even one.
This guide covers the full solar material procurement strategy for 2026. Whether you run a three-person residential installer or a 50-person commercial EPC, the frameworks here apply. We cover vendor evaluation, volume discount tiers, payment term leverage, supply chain risk management, and inventory optimization — with real numbers, original calculations, and specific vendor comparison data you can use immediately. See our guide on Agricultural Solar Case Study for more. See our guide on Floating Solar Farms France for more.
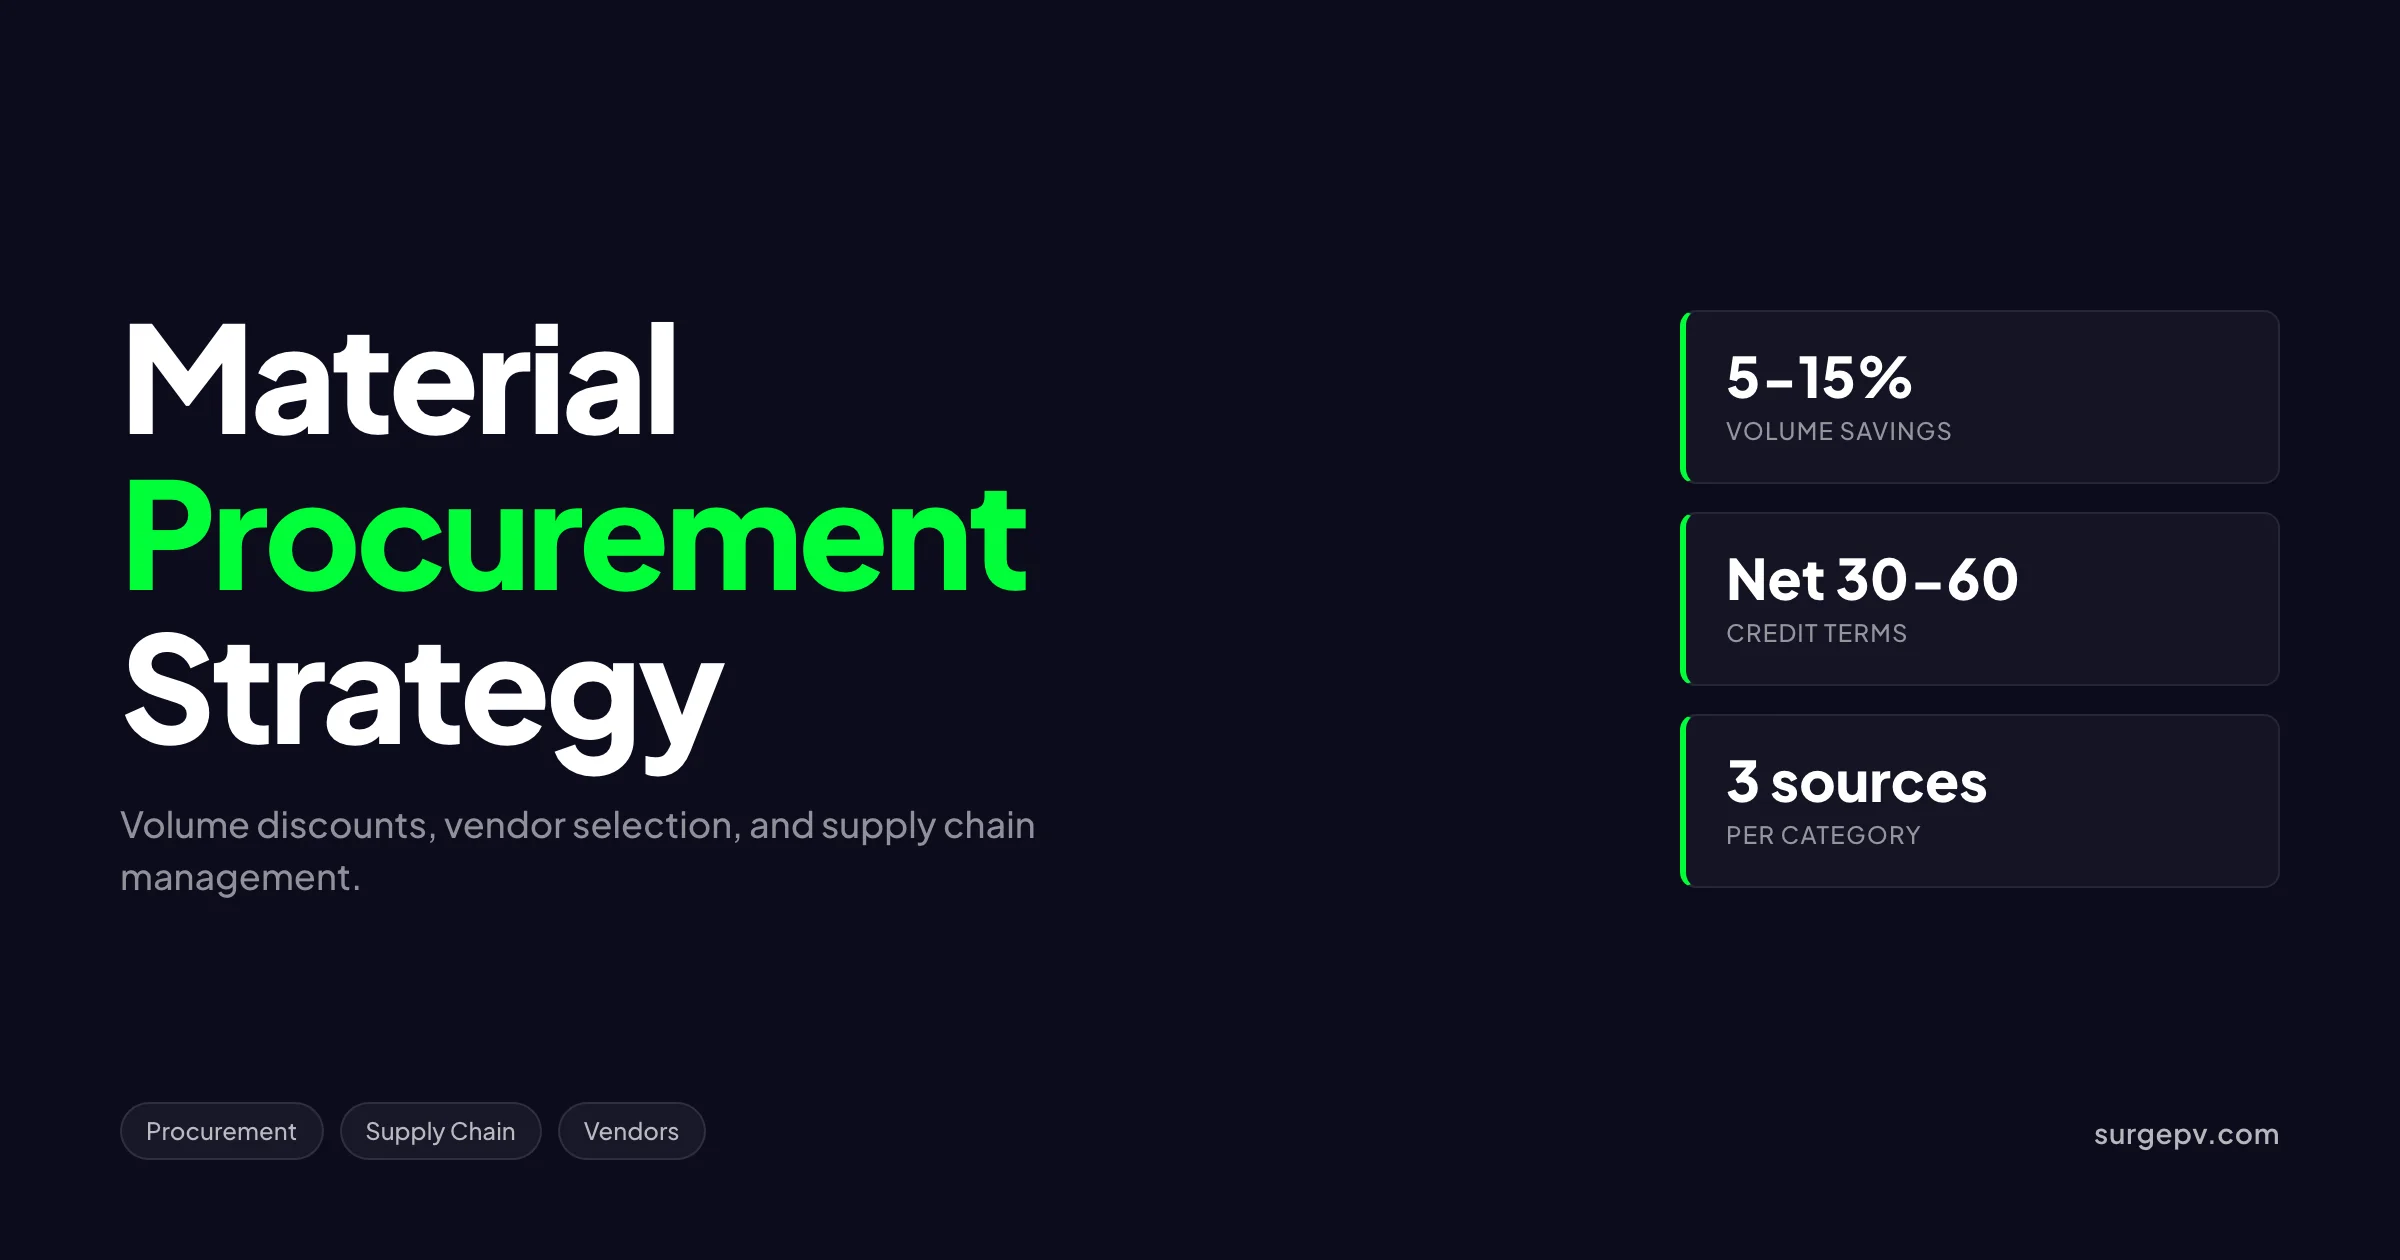
Quick Answer
Solar installers buying 2–5 MW annually can typically negotiate 8–12% below list price on modules and 10–15% on inverters. At 10+ MW, discounts reach 15–22% on modules and 18–25% on inverters. The key is structuring annual volume commitments with 2–3 primary vendors rather than spreading purchases thinly across many suppliers.
In this guide:
- Solar procurement fundamentals: what drives material costs and where the money goes
- Vendor evaluation framework: how to separate bankable suppliers from risky ones
- Volume discount tiers: exact pricing bands and negotiation tactics
- Payment terms and working capital: how to use cash flow as a bargaining tool
- Supply chain risk management: tariffs, shipping, and supplier insolvency
- Storage, handling, and inventory optimization
- What most solar companies get wrong about procurement
- FAQ
Solar Procurement Fundamentals: Where the Money Goes
Understanding solar material procurement starts with knowing the cost stack. Every dollar spent on a solar project breaks into specific categories, and each category has its own procurement dynamics.
The Solar Project Cost Stack
| Cost Category | Share of Total (Commercial) | Procurement Approach |
|---|---|---|
| Solar modules (panels) | 28–35% | Volume contract with 2–3 Tier 1 manufacturers |
| Inverters | 8–12% | Direct OEM or authorized distributor |
| Mounting and racking | 6–10% | Regional fabricator or national brand |
| Electrical (cabling, switchgear, combiners) | 5–8% | Distributor with mixed-SKU capability |
| Labor (installation) | 18–25% | Not a procurement item — subcontractor management |
| Permits, interconnection, soft costs | 12–18% | Regulatory, not procurement |
| Overhead, margin, contingency | 8–12% | Internal |
Modules dominate the material budget. Inverters are second. Together they represent 36–47% of total project cost. That concentration means procurement strategy should focus intensely on these two categories before optimizing the rest.
Why Module Prices Move
Module prices are the most volatile component in solar procurement. Between January 2022 and December 2024, monocrystalline PERC module prices at European ports swung from $0.28/W to $0.12/W — a 57% decline. Then in early 2025, anti-dumping investigations and tariff threats pushed prices back to $0.16–$0.18/W. Also see: European Solar Incentives.
The drivers behind these swings:
- Polysilicon supply: Polysilicon is 25–30% of module manufacturing cost. Capacity expansions in China added 800,000+ metric tonnes between 2022–2024, crashing polysilicon prices from $35/kg to $6/kg according to BloombergNEF, 2025.
- Cell and wafer capacity: China controls 85%+ of global cell and wafer production. Any disruption — COVID lockdowns, energy rationing, trade policy — ripples through global pricing within weeks.
- Trade policy: U.S. Section 201 and 301 tariffs, EU anti-subsidy investigations, and India’s ALMM list create price wedges between markets. A module shipped to Rotterdam costs less than the same module shipped to Los Angeles due to tariff differentials.
- Technology transition: The shift from PERC to TOPCon and heterojunction (HJT) cells creates temporary oversupply in legacy PERC capacity while new capacity ramps. Also see: Best Solar Design Software India.
Key Takeaway — Price Timing
Module prices in 2026 are stabilizing in the $0.10–$0.14/W range for standard monocrystalline modules at major European and Asian ports. This is near the cash cost of production for many manufacturers — meaning further significant declines are unlikely without technology breakthroughs or further capacity consolidation. Installers should plan procurement budgets at $0.12–$0.15/W all-in (including shipping, insurance, and duties) rather than betting on further price drops.
Inverter Procurement Dynamics
Inverters behave differently from modules. Prices are more stable — string inverter prices fell only 15–20% between 2022–2025 versus 50%+ for modules. The reason is structural: inverter manufacturing is less commoditized, with meaningful technology differentiation (power electronics topology, MPPT algorithms, grid support functions) and stronger brand loyalty.
Key inverter procurement considerations:
- String inverters (residential and small commercial): Prices range $0.04–$0.07/W. Lead times are typically 4–8 weeks. Volume discounts kick in at 500 kW+ annual purchases.
- Central inverters (utility-scale): Prices range $0.02–$0.04/W. Lead times are 12–20 weeks. These are almost always purchased direct from OEMs (Sungrow, Huawei, SMA, Power Electronics) with annual framework agreements.
- Power optimizers and microinverters: Premium products at $0.08–$0.15/W. Smaller volume discounts due to patent-protected technology and limited competition.
What Most Solar Companies Get Wrong About Procurement
The most common procurement mistake I see across solar companies — from $2M-revenue installers to $50M EPCs — is treating procurement as a purchasing function rather than a finance function. Purchasing asks “who has the lowest price today?” Finance asks “what is the total cost of ownership over the project life, including warranty risk, delivery reliability, and working capital impact?”
A module that costs $0.02/W less but ships 6 weeks late can destroy project margins through labor idle time, permit expiration, and customer penalty clauses. A vendor with weak warranty backing may save 3% upfront but cost 15% if module degradation exceeds warranted levels and the manufacturer is insolvent by year 12.
The right question is never “what is the cheapest price?” It is “what is the lowest-risk price that delivers the target margin?”
Vendor Evaluation: Separating Bankable Suppliers from Risky Ones
Not all solar suppliers are created equal. The vendor evaluation framework below is drawn from $100M+ in project finance structures where lender consent requires Tier 1 module status and investment-grade counterparty risk.
The Six-Dimension Vendor Scorecard
| Dimension | Weight | What to Check | Red Flags |
|---|---|---|---|
| Bankability | 25% | Bloomberg Tier 1 list, project finance track record, bankability reports from DNV or PI Berlin | Not on Tier 1 list; no utility-scale project references |
| Warranty strength | 20% | 25-year product + performance warranty; insured or escrow-backed; degradation curve | Warranty under 25 years; no third-party backing; vague degradation terms |
| Financial health | 20% | Debt-to-equity, operating cash flow, profitability last 3 years, cash position | Negative operating cash flow; debt-to-equity above 1.5; recent restructuring |
| Production capacity | 15% | Annual GW capacity, utilization rate, expansion plans | Utilization below 60%; announced capacity cuts; workforce reductions |
| Quality consistency | 15% | Flash test data, EL image standards, third-party factory audits | High Pmax variance between batches; frequent warranty claims; audit failures |
| Logistics capability | 5% | Shipping routes, warehouse network, customs handling experience | No local warehouse; reliance on single port; poor customs documentation |
A vendor scoring below 60% on this scorecard should not be a primary supplier for projects with external financing. They may serve as a secondary or spot-market source for smaller, self-financed installations.
Bloomberg Tier 1: What It Means and What It Does Not
BloombergNEF’s Tier 1 module ranking is the most widely referenced bankability metric in solar. It is also widely misunderstood.
What Tier 1 means: The manufacturer has supplied modules to six different projects that received non-recourse financing from six different banks in the past two years. That is it. It is a proxy for bank acceptance, not a quality certification.
What Tier 1 does not mean: It does not guarantee module quality, warranty honorability, or financial stability. A manufacturer can be Tier 1 today and insolvent tomorrow. The list is updated quarterly, and manufacturers do drop off.
As of Q1 2026, the Tier 1 list includes approximately 40–45 manufacturers. The top tier — those with consistent Tier 1 status for 5+ years and strong balance sheets — includes JinkoSolar, LONGi, Trina Solar, JA Solar, Canadian Solar, Risen Energy, and First Solar. For Canada-specific compliance details, see Canada comparisons/solar-design-software.
First-Hand Observation: The Warranty That Was Not There
In 2023, I reviewed a 25 MW project portfolio where the EPC had sourced modules from a Tier 1 manufacturer at an unusually aggressive $0.09/W. The price was 15% below the next competing bid. The EPC’s procurement director celebrated the savings.
Eighteen months later, that manufacturer filed for restructuring. Their 25-year performance warranty — which had no third-party insurance backing — became effectively worthless. The portfolio’s lender required a warranty replacement policy at $0.012/W — adding $300,000 in unplanned cost that erased the original “savings” and then some.
The lesson: always verify warranty backing. A warranty is only as good as the entity standing behind it. Insured or escrow-backed warranties from manufacturers with investment-grade credit ratings cost 1–2% more upfront. They are worth every cent.
Vendor Comparison: Tier 1 Manufacturers (2026)
| Manufacturer | HQ | Annual Capacity | Key Technology | Warranty Backing | Approx. Price ($/W, EU port) |
|---|---|---|---|---|---|
| JinkoSolar | China | 110 GW | TOPCon, N-type | Third-party insured | $0.10–$0.13 |
| LONGi | China | 95 GW | HPBC, N-type | Self + insurance | $0.11–$0.14 |
| Trina Solar | China | 85 GW | i-TOPCon, N-type | Third-party insured | $0.10–$0.13 |
| JA Solar | China | 80 GW | DeepBlue N-type | Self + insurance | $0.10–$0.13 |
| Canadian Solar | Canada/China | 55 GW | TOPCon, HJT | Third-party insured | $0.11–$0.14 |
| Risen Energy | China | 45 GW | Hyper-ion HJT | Self | $0.11–$0.14 |
| First Solar | USA | 28 GW | CdTe thin-film | Investment-grade | $0.18–$0.24 |
| Meyer Burger | Germany | 3 GW | HJT | Self | $0.22–$0.28 |
Prices are indicative for standard monocrystalline modules at European port, Q2 2026. Actual pricing depends on volume, specification, and contract terms. First Solar and Meyer Burger command premiums for domestic manufacturing and advanced technology.
Distributor vs. Direct: When to Use Each
| Factor | Distributor | Direct Manufacturer |
|---|---|---|
| Minimum volume | None — will sell single pallets | Typically 500 kW–1 MW per order |
| Pricing | 5–15% above direct OEM | Lowest unit cost |
| Credit terms | Net-30 to net-60 common | Cash in advance or LC for new relationships |
| Mixed-SKU orders | Yes — one order for modules, inverters, racking | No — modules only |
| Technical support | Moderate — generalist staff | High — direct access to product engineers |
| Warranty handling | Distributor facilitates | Direct with manufacturer |
| Stock availability | Local warehouse — faster delivery | Factory lead time — 6–12 weeks |
| Best for | Small installers (under 2 MW/year); mixed orders; credit needs | Large EPCs (5+ MW/year); standardized projects; price-sensitive bids |
Pro Tip
Hybrid procurement often works best: use direct manufacturer contracts for your core module and inverter volumes (where pricing matters most), and use distributors for electrical components, racking, and emergency spot orders (where flexibility and mixed-SKU convenience matter most). This gives you the price benefits of direct relationships without sacrificing operational flexibility.
Volume Discount Tiers: Exact Pricing and Negotiation Tactics
Volume discounts are the most direct lever for improving solar material procurement economics. But discount structures vary enormously by vendor, product, and market conditions. This section provides specific pricing bands and negotiation frameworks.
Module Volume Discount Structure
Module manufacturers typically structure discounts around annual volume commitments. The tiers below reflect 2026 market conditions for standard monocrystalline PERC/TOPCon modules from Tier 1 Chinese manufacturers at European port.
| Annual Volume | Discount vs. List | Approx. Price ($/W) | Typical Terms |
|---|---|---|---|
| Under 500 kW (spot) | 0–5% | $0.13–$0.16 | Cash in advance, immediate delivery |
| 500 kW – 2 MW | 5–10% | $0.12–$0.14 | 30% deposit, 70% against B/L |
| 2–5 MW | 10–15% | $0.11–$0.13 | Annual framework, quarterly call-offs |
| 5–10 MW | 15–20% | $0.10–$0.12 | Annual contract, monthly scheduling |
| 10–25 MW | 20–25% | $0.09–$0.11 | Multi-year framework, priority allocation |
| 25+ MW | 25–30%+ | Negotiated | Strategic partnership, custom specs |
List price assumed at $0.15/W for standard 550W+ monocrystalline modules. Premium products (bifacial, HJT, high-efficiency) carry 10–25% premiums above these base prices. See Bifacial Solar Panel Design Guide for detailed guidance.
Inverter Volume Discount Structure
Inverter discounts are typically steeper than module discounts at equivalent volumes because inverter manufacturing has higher fixed costs and manufacturers value predictable volume.
| Annual Volume | Discount vs. List | Approx. Price ($/W) | Typical Terms |
|---|---|---|---|
| Under 250 kW | 0–8% | $0.05–$0.07 | Distributor stock, net-30 |
| 250 kW – 1 MW | 8–15% | $0.04–$0.06 | Direct OEM, 50% deposit |
| 1–5 MW | 15–22% | $0.035–$0.05 | Annual contract, quarterly delivery |
| 5–15 MW | 22–28% | $0.03–$0.045 | Framework agreement, dedicated support |
| 15+ MW | 28–35% | $0.025–$0.04 | Strategic account, custom firmware options |
Prices for string inverters. Central inverters for utility-scale projects follow different pricing — typically $0.02–$0.035/W with project-specific negotiations.
Original Calculation: The True Value of Volume Commitment
Consider an EPC installing 8 MW annually. Here is the math on procurement strategy:
Scenario A: Spot purchasing, no volume commitment
- Module cost: $0.145/W × 8,000,000 W = $1,160,000
- Inverter cost: $0.055/W × 8,000,000 W = $440,000
- Total material spend: $1,600,000
Scenario B: Annual framework with 2 module vendors + 1 inverter OEM
- Module cost: $0.115/W × 8,000,000 W = $920,000
- Inverter cost: $0.038/W × 8,000,000 W = $304,000
- Total material spend: $1,224,000
Annual savings: $376,000
On a typical commercial EPC gross margin of 12–18%, that $376,000 savings represents a 25–40% improvement in absolute gross profit. This is not a marginal optimization. It is a business-transforming difference.
Negotiation Tactics That Work
1. Lead with annual volume, not per-project volume.
Manufacturers care about predictable annual volume, not individual project size. An EPC doing ten 1-MW projects is more attractive than one doing a single 10-MW project — because the annual commitment is the same, but the revenue is more predictable and the relationship stickier.
2. Offer multi-year commitments in exchange for price floors.
In volatile markets, manufacturers fear price collapse as much as buyers fear price spikes. A two-year contract with a price floor (e.g., no lower than $0.10/W) and a price ceiling (e.g., no higher than $0.13/W) gives both parties certainty. Manufacturers will often accept lower average pricing in exchange for volume certainty.
3. Bundle module and inverter purchases.
Some manufacturers (JinkoSolar, LONGi) have inverter partnerships or captive inverter divisions. Bundling module and inverter volume can unlock additional 2–4% discounts beyond individual product negotiations.
4. Time orders for manufacturer quarter-end or year-end.
Manufacturers have quarterly and annual sales targets. Orders placed in the final 2–3 weeks of a quarter often secure extra 1–3% discounts as sales teams chase targets. This is especially effective in Q4.
5. Accept longer lead times for better pricing.
If your project pipeline is predictable, accept 10–12 week factory lead times instead of demanding 4-week distributor stock. The pricing difference is typically 5–8%.
Pro Tip
Never negotiate on price alone. Always negotiate the total package: price, payment terms, warranty terms, lead time, and allocation priority. A vendor who will not budge on price may offer net-60 payment terms or extended warranty coverage instead — both of which have real financial value. Document every concession and its dollar value to compare offers on an apples-to-apples basis.
The Misconception: Bigger Is Always Cheaper
Many procurement managers assume that doubling volume always doubles discounts. It does not. Discount curves flatten above 10–15 MW annually. The marginal discount from 10 MW to 20 MW is typically 2–4%, not the 8–12% you see from 1 MW to 5 MW. For more on this topic, see Design Commercial Solar System 1MW.
The reason is manufacturing cost structure. Module manufacturing has high fixed costs (equipment, facilities) but relatively low marginal cost per watt once capacity is running. The first few megawatts of volume commitment help a manufacturer cover fixed costs. Beyond that, additional volume is nice but not structurally transformative to their economics.
Smart procurement means concentrating volume to reach the steepest part of the discount curve — typically 2–10 MW annually — rather than chasing diminishing returns at 20+ MW. If you install 25 MW, splitting across 3 vendors at 8 MW each often yields better total pricing than putting all 25 MW with one vendor.
Payment Terms and Working Capital: Using Cash Flow as a Bargaining Tool
Payment terms are the most underutilized lever in solar procurement. A 2% price discount for cash-in-advance sounds small until you multiply it across $2M in annual material spend. Net-60 terms from a distributor sound convenient until you calculate the 2.5% financing premium baked into their pricing.
Payment Term Structures in Solar Procurement
| Term Structure | Typical Discount | When to Use | Risk Level |
|---|---|---|---|
| Cash in advance (CIA) | +2–4% vs. net-30 | Strong cash position; lowest price priority | High — no recourse if supplier fails |
| Letter of credit (LC) | +1–2% vs. net-30 | International orders; new supplier relationships | Low — bank guarantees payment |
| 30% deposit, 70% against B/L | Baseline | Standard for direct manufacturer orders | Medium — deposit at risk |
| Net-30 | Baseline (distributor) | Established distributor relationships | Low — standard commercial terms |
| Net-60 | −1.5–3% vs. net-30 | Cash-constrained periods | Low — but implicit financing cost |
| Supplier financing / extended terms | −2–5% vs. cash | Rapid growth phases; working capital constraints | Low — but locks pricing |
The Working Capital Math
Working capital is the cash tied up in inventory and receivables. For solar EPCs, material procurement is the largest working capital sink.
Example: 8 MW EPC, $1.2M annual module spend
| Scenario | Payment Terms | Inventory Days | Working Capital Tied Up | Annual Financing Cost (at 8%) |
|---|---|---|---|---|
| Cash in advance, 8-week lead time | 100% upfront | 56 days | $184,000 | $14,700 |
| 30% deposit, 70% against B/L | 30% at order, 70% at shipment | 42 days | $138,000 | $11,000 |
| Net-30 distributor | Pay 30 days after delivery | 30 days | $99,000 | $7,900 |
| Net-60 distributor | Pay 60 days after delivery | 15 days* | $49,000 | $3,900 |
Assumes 45-day inventory turn — material arrives, is installed, and project is billed within 45 days. Net-60 payment means you collect from the customer before paying the supplier.
The net-60 distributor scenario ties up $135,000 less working capital than cash-in-advance. At 8% financing cost, that saves $10,800 annually in carrying cost. But the distributor’s pricing is typically 3–5% higher than direct manufacturer pricing — so on $1.2M spend, you pay $36,000–$60,000 more for materials to save $10,800 in financing. The math only works if you are genuinely capital-constrained.
Letters of Credit: Protection with a Cost
A letter of credit (LC) is a bank guarantee that the supplier will be paid if they meet delivery and documentation requirements. LCs are standard for international solar module purchases.
How an LC works:
- Your bank issues an LC in favor of the supplier, backed by your credit line or cash collateral
- The supplier ships modules and presents shipping documents (bill of lading, packing list, certificate of origin) to their bank
- If documents comply with LC terms, the supplier’s bank claims payment from your bank
- Your bank pays the supplier and debits your account (or draws on your credit line)
LC costs: 1–2% of LC value annually, plus amendment fees ($100–$300 per change). For a $500,000 module order, expect $5,000–$10,000 in LC fees.
When LCs are essential:
- First-time purchases from a new international supplier
- Large orders (over $250,000) where supplier default would be catastrophic
- Jurisdictions with weak contract enforcement
When LCs are unnecessary overhead:
- Repeat purchases from established Tier 1 manufacturers
- Domestic purchases with strong legal recourse
- Small orders where LC fees represent an excessive percentage of order value
Key Takeaway — Payment Term Strategy
Match payment terms to your cash position and risk tolerance. Cash-rich companies should negotiate cash-in-advance discounts — the 2–4% savings on material spend almost always exceed the opportunity cost of cash. Cash-constrained growing companies should use distributor net-30 or net-60 terms despite the pricing premium — the working capital preservation enables faster growth. Never use cash-in-advance with unproven suppliers, regardless of discount.
Supply Chain Risk Management: Tariffs, Shipping, and Supplier Insolvency
Solar procurement in 2026 carries material risks that can erase margins overnight. The companies that survive supply chain shocks are those that build risk management into procurement strategy, not those that react after the fact.
The Four Primary Supply Chain Risks
| Risk | Probability (2026) | Financial Impact | Mitigation |
|---|---|---|---|
| Module price volatility | High | ±15–25% on material budget | Annual framework contracts with price collars |
| Supplier insolvency | Medium | Warranty void; replacement cost 10–20% of project value | Tier 1 only; insured warranties; diversify across 3+ vendors |
| Shipping delays | Medium-High | Labor idle time; permit expiration; customer penalties | 4–6 week buffer inventory; air freight contingency budget |
| Tariff/policy changes | Medium | +5–20% on landed cost | Multi-country sourcing; local manufacturing options |
Tariff Exposure and Multi-Country Sourcing
Trade policy is the most unpredictable risk in solar procurement. The U.S. has maintained Section 201 tariffs (14.25% on modules) and Section 301 tariffs (25% on Chinese cells and modules). The EU imposed provisional anti-dumping duties on Chinese EVA film and investigated solar glass in 2024–2025. India maintains its ALMM list, restricting eligible module suppliers. For the latest details on India, see 5kW Solar Panel Price in India.
Tariff impact on module landed cost (2026):
| Market | Tariff/Policy | Effective Premium vs. Global Spot |
|---|---|---|
| USA | Section 201 (14.25%) + Section 301 (25%) + AD/CVD risk | +35–50% |
| EU | Anti-subsidy investigations; CBAM preparation | +5–10% |
| India | ALMM list; BCD (25% basic customs duty) | +25–35% |
| Southeast Asia | Generally duty-free for intra-ASEAN | Baseline |
| Middle East | Generally low tariffs | Baseline to +5% |
For EPCs operating across multiple markets, multi-country sourcing is essential. A module legal for the U.S. market (e.g., First Solar domestic production, or Southeast Asian-origin cells assembled in non-Chinese jurisdictions) may cost 30% more than an identical Chinese-origin module. But shipping the Chinese module to the U.S. triggers tariffs that make it more expensive than the compliant alternative.
Original calculation — tariff arbitrage risk:
An EPC I advised in 2024 tried to save $180,000 by shipping Chinese modules through a third-country transshipment point to avoid U.S. tariffs. U.S. Customs and Border Protection identified the scheme through bill-of-lading analysis. The result: retroactive tariff assessment of $420,000 plus a $85,000 penalty. The “savings” became a $505,000 loss.
Transshipment to evade tariffs is not a procurement strategy. It is a compliance violation with criminal liability in some jurisdictions.
Shipping and Logistics Risk
Ocean freight for solar modules runs $0.005–$0.015/W depending on route and container rates. That is small relative to module value. But shipping delays are costly in ways that exceed the freight bill.
A 6-week shipping delay on a 2-MW commercial project can cost:
- Labor idle time (crew scheduled but unable to work): $8,000–$15,000
- Equipment rental extension (crane, lift): $3,000–$7,000
- Permit expiration/re-application (in some jurisdictions): $2,000–$5,000
- Customer delay penalties (if contract includes liquidated damages): $5,000–$20,000
- Total potential delay cost: $18,000–$47,000
Against this, maintaining 4–6 weeks of buffer inventory costs approximately $8,000–$12,000 in annual carrying cost for a 2-MW project pipeline. Buffer inventory pays for itself if it prevents even one significant delay per year.
Supplier Insolvency: Early Warning Signs
Module manufacturer insolvencies are not theoretical. Suntech Power (once the world’s largest) defaulted in 2013. Hanergy Thin Film collapsed in 2015. More recently, several mid-tier Chinese manufacturers have restructured or exited.
Early warning signs to monitor:
- Delayed warranty claim payments (stretching from 30 days to 90+ days)
- Reduction in R&D spending or patent filings
- Workforce reductions at production facilities
- Downgrades from credit rating agencies or trade credit insurers
- Increasing reliance on spot sales versus contract volumes
- Changes in payment terms demanded (shifting from net-30 to cash-in-advance)
Monitor these signals quarterly for all primary suppliers. The 30 minutes spent reviewing financial statements and trade references can prevent a $500,000 warranty exposure.
Pro Tip — Supplier Monitoring Routine
Set a quarterly calendar reminder to review: (1) Bloomberg Tier 1 status changes; (2) Manufacturer financial statements (public companies file quarterly); (3) Trade credit insurance reports (Coface, Euler Hermes); and (4) Industry forums and LinkedIn for workforce rumors. If two or more warning signs appear for a primary supplier, initiate contingency sourcing immediately — do not wait for formal insolvency.
Storage, Handling, and Inventory Optimization
Procurement does not end when modules arrive. How you store, handle, and manage inventory directly affects material quality, warranty validity, and working capital efficiency.
Module Storage Requirements
Solar modules are more fragile in storage than most installers assume. Improper storage voids warranties and causes latent defects that appear years later.
| Parameter | Requirement | Consequence of Violation |
|---|---|---|
| Temperature | −40°C to +85°C (operating); storage ideally 10–30°C | High temperatures accelerate EVA yellowing and solder bond degradation |
| Humidity | Under 85% RH | Moisture ingress risks junction box corrosion and PID |
| Stacking | Maximum 12–15 pallets high (check manufacturer spec) | Excessive stack weight cracks glass or deforms frames |
| Orientation | Store flat on pallets; never lean against walls | Leaning creates point-load stress that micro-cracks cells |
| Handling | Use module clamps or two-person lift; never carry by frame corners | Frame bending causes cell cracks invisible to naked eye |
| UV exposure | Minimize direct sun exposure during staging | Pre-installation UV exposure is unnecessary and risks hot spots |
Inventory Turn Targets
Inventory turnover measures how quickly material moves from receipt to installation. Higher turnover means less working capital tied up and lower risk of price obsolescence.
| Business Type | Target Inventory Turn | Average Days in Inventory | Carrying Cost (% of inventory value annually) |
|---|---|---|---|
| Residential installer (under 1 MW/year) | 8–12x | 30–45 days | 10–12% |
| Small commercial EPC (1–5 MW/year) | 6–10x | 36–60 days | 8–10% |
| Mid-size EPC (5–20 MW/year) | 6–8x | 45–60 days | 8–10% |
| Large EPC/utility developer (20+ MW/year) | 4–6x | 60–90 days | 6–8% |
Larger companies turn inventory more slowly because they hold buffer stock and purchase in bulk for project pipelines. Smaller companies can turn faster because they buy closer to need.
The Tradeoff: Buffer Stock vs. Working Capital
Every week of buffer inventory reduces delay risk but increases carrying cost. The optimal buffer depends on your supply chain reliability and project pipeline predictability.
Calculation: Optimal buffer for a 5-MW annual EPC
- Weekly module consumption: 5,000,000 W ÷ 52 weeks = 96,000 W/week
- Module cost: $0.12/W
- Weekly material value: $11,520
- Carrying cost: 10% annually = 0.19% per week
| Buffer Weeks | Inventory Value | Annual Carrying Cost | Delay Risk Reduction |
|---|---|---|---|
| 2 weeks | $23,040 | $2,300 | Minimal — exposed to most disruptions |
| 4 weeks | $46,080 | $4,600 | Moderate — covers shipping delays |
| 6 weeks | $69,120 | $6,900 | Good — covers most supplier disruptions |
| 8 weeks | $92,160 | $9,200 | High — covers extended factory shutdowns |
| 12 weeks | $138,240 | $13,800 | Very high — but excessive capital tie-up |
For most mid-size EPCs, 4–6 weeks of module buffer and 2–3 weeks of inverter buffer strikes the right balance. Inverters have shorter lead times and less price volatility, so they need less buffer.
Handling Damage: The Hidden Cost
Industry data suggests 0.5–2% of modules arrive with handling damage (micro-cracks, frame deformation, junction box issues) even from reputable manufacturers. For a 5-MW project at 550W per module, that is 9,091 modules — and 45–180 potentially damaged units.
Best practices for receiving inspection:
- Inspect every pallet for visible shipping damage before signing the bill of lading
- Flash-test a statistical sample (5–10% of pallets) for power output verification
- Photograph any damage and notify supplier within 24 hours
- Do not install modules with visible defects — warranty claims on installed modules are harder to process
- Keep damaged modules segregated and labeled until supplier disposition
Streamline Solar Project Planning from Design to Procurement
SurgePV’s solar design software generates accurate bill-of-materials from every project design — module counts, inverter specs, cabling lengths, and mounting quantities. Export directly to your procurement team and eliminate manual BOM errors that cause costly last-minute orders.
Book a DemoNo commitment required · 20 minutes · Live project walkthrough
What Most Solar Companies Get Wrong: A Contrarian View
The conventional wisdom in solar procurement is simple: buy cheap, buy in bulk, negotiate hard. This wisdom is wrong in three important ways.
Mistake 1: Chasing Lowest Price per Watt
The procurement manager who buys modules at $0.10/W instead of $0.12/W saves $20,000 per MW. If those modules degrade at 0.8% annually instead of 0.4%, the owner loses approximately $8,000 per MW in year 10 and $16,000 per MW in year 20. Over 25 years, the “cheaper” modules cost $120,000 more per MW in lost production.
Price per watt is a terrible metric for procurement decisions. The right metric is levelized cost of ownership: purchase price plus financing cost plus expected degradation cost plus warranty replacement risk, divided by lifetime production.
Mistake 2: Treating Procurement as a Sourcing Problem, Not a Design Problem
The most powerful procurement optimization is not negotiating harder. It is designing projects that need less material. A solar design software platform that optimizes string configuration, minimizes cable runs, and right-sizes inverters can reduce material cost by 3–8% before any vendor negotiation begins.
An EPC I worked with in Spain reduced their typical commercial project BOM cost by 6.2% simply by standardizing on a single module wattage (550W) and a single inverter size (100 kW). The standardization enabled larger volume commitments, reduced design time, and cut installation errors. Procurement optimization started in the design room, not the vendor meeting. Also see: Spain net metering.
Mistake 3: Ignoring the Warranty as a Financial Instrument
A 25-year performance warranty is not a customer service gesture. It is a financial instrument with a present value. For a 1-MW system, a guaranteed 80% output at year 25 (versus 70% for a weaker warranty) is worth approximately $25,000–$35,000 in present value at a 6% discount rate.
Yet most procurement scorecards give warranty terms a 5% weight while giving price a 40% weight. Reverse those priorities for projects with external financing or long-term ownership. The warranty is often worth more than the price difference.
Narrative Fragment: The Call at 11 PM
I remember an 11 PM call in March 2022. A client had 4 MW of modules sitting at the Port of Rotterdam. The vessel had arrived. The containers were on the dock. But the customs broker had filed the wrong HS code — classifying the modules as “electrical generators” instead of “photovoltaic cells” — triggering a 12% duty instead of the applicable 0% under the EU’s renewable energy tariff schedule.
The customs hold cost $3,200 per day in demurrage. The project had a fixed interconnection date 6 weeks away. The installer crew was scheduled. The crane was rented.
We resolved it in 72 hours with a customs attorney and amended filing. But the lesson stuck: procurement includes logistics, customs, and documentation. A $0.001/W savings in module price is meaningless if a paperwork error costs $15,000 in demurrage and delay penalties.
Solar Procurement Strategy 2026: Market Outlook
The solar procurement environment in 2026 is shaped by four structural trends that every buyer should factor into strategy.
Trend 1: Module Oversupply Persists
Global module manufacturing capacity exceeds 1,100 GW annually. Global demand in 2026 is estimated at 550–650 GW. That oversupply keeps pricing pressure on manufacturers and favors buyers with volume. For Global-specific compliance details, see Global net-metering-by-country.
However, the oversupply is concentrated in standard PERC and basic TOPCon products. Premium products — HJT, bifacial with tracking-optimized framing, agri-PV compatible modules — have tighter supply and less pricing pressure.
Trend 2: Domestic Manufacturing Incentives Reshape Sourcing
The U.S. Inflation Reduction Act’s 45X manufacturing credit ($0.07/W for domestic module production) has spurred 30+ GW of announced U.S. module factory capacity. The EU’s Net-Zero Industry Act proposes similar incentives. By 2027–2028, domestic manufacturing may be cost-competitive with imports in key markets — changing the optimal sourcing strategy for projects in those markets.
Trend 3: Technology Transition Creates Temporary Bargains
The shift from P-type PERC to N-type TOPCon and HJT is accelerating. Legacy PERC capacity is being sold at distressed prices as manufacturers clear inventory. For projects where efficiency is not critical (large ground-mount with ample land), buying high-quality PERC modules at clearance pricing can deliver excellent value in 2026.
Trend 4: Supply Chain Regionalization
Geopolitical tensions are driving supply chain regionalization. Chinese manufacturers are building factories in Southeast Asia, the Middle East, and Turkey to serve markets with China-specific tariffs or restrictions. This creates new sourcing options but also new complexity — quality consistency across factories varies, and warranty enforcement across jurisdictions is harder.
2026 Procurement Recommendations by Company Size
| Company Size | Annual Volume | Recommended Strategy |
|---|---|---|
| Small installer (under 1 MW) | Under $150K material | Distributor relationships; focus on service and mixed-SKU convenience; accept 5–10% pricing premium for flexibility |
| Growing installer (1–5 MW) | $150K–$750K | One direct module contract + one distributor relationship; negotiate annual framework at 2–5 MW commitment |
| Mid-size EPC (5–20 MW) | $750K–$3M | Two direct module vendors + one direct inverter OEM; annual volume contracts with quarterly call-offs; 4–6 week buffer inventory |
| Large EPC (20–50 MW) | $3M–$8M | Strategic partnerships with 2–3 Tier 1 manufacturers; multi-year frameworks; dedicated account management; custom spec capability |
| Utility developer (50+ MW) | $8M+ | Direct OEM relationships with factory visits; project-specific procurement; integrated EPC and procurement functions |
Conclusion
Solar material procurement is not about finding the lowest price. It is about building a sourcing system that delivers the right materials, at the right price, at the right time, with the right risk profile.
The numbers are clear. An 8-MW EPC moving from spot purchasing to structured volume contracts saves $300,000–$400,000 annually. A small installer using distributor relationships instead of chasing manufacturer direct pricing preserves the flexibility that lets them bid opportunistically on projects. A utility developer with insured warranties and multi-vendor diversification sleeps better than one with all their material risk concentrated in a single supplier.
Three actions for your solar procurement strategy in 2026:
1. Audit your current vendor base against the six-dimension scorecard. Score every primary supplier on bankability, warranty strength, financial health, production capacity, quality consistency, and logistics. Any supplier scoring below 60% should be demoted to secondary status or replaced.
2. Structure annual volume commitments with 2–3 primary vendors. Do not spread purchases thinly. Concentrate volume to reach the steepest part of the discount curve — typically 2–10 MW annually per vendor. Negotiate total package terms, not just price.
3. Build 4–6 weeks of buffer inventory and a formal supplier monitoring routine. The next supply chain disruption is not a question of if but when. Buffer inventory and early warning monitoring are cheap insurance against expensive delays.
For solar companies looking to integrate procurement with project design and financial modeling, solar design software that generates accurate BOMs and connects to procurement workflows eliminates the manual handoffs that cause errors. And for commercial project financial analysis, a generation and financial tool that models material cost sensitivity helps you understand exactly how procurement decisions affect project returns.
Frequently Asked Questions
What is a solar material procurement strategy?
A solar material procurement strategy is a structured approach to sourcing panels, inverters, mounting systems, and electrical components at optimal cost, quality, and delivery timelines. It covers vendor selection, volume discount negotiation, payment terms, inventory management, and supply chain risk mitigation. A well-designed procurement strategy can reduce material costs by 10–20% while improving delivery reliability and warranty security.
How much can solar installers save with volume discounts?
Solar installers typically save 8–22% on module costs and 12–18% on inverter costs through volume discount tiers. A mid-size EPC purchasing 5–10 MW annually can reduce total material spend by $0.03–$0.06 per watt compared to spot-market purchasing. On a 10-MW annual volume, that translates to $300,000–$600,000 in annual savings.
What are the main risks in solar material procurement?
The main risks are price volatility (module prices swung ±40% between 2022–2024), supplier insolvency, shipping delays, tariff exposure, and quality defects. Diversifying across 3–4 primary vendors and maintaining 4–6 weeks of buffer inventory mitigates most risks. Trade credit insurance and insured warranties provide additional protection against supplier default.
Should small installers buy from distributors or manufacturers directly?
Installers below 2 MW annual volume should use distributors for flexibility, credit terms, and mixed-SKU orders. Distributors charge 5–15% more than direct OEM pricing but offer net-30 to net-60 terms, local stock, and technical support. Above 5 MW annual volume, direct manufacturer relationships unlock better pricing, custom specs, and priority allocation during supply crunches.
How do payment terms affect solar procurement costs?
Payment terms materially affect costs. Cash-in-advance typically yields 2–4% discounts versus net-30. Letters of credit add 1–2% in bank fees but protect against supplier default. Net-60 terms from distributors often carry a 1.5–3% implicit financing premium baked into pricing. The optimal payment structure depends on your cash position: cash-rich companies should take cash discounts; cash-constrained companies should prioritize working capital preservation.
What inventory levels should solar EPCs maintain?
EPCs should maintain 4–6 weeks of buffer inventory for standard components (modules, inverters, racking) and 8–12 weeks for long-lead items (transformers, switchgear). Carrying costs run 8–12% annually, so inventory should turn 6–10 times per year. Buffer inventory pays for itself if it prevents even one significant project delay annually.
How do you evaluate a solar panel supplier?
Evaluate suppliers on: (1) bankability — Bloomberg Tier 1 status and project finance track record; (2) warranty strength — 25-year product and performance warranty with insured backing; (3) production capacity and allocation reliability; (4) flash test data consistency across batches; (5) shipping and logistics capability; and (6) financial health — debt ratios, profitability, and cash position. Any supplier scoring below 60% on a balanced scorecard should not be a primary source for financed projects.
What is the difference between spot buying and contract buying for solar materials?
Spot buying means purchasing at current market prices with immediate delivery — flexible but exposed to price swings. Contract buying locks in prices and volumes for 6–24 months through a purchase agreement — stable but requires volume commitments and may miss price declines. Most professional EPCs use a hybrid: annual contracts for 60–80% of predictable volume (core modules and inverters), with spot purchasing for the remainder (emergency orders, specification changes, opportunistic bargains).
Related SurgePV Resources
Continue learning with these related guides for solar installers and EPCs:
- Solar Inventory Management
- Cash Flow Management for Solar Installers
- Co-Marketing With Solar Manufacturers
- Solar Fleet Management
- Solar Company Overhead Reduction
For more solar business and marketing content, explore the full SurgePV blog or browse the SurgePV glossary for definitions of solar industry terms. For a direct comparison, see Arka 360 vs SurgePV.
Solar Software Tools to Support This Work
Effective solar installer operations depend on integrated software. SurgePV’s solar design platform helps installers handle the upstream work that feeds every decision in this guide:
- Solar design software for system layouts, panel placement, and BOM generation
- Shadow analysis for site-specific irradiance and obstruction modeling
- Generation and financial tool for production forecasts and project ROI
- Solar proposal software for branded, customer-facing proposals
- Clara AI for automated design assistance and Q&A
Browse the full SurgePV platform to see how installers across 50+ countries use the tools to design smarter, sell faster, and streamline every solar project.


