Quick Answer
Solar payback periods by country in 2026: Germany 7–10 years, Italy 5–8 years, Spain 5–8 years, France 7–11 years, UK 8–12 years, India 4–6 years, Australia 3–5 years, US 6–10 years. Lowest payback occurs in high-irradiance, high-electricity-price markets with strong incentives.
A solar system in Dubai pays back in under 4 years. The same technology installed in Norway may take 25. That 6x difference in return timeline is not about the equipment — it is about three variables: how much sun the location receives, what electricity costs, and how much the installation cost in the first place. This guide covers the solar payback period for residential systems in 30+ countries, with specific year ranges, the calculation behind each figure, and practical guidance for solar professionals using payback data in client proposals.
Solar payback periods by country in 2026: Germany 7–10 years, Italy 5–8 years, Spain 5–8 years, France 7–11 years, UK 8–12 years, India 4–6 years, Australia 3–5 years, US 6–10 years. Lowest payback occurs in high-irradiance, high-electricity-price markets with strong incentives. Also see: solar panel ROI in Italy. Also see: Germany solar subsidies. Also see: France solar feed-in tariffs. Also see: Spain net metering. Also see: Best Solar Design Software India.
See also: solar payback period by country.
TL;DR — Solar Payback Period by Country
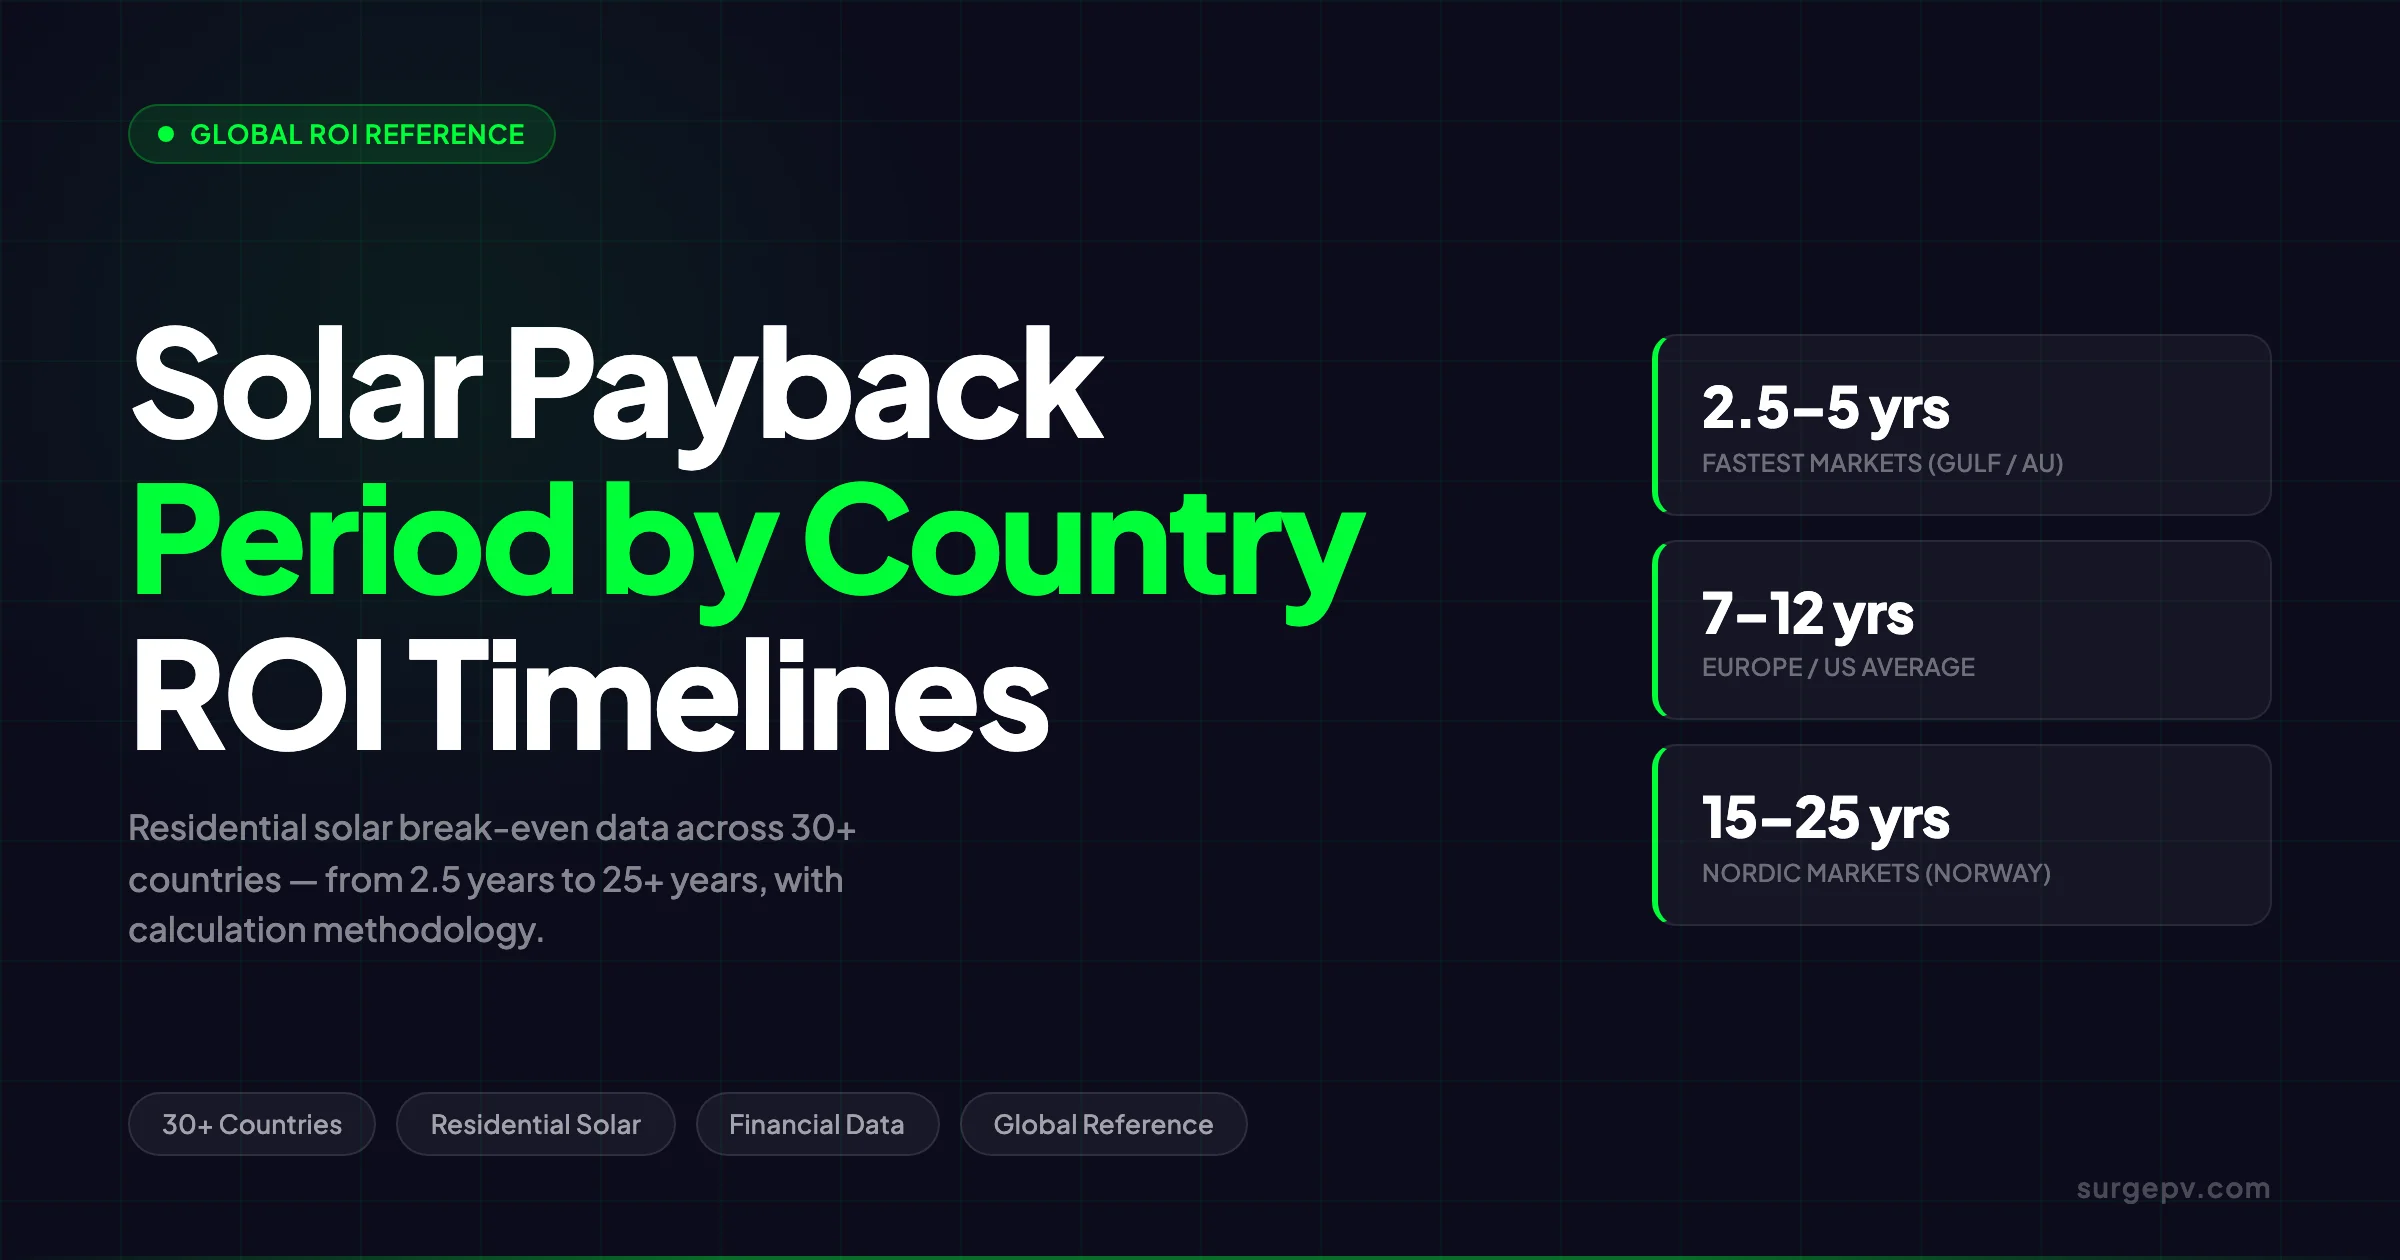
Global residential payback ranges from 2.5 years (UAE/Gulf) to 25+ years (Norway). Australia and southern Spain sit at 3–6 years. Germany and the UK average 8–12 years. The US average extended to 8–12 years after the federal residential ITC expired at end of 2025. The main drivers are electricity price, solar irradiance, and installation cost — not panel technology.
For the latest details on UK, see Battery Solar System Design UK. For Australia-specific compliance details, see Australia comparisons/lgc-vs-stc.
What this guide covers:
- A global reference table covering 30+ countries with residential payback period ranges
- The calculation formula and four variables that determine every payback figure
- Regional deep-dives: why fast markets are fast and slow markets are slow
- How subsidies, VAT relief, and feed-in tariffs shift the timeline
- When to use IRR and NPV instead of simple payback for project decisions
- How solar professionals use payback data effectively in client proposals
Global Solar Payback Period Reference Table
The table below covers residential rooftop solar (typically 5–10 kWp) without battery storage. All figures assume 100% system ownership (no PPA or lease) and represent weighted averages across the country — regional variation within each country can be significant. See Adding Battery Storage Services for detailed guidance.
| Country | Payback Period | Key Driver |
|---|---|---|
| UAE (Dubai) | 2.5–4 years | Very high irradiance (2,200 kWh/m²), DEWA net metering |
| Saudi Arabia | 3–5 years | High irradiance (2,100 kWh/m²), expanding net metering |
| Australia | 3–6 years | STC rebates, high retail electricity prices (AUD 0.28–0.35/kWh) |
| India (top states) | 3–6 years | PM Surya Ghar 40% subsidy, 1,700 kWh/m² in most regions |
| Morocco | 4–6 years | High irradiance (1,800–2,200 kWh/m²), rising electricity prices |
| Spain (Andalusia) | 3–5 years | 1,800–2,000 kWh/m², 10% VAT reduction, competitive install costs |
| Spain (national avg) | 5–7 years | Weighted for north/south variation |
| Portugal | 5–7 years | Low install costs, good irradiance, E-Redes net metering |
| Greece | 5–8 years | High irradiance (1,600–1,900 kWh/m²), net metering framework |
| Italy | 5–8 years | Post-Superbonus adjustment, good irradiance, Transizione 5.0 incentives |
| Brazil | 5–8 years | High irradiance, rapidly growing ANEEL net metering market |
| Mexico | 5–8 years | Good irradiance, growing CFE net metering access |
| South Africa | 5–7 years | High electricity prices post load-shedding crisis (R 3.50–4.50/kWh) |
| Chile | 5–8 years | High irradiance (Atacama region 2,400 kWh/m²), expanding net billing |
| USA (Hawaii) | 4–6 years | Highest US electricity prices, strong irradiance |
| USA (California) | 6–8 years | High electricity prices, NEM 3.0 reduced export credit |
| USA (New England) | 7–9 years | Moderate irradiance, high electricity prices |
| USA (national avg) | 8–12 years | Post-federal ITC expiry (Dec 2025), varies widely by state |
| USA (Texas / Midwest) | 9–13 years | Moderate electricity prices, variable incentives |
| Netherlands | 6–9 years | High electricity prices offset low irradiance |
| Belgium | 7–11 years | Complex regulations, moderate irradiance |
| Austria | 7–10 years | EAG incentive scheme, good central European irradiance |
| Germany | 8–12 years | 0% VAT, EEG tariffs, but lower irradiance (1,000–1,200 kWh/m²) |
| Poland | 7–10 years | Mój Prąd subsidies, 8% VAT, rising electricity prices |
| Czech Republic | 7–10 years | Nová Zelená Úsporám grants, similar to Poland |
| Japan | 8–12 years | High electricity price (JPY 35/kWh) but high install cost and declining FIT |
| South Korea | 8–12 years | RPS-based incentives, moderate irradiance |
| France | 8–13 years | High install costs, moderate irradiance, CONSUEL complexity |
| United Kingdom | 9–14 years | 0% VAT, Smart Export Guarantee, but low irradiance (800–1,100 kWh/m²) |
| Switzerland | 10–15 years | Very high install costs (CHF 1,700–2,400/kWp) |
| Sweden | 12–18 years | High install costs, low electricity prices (hydro) |
| Denmark | 12–18 years | High install costs, moderate electricity prices |
| Finland | 10–15 years | Improving installer market, short installation season |
| Norway | 15–25 years | Cheapest electricity in Europe (€0.10–0.14/kWh, mainly hydro) |
All figures: residential rooftop, 5–10 kWp, no battery storage, no lease/PPA. Sources: Solar Data Atlas 2025–2026, Fraunhofer ISE 2025, IRENA Cost Database, national energy authority data.
Key Takeaway: The Range Is 10x
From 2.5 years in the UAE to 25+ years in Norway, the global range is wider than most buyers or installers expect. The tech is identical. The difference is entirely economic: electricity price, irradiance, and install cost determine the outcome — not the brand of panel on the roof.
How Solar Payback Period Is Calculated
The payback period is the simplest possible financial metric: how many years until your energy savings match what you spent upfront.
Formula:
Simple Payback (years) = Net System Cost (after incentives)
                         ─────────────────────────────────────────────
                         Annual Financial Benefit (€ or $ per year)
Annual Financial Benefit has two components:
- Self-consumption savings = Annual kWh generated × Self-consumption rate × Retail electricity price
- Export revenue = Annual kWh generated × Export rate × Feed-in tariff (or SEG rate)
Full formula:
Annual Benefit = (kWh/year × Self-consumption%) × Electricity Rate
               + (kWh/year × Export%) × Feed-in Tariff
Example: 10 kWp System in Germany vs Spain
| Variable | Germany | Spain (Seville) |
|---|---|---|
| System cost | €14,000 | €12,000 |
| Incentives | 0% VAT | 10% VAT relief on lower base |
| Net cost | €14,000 | €12,000 |
| Annual yield | 10,500 kWh | 15,000 kWh |
| Self-consumption rate | 70% | 75% |
| Electricity price | €0.33/kWh | €0.27/kWh |
| Export rate (FIT) | €0.08/kWh | €0.07/kWh |
| Annual self-consumption saving | €2,425 | €3,038 |
| Annual export revenue | €252 | €263 |
| Total annual benefit | €2,677 | €3,301 |
| Simple payback | 5.2 years | 3.6 years |
This example shows why Spain consistently outperforms Germany: higher irradiance drives 43% more annual output per kWp, which more than offsets the lower per-kWh electricity price.
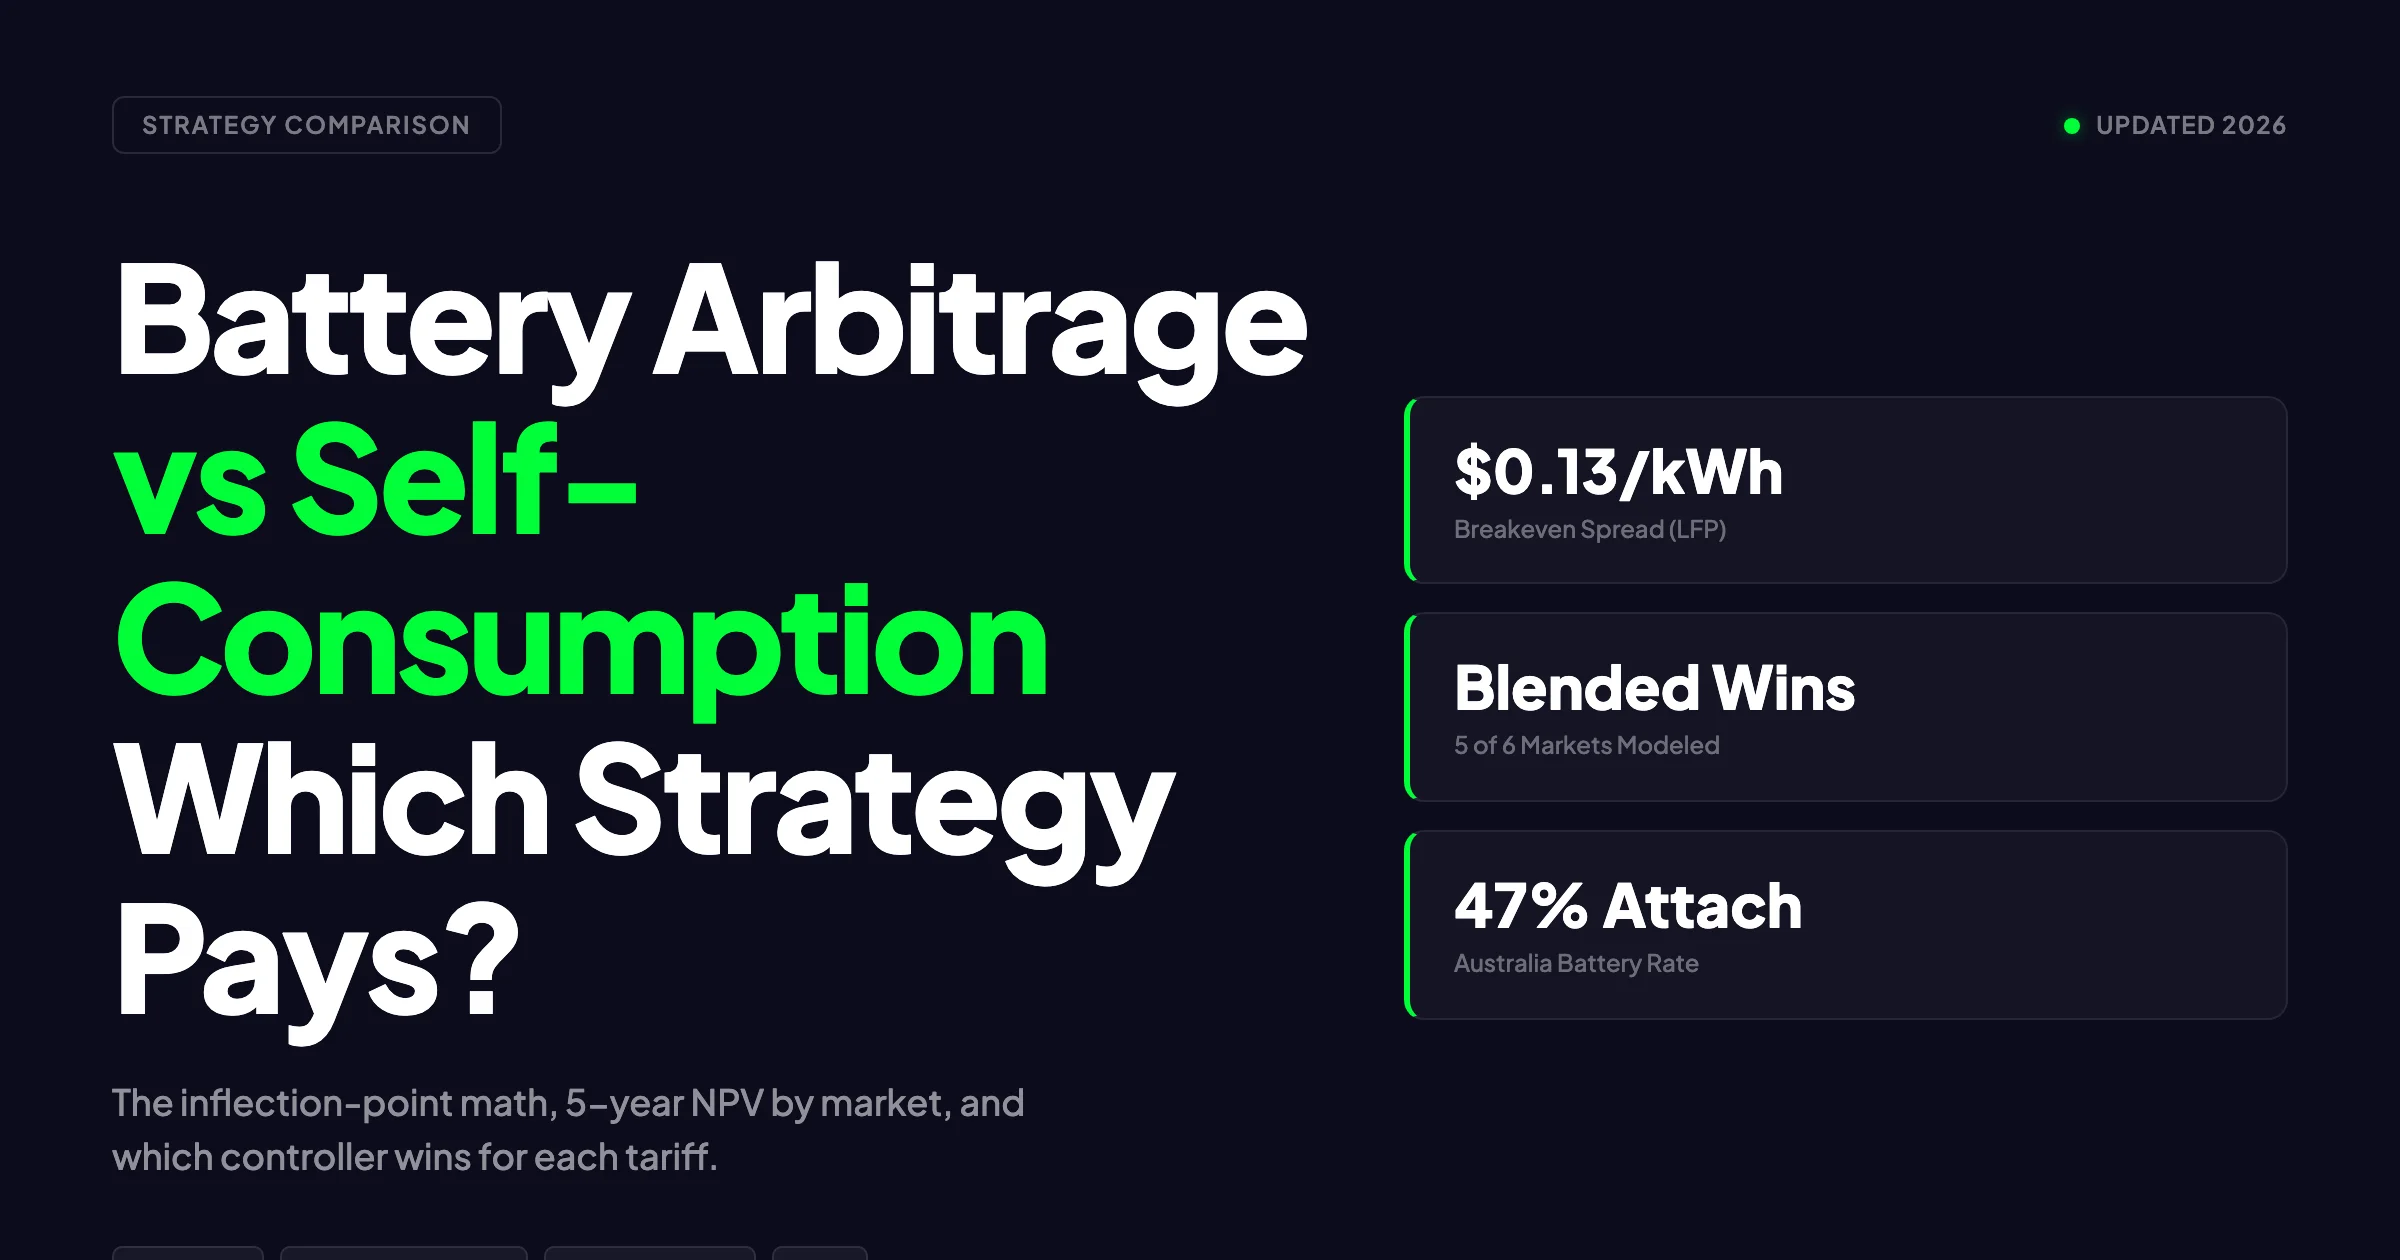
Pro Tip: Self-Consumption Rate Changes Everything
A household using 40% of its solar output vs 70% can see payback extend by 2–4 years. Every percentage point of self-consumption is worth more than export, because self-consumption saves at full retail price (€0.25–0.38/kWh) while export earns only the FIT rate (€0.05–0.15/kWh in most markets). This is why load-shifting, battery storage, and EV charging during daylight hours improve project ROI so substantially.
Fastest-Payback Markets: Under 5 Years
Gulf Region (UAE, Saudi Arabia, Qatar)
The UAE offers the world’s most favourable combination of solar economics for residential systems. Dubai receives 2,200 kWh/m² of annual irradiance — nearly double Germany’s 1,100 kWh/m². DEWA’s net metering scheme lets homeowners export excess generation at retail rate credits. Residential system costs have fallen to approximately AED 9,000–13,000 per kWp (€2,200–3,200), and DEWA electricity prices of AED 0.38/kWh (€0.094/kWh) for higher consumption tiers, combined with high self-consumption on air conditioning loads, produce payback periods of 2.5–4 years.
Saudi Arabia is on a similar trajectory. The Saudi Vision 2030 plan includes a residential solar programme with 40% CAPEX subsidies for eligible homeowners. With 2,100 kWh/m² of irradiance and residential electricity prices that have risen significantly since 2016 tariff reforms, Saudi Arabia now produces payback periods of 3–5 years in most regions.
Australia
Australia’s residential solar market is one of the most financially efficient in the world at 3–6 years average payback. Three factors combine:
- STC rebates: The Small-Scale Technology Certificate scheme reduces upfront system cost by AUD 2,000–4,000 for a typical 6.6 kWp system
- High retail electricity prices: AUD 0.28–0.35/kWh in most states, among the world’s highest
- Good irradiance: 1,600–2,200 kWh/m² depending on state (Queensland and Western Australia at the higher end, Victoria and Tasmania lower)
Queensland and Western Australia see payback as short as 3 years for a well-sized system. Victoria and Tasmania range from 4–7 years.
India
India’s residential solar market achieved a step-change in 2024 with the PM Surya Ghar: Muft Bijli Yojana programme, which provides subsidies of 40% for systems up to 3 kWp. This single policy change brought effective payback periods for eligible households down to 3–5 years in states like Rajasthan, Gujarat, and Maharashtra — all of which receive 1,700–2,200 kWh/m² of annual irradiance.
For more details, see our guide on 5kW solar panel price in India.
Without the subsidy, residential payback periods in India sit at 5–8 years, still competitive because electricity prices in many states have risen to INR 8–12/kWh (€0.09–0.14/kWh) for residential consumers above basic consumption tiers.
Southern Spain (Andalusia and Mediterranean Coast)
Spain’s Andalusia region — particularly Seville, Málaga, and Almería — represents Europe’s fastest-payback solar market. Annual irradiance of 1,800–2,050 kWh/m², reduced 10% VAT on solar, and a competitive installer market produce payback periods of 3–5 years. Northern Spain (Galicia, Asturias) sits at 6–9 years, highlighting how much within-country variation matters.
Strong Markets: 5–8 Years
Southern Europe (Portugal, Greece, Italy)
Portugal achieves 5–7 years payback, combining competitive installation costs (€1,000–1,400/kWp), solid irradiance of 1,600–1,900 kWh/m², and electricity prices around €0.22–0.28/kWh. The E-Redes streamlined registration process means projects move quickly from quote to commission, which reduces overhead and keeps final installed prices competitive.
Greece produces 5–8 years payback in most of the country, with Crete and the Aegean islands at the faster end (4–6 years). High irradiance (1,600–1,900 kWh/m²), residential electricity prices of €0.22–0.30/kWh, and the government’s virtual net metering framework all support strong returns.
Italy currently sits at 5–8 years for most residential systems post-Superbonus. Irradiance in Sicily and Puglia reaches 1,700–1,900 kWh/m²; Rome and central Italy 1,500–1,700 kWh/m²; Milan and the north 1,200–1,500 kWh/m². The Transizione 5.0 scheme offers 45–65% tax credits for qualifying energy efficiency projects, which can bring payback periods to under 4 years for eligible industrial installations. For a detailed analysis of Italian solar ROI, see Solar Panel ROI in Italy. See our guide on Commercial Rooftop Solar Case Study Italy for more.
Latin America (Brazil, Mexico, Chile)
Brazil produces payback periods of 5–8 years across most regions. The Amazon basin and northeast receive 1,700–2,100 kWh/m² annually. Brazil’s ANEEL net metering system allows full retail-rate credit for exported energy — one of the most generous net metering frameworks in South America. Residential electricity prices of BRL 0.80–1.10/kWh (€0.14–0.20/kWh) and a competitive installer market support strong returns.
Chile is unique globally: the Atacama Desert region receives 2,400 kWh/m² of annual irradiance — the highest in the world. For residential systems in northern Chile, payback periods of 4–6 years are achievable. Santiago and central Chile produce more typical 6–9 year returns.
Mexico achieves 5–8 years payback in most urban markets. CFE electricity prices have risen significantly in recent years, and residential net metering (GDMTH tariff category) allows excess energy banking. Irradiance across much of Mexico reaches 1,600–2,200 kWh/m².
USA: Regional Variation
The USA has wide variation. The federal residential solar ITC (26–30%) expired on December 31, 2025, extending average payback periods by approximately 2–3 years for most homeowners relative to 2024 figures.
| US State/Region | Payback Period (2026) | Key Factors |
|---|---|---|
| Hawaii | 4–6 years | Highest US electricity prices (~$0.37/kWh), strong irradiance |
| California | 6–8 years | High electricity prices, NEM 3.0 reduces export value |
| Massachusetts / Connecticut | 7–9 years | SMART programme, high electricity prices |
| New York | 7–9 years | NY-Sun incentive, high Con Ed / NYSEG rates |
| New Jersey | 7–9 years | SREC II programme, high electricity prices |
| Arizona / Nevada | 7–10 years | High irradiance, moderate electricity prices |
| Florida | 8–11 years | Good irradiance, moderate electricity prices, no state income tax offset |
| Texas | 9–13 years | Low electricity prices in many areas, no state ITC equivalent |
| Oregon / Washington | 10–14 years | Low electricity prices from hydro, good state incentives |
The US average of 8–12 years reflects the post-ITC era. States with their own incentive programmes (Massachusetts, New York, New Jersey) partially offset the federal credit expiry. For a detailed breakdown, see Solar IRA Tax Credits US Guide.
Japan and South Korea
Japan produces residential payback periods of 8–12 years. Electricity prices of JPY 35/kWh (approximately €0.22/kWh) are high enough to support good self-consumption economics. However, the residential FIT rate dropped to JPY 15/kWh in 2025 — down sharply from JPY 48/kWh a decade ago — reducing export revenue substantially. Japanese system costs remain elevated at JPY 250,000–350,000/kWp (€1,550–2,200/kWp). Self-consumption rates of 60–75% are the key to achieving payback under 10 years in Japan.
Tokyo’s April 2025 regulation requiring solar panels on all newly built houses signals that residential solar will expand rapidly, with higher installation volumes likely to drive costs down over the next 3–5 years.
South Korea sits at 8–12 years. The RPS (Renewable Portfolio Standard) system provides RECs for residential producers, improving economics somewhat, but high installation costs (KRW 1.2–1.8M/kW, approximately €820–1,220/kWp) and moderate irradiance (1,200–1,400 kWh/m²) keep payback timelines in the 8-year-plus range for most homes.
Challenging Markets: 9+ Years
Central and Western Europe
Germany achieves 8–12 years average payback for residential systems in 2026. Despite 0% VAT on solar equipment and 20-year EEG feed-in tariff guarantees at €0.08–0.12/kWh, Germany’s lower annual irradiance (950–1,200 kWh/m² depending on region) is the binding constraint. Bavaria and Baden-Württemberg in the south see payback of 8–9 years; Hamburg and Berlin in the north sit at 10–12 years.
France achieves 8–13 years payback. Installation costs of €1,500–2,200/kWp are the highest in major Western European markets, driven by CONSUEL certification requirements, complex Enedis grid connection processes, and higher labour rates. Electricity prices of €0.22–0.26/kWh are not high enough to compensate. Regions in the south (Occitanie, PACA) achieve 7–9 years; northern France and Brittany can exceed 12 years. Read more about Agricultural Solar Case Study.
Netherlands sits at 6–9 years, performing better than its German and French neighbours despite comparable irradiance (950–1,150 kWh/m²). The key advantage is high retail electricity prices (€0.30–0.38/kWh), which deliver stronger per-kWh savings and partially offset the lower annual yield.
UK produces payback periods of 9–14 years. The Smart Export Guarantee (SEG) pays only £0.04–0.15/kWh for exported generation — far below retail price. With annual irradiance of only 800–1,100 kWh/m² and export rates capped low, UK solar economics depend almost entirely on self-consumption savings. Households that consume their solar output directly at peak times (EV charging, heat pump operation) achieve payback under 10 years; those that export a large share fall toward 12–14 years.
Key Takeaway: Germany vs France
Germany and France have similar irradiance levels (both lower than Southern Europe), but Germany’s payback period is consistently 2–3 years shorter. The difference is installation cost: Germany averages €1,200–€1,800/kWp vs France’s €1,500–€2,200/kWp. Germany’s 0% VAT policy and a more competitive installer market are the structural advantages. France’s CONSUEL certification adds €300–€800 to every project and several months of delay.
Nordic Countries
The Nordic markets illustrate an extreme case of low electricity prices limiting solar ROI.
Norway is the most challenging residential solar market in Europe, with payback periods of 15–25 years. Norway generates ~96% of its electricity from hydropower, resulting in residential electricity prices of only €0.10–0.14/kWh. With installation costs of €1,600–2,200/kWp and annual irradiance of 800–1,100 kWh/m², the annual savings per kWp are simply too small to justify the investment on financial grounds alone. Many Norwegian installations are driven by energy independence goals rather than financial return.
Sweden produces payback periods of 12–18 years. Swedish electricity prices are moderate at €0.13–0.18/kWh and variable (Sweden has four electricity price areas with significant north-south difference). Installation costs of €1,400–2,000/kWp and irradiance of 900–1,100 kWh/m² produce a challenging financial case. The Rot-avdraget tax deduction (reducing labour costs by 30%) helps modestly, but payback remains long.
Denmark achieves 12–18 years. Despite having among Europe’s highest residential electricity prices in gross terms (before taxes and network charges: ~€0.40–0.50/kWh all-in), the subsidy structure means the marginal avoided cost from solar is lower than the gross price suggests. Grid tariffs and charges remain payable even for self-consumed solar output in some utility contracts.
Finland produces payback of 10–15 years in most of the country, with southern Finland at the shorter end. Finland’s installer base has improved significantly since 2020, reducing installation costs relative to Norway and Sweden.
The 5 Factors That Determine Solar Payback Period
Factor 1: Solar Irradiance (Annual kWh/m²)
Irradiance determines how much energy a system produces per kWp of installed capacity. This is the single largest differentiator between countries:
| Irradiance Level | kWh/m²/year | Representative Markets |
|---|---|---|
| Very High | 1,900–2,400 | UAE, Saudi Arabia, Atacama (Chile), Australian outback |
| High | 1,600–1,900 | Spain, Portugal, Morocco, Southern Italy, Greece, Queensland |
| Moderate | 1,200–1,600 | Central/Northern Italy, France (south), California, Japan |
| Low | 900–1,200 | Germany, Netherlands, UK (south), Poland, Czech Republic |
| Very Low | 700–900 | UK (north), Norway, Finland, Iceland |
A system in Spain generates roughly 1,500 kWh per kWp per year. The same system in the UK generates around 950 kWh per kWp. Over 25 years, that 58% difference in yield translates directly to a 58% difference in lifetime energy savings.
For yield modelling on any specific site, solar shadow analysis software that integrates local irradiance datasets provides far more accurate forecasts than country-average figures.
Factor 2: Retail Electricity Price
Higher electricity prices mean greater savings per kWh of self-consumed solar output. This is why the Netherlands (€0.35/kWh) achieves faster payback than Germany (€0.32/kWh) despite comparable irradiance, and why Japan (€0.22/kWh) outperforms many markets with better irradiance.
The relationship is direct: doubling the electricity price halves the payback period, everything else being equal. In markets where electricity prices are rising fast (UK, Netherlands, Australia, South Africa), the payback period as calculated at the time of installation will shorten over time — the system’s financial performance improves as grid electricity gets more expensive. For Africa-specific compliance details, see Africa solar compliance.
Factor 3: Installation Cost per kWp
Installation cost is the numerator in the payback formula. A 30% reduction in installation cost produces a 30% shorter payback period. This is why Eastern European markets like Poland and Romania, despite having lower irradiance than Southern Europe, achieve competitive payback periods — their lower installation costs (€900–1,300/kWp residential) partially offset the lower annual yield.
Installation costs also explain part of the Australia vs UK divergence. Both countries have relatively low annual irradiance compared to Southern Europe (1,200–1,600 kWh/m² for most of Australia, 800–1,100 kWh/m² for the UK). Yet Australia achieves 3–6 year payback and the UK achieves 9–14 years. The critical difference: Australian system costs run AUD 1,000–1,400/kWp (approximately €600–900/kWp at current exchange rates) — roughly 40% cheaper than UK installations. Combined with higher electricity prices and slightly better irradiance in most Australian cities vs most UK cities, Australia’s economics are dramatically better.
For a full country-level breakdown of installation costs, see Solar Installation Cost per kWp by European Country.
Factor 4: Subsidies and Incentives
Government incentives directly reduce net system cost, shortening payback proportionally:
| Incentive Type | Effect on Payback | Examples |
|---|---|---|
| Capital grant (20–40% of cost) | Reduces payback by 20–40% | Australia STC, India PM Surya Ghar |
| Tax credit (30%) | Reduces payback by ~30% | US residential ITC (expired 2025), Italy Superbonus |
| VAT exemption | Reduces payback by VAT % | Germany (0%), UK (0%) |
| Accelerated depreciation | Reduces commercial payback 3–5 years | Italy, Spain |
| 0% loan/low-interest | Reduces financing cost | Germany KfW, Netherlands SVn |
For country-specific incentives, see European Solar Incentives and Solar Subsidies Europe 2026 Tracker.
Factor 5: Self-Consumption Rate
The self-consumption rate — the percentage of solar output consumed directly by the building — determines what price applies to your solar savings. Self-consumed kWh saves at the full retail electricity price; exported kWh earns only the feed-in tariff (almost always lower, often much lower).
| Self-Consumption Rate | Typical Setup | Impact on Payback |
|---|---|---|
| 30–40% | No time-shifting, low daytime consumption | Longer payback; most output exported at low FIT rate |
| 50–65% | Standard residential consumption profile | Baseline calculation |
| 70–85% | EV charging, load time-shifting, or battery storage | 15–25% shorter payback than 50% scenario |
| 85–100% | Full battery + EV + heat pump + smart HEMS | Minimum payback, but battery CAPEX offsets gain |
The difference between 40% and 75% self-consumption on a 10 kWp system in Germany is approximately €800/year in additional savings — which translates to roughly 1.5–2 years off the payback period.
Model Payback for Any Country in Minutes
SurgePV’s generation and financial tool calculates payback, IRR, and lifetime savings for any project — enter your country’s electricity tariff, irradiance data, and installation cost to get an accurate ROI projection.
Book a DemoNo commitment required · 20 minutes · Live project walkthrough
For a direct comparison, see Arka 360 vs SurgePV.
How Subsidies and Feed-In Tariffs Shift the Timeline
Subsidies and feed-in tariffs affect payback in different ways, and understanding the difference matters for how you model client proposals.
Capital Grants and Tax Credits
Capital grants reduce the net cost before the payback calculation begins. A 40% grant on a €14,000 German system reduces net cost to €8,400 — shortening payback from 11 years to 6.6 years. This is the most powerful form of incentive: it directly compresses the timeline proportionally.
The US federal ITC worked this way. Its expiry at end of 2025 added approximately 2–3 years to US average residential payback periods, because the 30% tax credit had been reducing net system cost by €3,000–€5,000 per residential installation.
Feed-In Tariffs
Feed-in tariffs affect the revenue side of the payback formula, not the cost side. They are beneficial but less powerful than capital grants, because they only apply to the fraction of output that is exported.
A key insight: a feed-in tariff of €0.12/kWh vs €0.06/kWh (2x difference) only improves the payback period by 10–15% for a typical residential system where 65–70% of output is self-consumed. The export portion is simply too small to be the deciding factor.
Markets with net metering at full retail rate (Brazil, parts of the USA before NEM 3.0, Thailand) treat exported energy as if it were self-consumed — effectively paying full retail price for 100% of output. This is financially equivalent to 100% self-consumption and produces the best possible payback periods for a given installation cost and irradiance level.
VAT Reduction
VAT directly affects installation cost, so it has a clean proportional effect on payback. Germany’s 0% solar VAT (since 2023) reduced residential system costs by approximately €1,800–€2,800 on a typical 8–12 kWp system. The UK’s 0% VAT (since 2022) produces a similar cost reduction.
For markets where solar VAT is 21–24% (Netherlands, Finland, Sweden), removing or reducing VAT would have a larger impact on payback than many feed-in tariff improvements, because the cost effect is direct and front-loaded rather than distributed over 20+ years of operation.
For a full VAT comparison, see Solar VAT Rates in Europe.
Payback Period vs IRR vs NPV: Which Metric Matters Most
Simple payback period is the right metric for residential customers explaining solar to their neighbours. It is the wrong metric for commercial investment decisions.
When Payback Period Is Sufficient
- Residential sales: homeowners understand “your system pays for itself in 9 years”
- Comparing two residential proposals with similar system sizes
- Quick screening of whether a market is worth entering
When IRR and NPV Are Required
- Commercial and utility-scale projects
- When comparing systems with different lifetimes or escalation profiles
- When the customer has a financing cost or opportunity cost to consider
- When the electricity price is expected to escalate (which it almost always is)
The IRR captures what payback misses: A system with a 9-year payback but 25-year lifetime generates 16 years of profit after payback. A system with a 7-year payback but 15-year warranty generates only 8 years of profit. The second system has a shorter payback but a lower IRR and lower lifetime NPV.
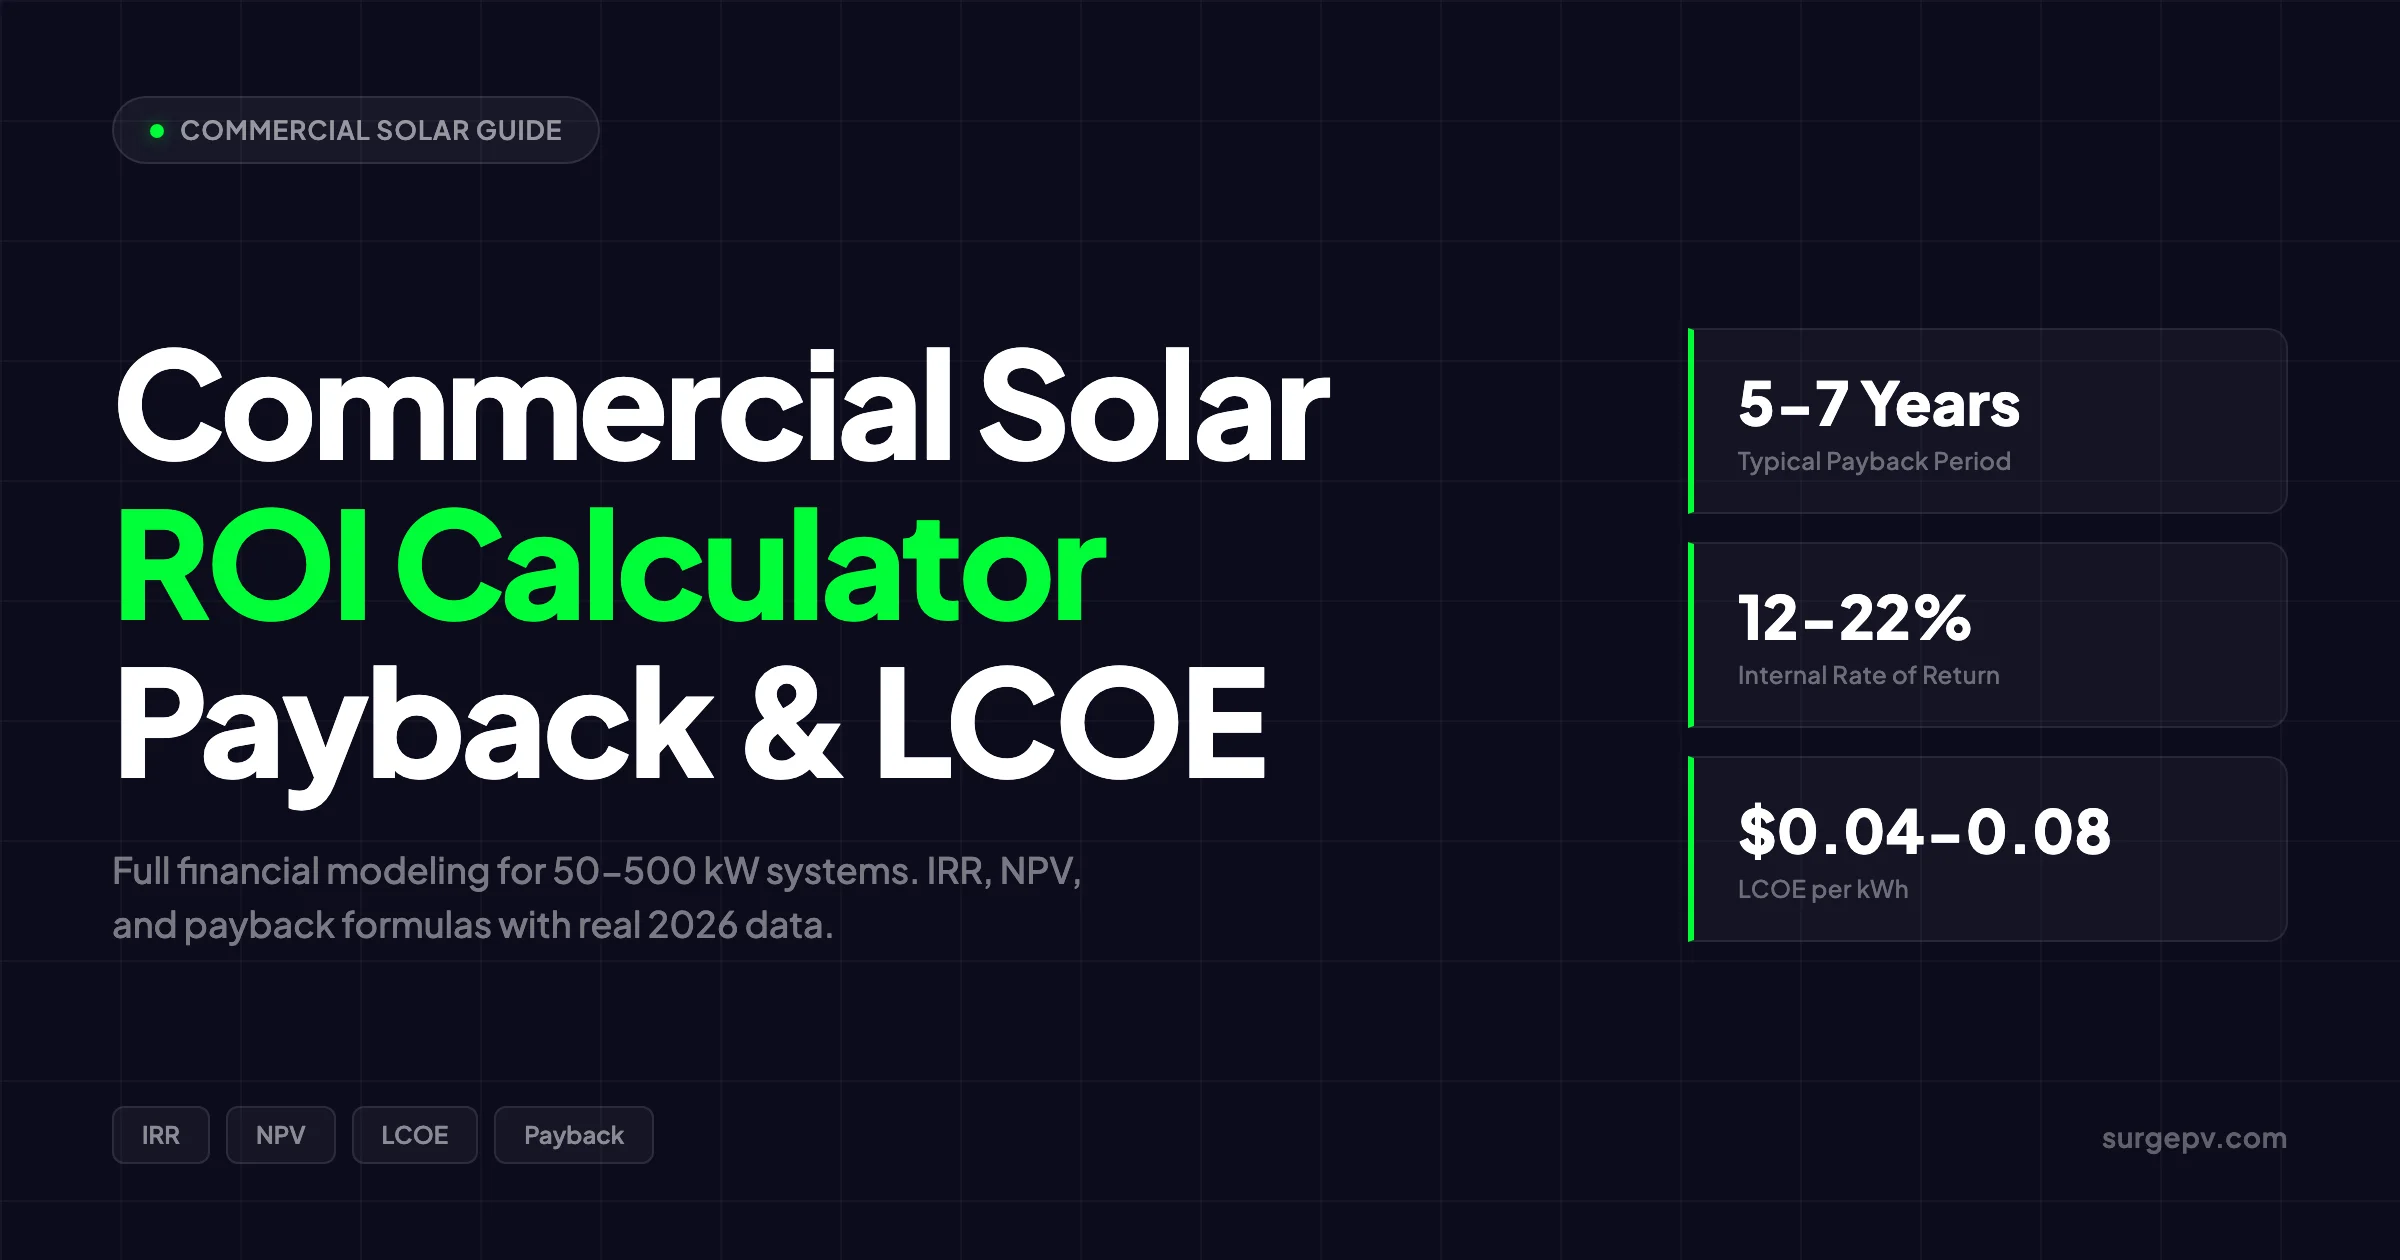
For any commercial project above €50,000, the generation and financial tool should be used to model lifetime cash flows, not just the payback year. The financial model should include: annual yield with degradation (0.4–0.7% per year), electricity price escalation (3–5% per year), O&M costs, and end-of-life replacement cost for the inverter at year 12–15.
For the complete financial modelling methodology, see Solar NPV, IRR, and Payback Guide.
Pro Tip: Use Payback to Open, NPV to Close
When presenting solar to a residential customer, lead with simple payback (“this system pays for itself in 8 years”). When presenting to a business owner or CFO, follow up immediately with 25-year NPV and IRR: “Over 25 years, this investment returns €38,000 on a €14,000 outlay — an IRR of 12%, better than most commercial real estate.” The two metrics serve different psychological purposes in the sale.
What Happens After the Payback Period?
The payback period is only the beginning of the story. After break-even, the system continues to generate energy savings for the remaining system lifetime — typically 15–22 additional years.
Lifetime financial model for a 10 kWp German residential system:
| Period | Cashflow |
|---|---|
| Year 0 | −€14,000 (installation) |
| Years 1–10 | +€2,600/year savings (rising ~3% annually with electricity) |
| Year 10 | Break-even point (total savings = €14,000) |
| Years 11–25 | +€3,100–€3,800/year (rising with electricity escalation) |
| Year 25 total | ~€57,000 gross savings on €14,000 investment |
Over a 25-year lifetime, a 10 kWp German residential system with an 8-year break-even returns approximately 4x the original investment. The internal rate of return on this scenario is approximately 14–18% — considerably higher than most fixed-income investments.
This is the number solar professionals should be citing when customers ask whether solar is “worth it”: not the payback period in isolation, but the lifetime return.
It is also worth noting that the 25-year figure is conservative. Most modern monocrystalline TOPCon and HJT panels degrade at 0.4–0.5% per year rather than the 0.7% used in older warranty calculations. At 0.45% degradation, a panel at year 25 still produces 89% of its nameplate output — meaning the cash flows in the final years of the model are only slightly lower than at year 1. String inverters typically need replacement at year 12–15 (cost: €800–1,500), which should be factored into any 25-year financial model. Panel degradation and inverter replacement together reduce the 25-year lifetime return by approximately 15–20% from the simplified figure, but the investment case remains strong in every market where payback is under 12 years.
The LCOE comparison is equally useful: a system that pays back in 8 years and lasts 25 years generates electricity at roughly €0.05–0.08/kWh over its lifetime — compared to €0.30–0.38/kWh for grid electricity in Germany. For a full country-level LCOE comparison, see Solar LCOE by Country.
How Installers Use Payback Data in Client Proposals
Payback data is the entry point for every residential solar conversation and the context for every commercial one. Here is how professional solar companies use it effectively.
1. Quote the Country Average, Then Personalise
Open client conversations with the country average payback period from the reference table above. Then personalise: “For your specific roof orientation, household consumption, and electricity tariff, here is what we calculate for your home specifically.” The national average sets expectations; the personalised figure closes the deal.
The solar proposal software used to generate the proposal should calculate a site-specific payback figure — not just apply the national average — because roof azimuth, tilt, shading, and household load profile can vary the payback period by 2–4 years within the same country. For more on this topic, see [Solar Shading Analysis Guide](/blog/solar-shading-analysis-guide).
2. Use Electricity Price Escalation in 10-Year Projections
Electricity prices in Europe have risen an average of 4–6% per year over the past decade. A proposal that shows static electricity prices underestimates the value of solar. Showing a 10-year electricity price escalation of 4% per year improves the apparent ROI significantly and is well-supported by historical data across all European markets.
3. Show Payback on the Net Cost, Not Gross
When subsidies or tax incentives apply, always show payback on the net cost (after incentives), not gross. A German customer who sees “payback in 11 years” on a €14,000 gross cost may hesitate. The same system showing “payback in 11 years” with no VAT deduction is already correct — but a French customer with a 5.5% reduced VAT qualifying installation should see payback based on the net-of-VAT cost.
4. Benchmark Against the Market
Use the country reference table above to benchmark any quote. If an installer in Spain is quoting a payback period of 12 years for a southern-facing residential roof, that is a red flag — either the system is oversized, the installation cost is above market, or the yield estimate is understated. Solar software that models yield accurately from the design phase helps catch these discrepancies before the proposal goes to the customer.
5. Show the Post-Payback Profit in the Proposal
Most solar proposals stop at the payback year. The strongest proposals continue through year 25, showing what the system earns after break-even. For a German residential system with a 10-year payback, the remaining 15 years of operation at €2,800–€3,500/year in savings represent €42,000–€52,500 of additional return. Showing that figure alongside the 10-year break-even transforms the conversation from “when do I get my money back?” to “what is this investment worth?” The generation and financial tool in SurgePV generates this lifetime cash flow projection automatically, with electricity price escalation built into the model. A complete proposal that shows the 25-year curve — not just the payback line — is a more persuasive document and wins more conversions in every market covered in this guide.
Conclusion
Solar payback periods range from under 3 years in the Gulf to over 20 years in Norway. That 7x spread is entirely explained by three variables: how much sun the location receives, what grid electricity costs, and how much the installation cost. Panel technology, brand, or system configuration play almost no role in that comparison.
Three takeaways for solar professionals:
- Use the country reference table to set expectations before quoting. If a customer in Germany expects a 5-year payback, education is needed — the market average is 8–12 years.
- Self-consumption is the fastest lever for improving payback. Every 10-percentage-point increase in self-consumption rate reduces payback by roughly 1 year in most European markets.
- After payback, the system is pure profit. A system with a 9-year payback and 25-year lifetime generates 16 years of net savings. Present the lifetime return, not just the break-even point.
Frequently Asked Questions
What is the average solar payback period globally?
The global average solar payback period for residential systems is 6–10 years in 2026. Markets with high irradiance and high electricity prices like the UAE, Australia, and southern Spain achieve payback in 3–6 years. Nordic markets with low electricity prices from hydropower can take 15–25 years.
Which country has the fastest solar payback period?
The UAE, Saudi Arabia, and Australia currently offer the fastest residential solar payback periods — typically 2.5–5 years. The combination of very high irradiance (1,900–2,400 kWh/m² annually), falling system costs, and improving net metering policies in Gulf markets produces the world’s fastest return timelines.
How long does solar take to pay back in Germany?
A residential solar system in Germany has an average payback period of 8–12 years in 2026. Germany benefits from 0% VAT on solar equipment, 20-year EEG feed-in tariff guarantees, and high electricity prices (€0.30–0.38/kWh). The main constraint is lower annual irradiance compared to Southern Europe.
Why does Norway have such a long solar payback period?
Norway’s solar payback periods reach 15–25 years because the country’s hydropower-dominated grid produces some of Europe’s lowest electricity prices (€0.10–0.14/kWh). Low energy cost means solar savings per kWh are minimal, and high installation costs (€1,600–2,200/kWp) compound the problem. Solar is financially marginal in Norway without significant subsidy support.
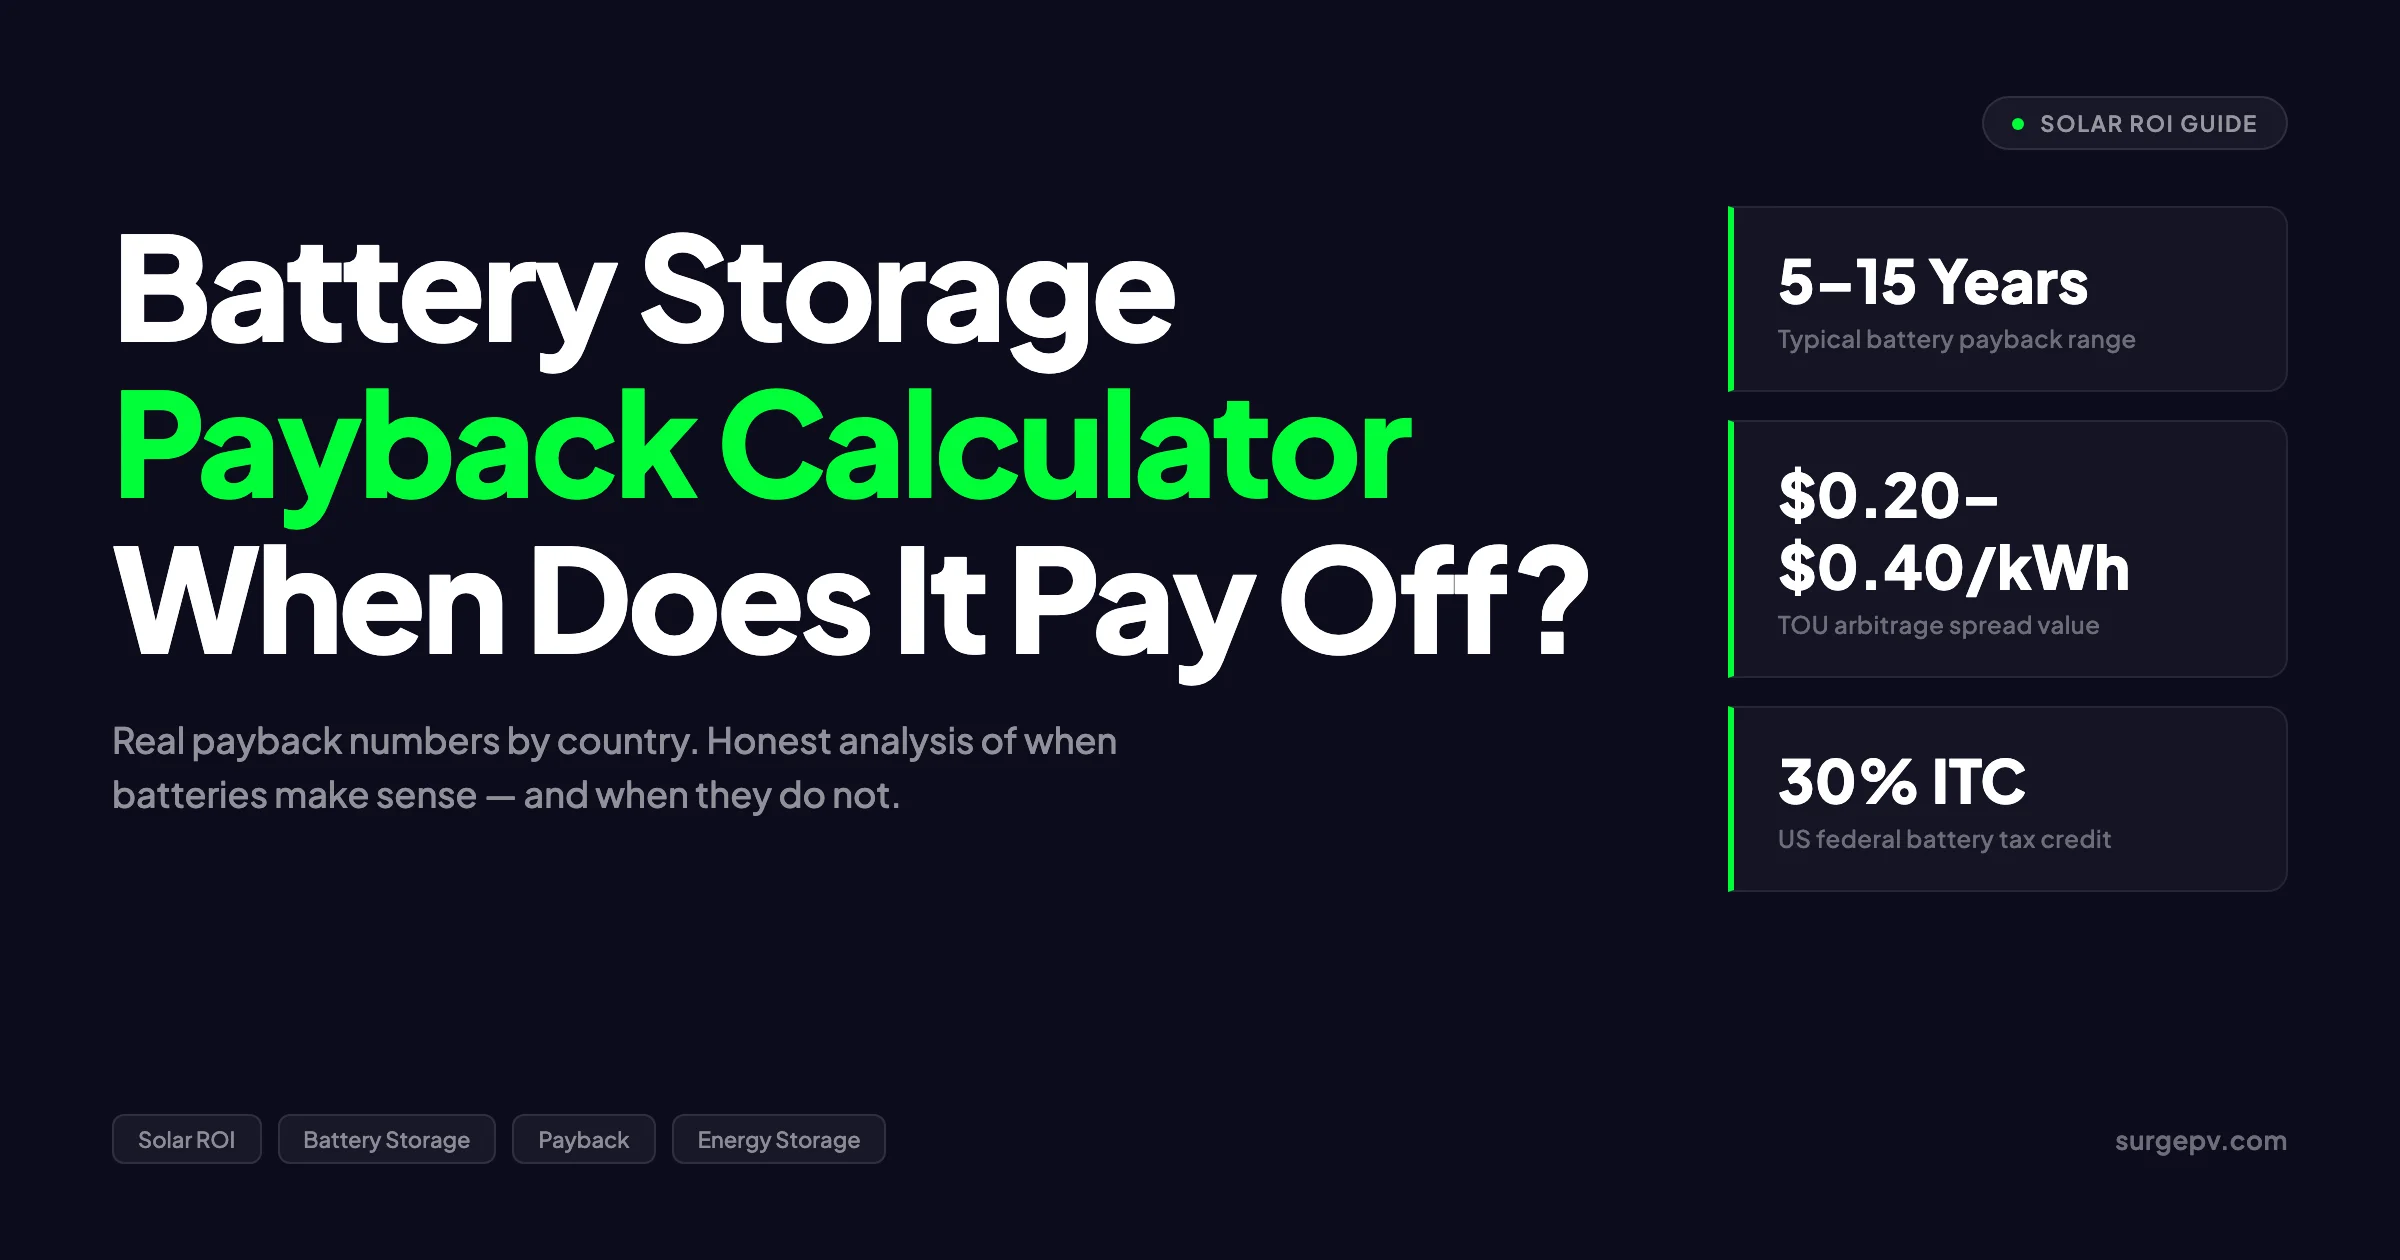
Does the solar payback period include battery storage?
Standard payback period calculations exclude battery storage. Adding a 10 kWh battery typically extends payback by 2–4 years in most markets, since battery storage adds €1,000–€3,000 to the system cost while improving self-consumption by 20–35%. Whether storage makes financial sense depends on the local time-of-use tariff structure.
What happens after the solar payback period?
After the payback period, the system generates pure financial return for the remaining system lifetime — typically 15–22 additional years of profit on a 25-year panel warranty. A system that pays back in 8 years still has 17 years of net savings ahead. Over a full 25-year lifecycle, most European residential systems return 2–4x the original investment. Solar design software helps optimize system design.