Quick Answer
Utility-scale solar LCOE in 2026 ranges from $0.02/kWh in Saudi Arabia and UAE to $0.08/kWh in Japan. European averages: Spain $0.03, Italy $0.035, Germany $0.04, UK $0.05. The US averages $0.03–$0.04/kWh depending on region. Declining module costs and improved financing have driven LCOE down 85% since 2010.
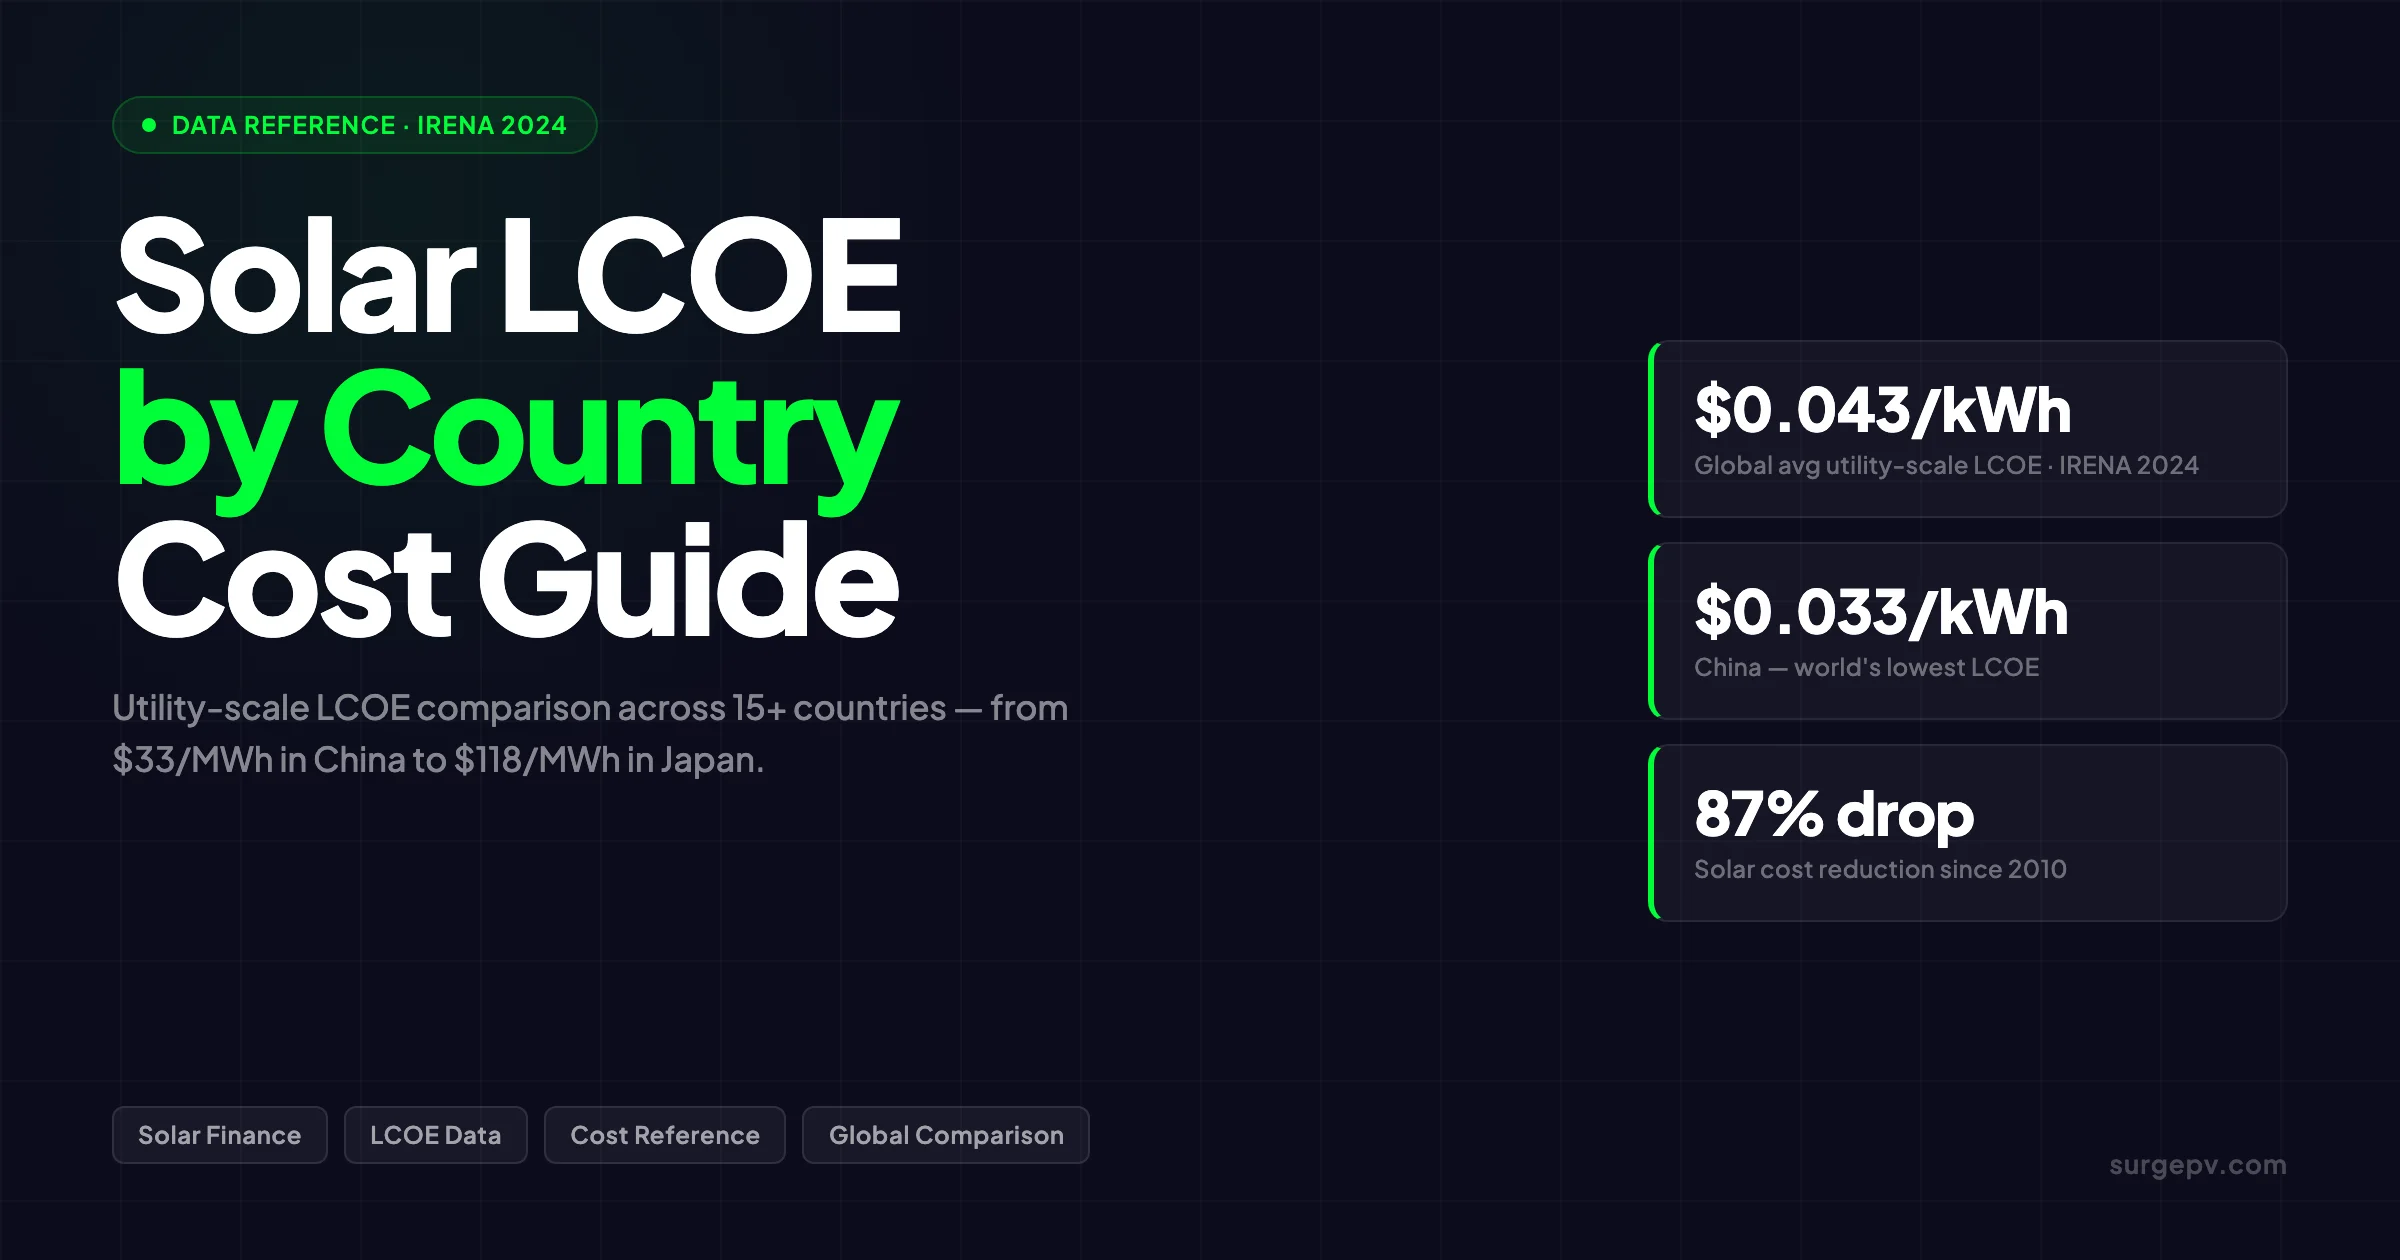
The difference between building a solar project in China and building one in Japan is not a rounding error — it is a 3.5x cost gap. China’s utility-scale LCOE reached $0.033/kWh in 2024 while Japan’s stands at $118/MWh, according to IRENA and Wood Mackenzie data. That gap determines whether a project gets financed, what return investors can expect, and how aggressively a solar business can price its proposals. This guide covers the latest LCOE figures by country and region, explains what drives the variation, and gives you a framework for using LCOE data in real project decisions.
Utility-scale solar LCOE in 2026 ranges from $0.02/kWh in Saudi Arabia and UAE to $0.08/kWh in Japan. European averages: Spain $0.03, Italy $0.035, Germany $0.04, UK $0.05. The US averages $0.03–$0.04/kWh depending on region. Also see: solar panel ROI in Italy. Also see: Germany solar subsidies. Also see: Spain net metering. Also see: European Solar Tax Credits.
Utility-scale solar LCOE in 2026 ranges from $0.02/kWh in Saudi Arabia and UAE to $0.08/kWh in Japan. European averages: Spain $0.03, Italy $0.035, Germany $0.04, UK $0.05. The US averages $0.03–$0.04/kWh depending on region. Declining module costs and improved financing have driven LCOE down 85% since 2010. For the latest details on UK, see Battery Solar System Design UK. See our guide on Commercial Rooftop Solar Case Study Italy for more.
TL;DR — Solar LCOE by Country 2024
Global weighted average utility-scale solar LCOE was $0.043/kWh in 2024 (IRENA). China leads at $0.033/kWh; India is $0.038/kWh; the USA is $0.070/kWh; Japan is the highest major market at ~$118/MWh. The Middle East and Africa achieved $37/MWh for single-axis tracker systems in 2025 — the lowest regional figure globally. Solar costs are now 41% cheaper than new fossil fuel alternatives on average.
For Africa-specific compliance details, see Africa solar compliance. For Global-specific compliance details, see Global net-metering-by-country.
What Is Solar LCOE and Why Does It Matter?
LCOE (Levelized Cost of Energy) is the standard metric for comparing electricity generating technologies. It converts all costs over a project’s lifetime into a single per-kilowatt-hour figure, allowing direct comparisons across countries, technologies, and system sizes. For France-specific information, see Agricultural Solar Case Study.
The formula is:
LCOE = (Total Lifetime Costs, NPV) ÷ (Total Lifetime Energy Output, NPV)
Formally:
LCOE = [ I₀ + Σ(Cₜ / (1 + r)ᵗ) ] ÷ Σ(Eₜ / (1 + r)ᵗ)
Where:
- I₀ = initial capital expenditure (CAPEX)
- Cₜ = annual operating costs in year t (OPEX)
- Eₜ = annual energy generation in year t (kWh)
- r = discount rate (%)
- t = project year (1 to 25 or 30)
The inputs that move LCOE most are:
| Input | Typical Range | Impact on LCOE |
|---|---|---|
| Capital cost (CAPEX) | $525–$1,133/kW globally | Largest single driver; 60–70% of LCOE |
| Discount rate | 4–12% depending on market | Higher rates add $10–20/MWh |
| Capacity factor | 12–30% depending on irradiance | Low CF inflates LCOE significantly |
| OPEX | $10–30/kW per year | Smaller share but compounds over 25+ years |
| Degradation rate | 0.45–0.7% per year | Reduces output year over year |
| Project life | 25–35 years | Longer life spreads costs further |
LCOE matters for three reasons. First, it is the primary metric used by IPPs, utilities, and banks to assess project viability. Second, it determines at what electricity price a project breaks even — if the market price is below LCOE, the project loses money. Third, for solar installers and EPCs quoting commercial or industrial projects, LCOE is the argument that closes deals when competing against grid tariffs.
Pro Tip
LCOE is a pre-financing, pre-subsidy metric. Value-Adjusted LCOE (VALCOE), a metric developed by the IEA, adds grid integration costs and the value of dispatchability. For storage-paired projects, always request the VALCOE alongside the headline LCOE figure.
Global Solar LCOE by Country: 2024 Data
The table below uses utility-scale ground-mounted solar data from IRENA’s July 2025 Renewable Power Generation Costs in 2024 report and Wood Mackenzie’s 2025 LCOE analysis. All figures represent weighted averages unless noted. See Ground Mounted Solar Design Guide for detailed guidance.
| Country / Region | Utility-Scale LCOE (2024) | Total Installed Cost (2024) | System Type |
|---|---|---|---|
| China | $33/MWh | $591/kW | Fixed-axis / tracking |
| India | $38/MWh | $525/kW | Ground-mount |
| Middle East & Africa | $37/MWh | — | Single-axis tracker |
| Brazil / Chile / Mexico | ~$40–50/MWh | — | Ground-mount |
| Global weighted avg | $43/MWh | $691/kW | Mixed |
| Spain / Portugal | ~$42–52/MWh | ~$779/kW (EU avg) | Ground-mount |
| Germany | ~$41–50/MWh (utility) | ~$779/kW (EU avg) | Ground-mount |
| Poland | ~$46/MWh | ~$779/kW (EU avg) | Ground-mount |
| Australia | ~$47–55/MWh | — | Ground-mount |
| USA | $70/MWh | $1,058/kW | Fixed-axis |
| Japan | ~$118/MWh | — | Ground-mount |
Sources: IRENA Renewable Power Generation Costs in 2024 (July 2025); Wood Mackenzie 2025 LCOE Analysis
Key Takeaway
The $33–$118/MWh range between China and Japan represents a 3.5x cost difference for essentially the same technology. Market structure, supply chain access, irradiance, and financing costs explain the gap — not the solar panels themselves.
The global weighted average of $43/MWh is skewed toward China and India because those two markets accounted for the majority of new capacity commissioned in 2024. A simple unweighted average across all markets would sit considerably higher.
Why Solar LCOE Varies So Much by Country
Five structural factors drive most of the country-to-country variation:
1. Solar Irradiance and Capacity Factor
Solar irradiance is the single largest natural driver of LCOE. A plant in Rajasthan, India generating 2,000 full-load hours per year has roughly double the energy output of an identical system in northern Germany generating 1,000 hours. Since LCOE divides costs by energy output, a high-irradiance location cuts LCOE almost in half compared to a low-irradiance one — with no change in capital cost.
The Middle East achieves $37/MWh primarily because of exceptional irradiance. Germany’s utility-scale LCOE of €41–50/MWh is competitive not because its costs are low, but because its engineering and policy environment have compressed costs enough to offset weaker solar resources.
2. Total Installed Costs and Supply Chain
Capital cost accounts for 60–70% of LCOE. The gap between India ($525/kW) and the USA ($1,058/kW) is almost entirely a supply chain story. India sources panels, inverters, and mounting hardware domestically at near-manufacturing cost. The USA imports most modules, pays higher labor rates, and carries balance-of-system costs that are 40–50% higher per watt.
Global total installed costs fell 87% between 2010 and 2024 — from roughly $4,800/kW to $691/kW weighted average. That decline is the primary reason solar is now cost-competitive with all other generation technologies in most markets.
3. Cost of Capital and Discount Rate
Solar is a capital-intensive, long-duration asset. The discount rate (cost of capital) used in LCOE calculations can move the output by $10–20/MWh depending on the market. A project in Germany financed at 4–5% looks very different from one in Sub-Saharan Africa financed at 10–12%.
The IEA’s Cost of Capital Observatory tracks this directly: markets with high political risk, currency risk, or underdeveloped green finance infrastructure carry structural LCOE penalties unrelated to their solar resource.
4. Permitting, Grid Connection, and Soft Costs
In the USA, soft costs — permitting, inspection, interconnection, customer acquisition, and installer overhead — add $150–300/kW to utility-scale projects. These costs are largely absent in China’s streamlined developer environment. Germany’s permitting complexity has driven up European average installed costs despite strong domestic manufacturing.
5. Labor Costs
Installation labor is a smaller share of utility-scale cost than residential, but it still matters. Chinese and Indian installation labor rates are 5–10x lower than equivalent US or German rates. For large ground-mount projects, this translates to $20–50/kW in direct LCOE impact.
Solar LCOE in Asia: China, India, Japan, and Southeast Asia
China
China is the world’s solar cost benchmark. At $33/MWh (IRENA 2024) and $27/MWh on some Wood Mackenzie estimates, Chinese utility-scale solar is the cheapest large-scale electricity source in the country — and cheaper than coal. Total installed costs of $591/kW reflect full domestic supply chain integration: Chinese manufacturers produce panels, inverters, trackers, and structural steel at scale and sell domestically at near-export prices.
China’s dominance in solar manufacturing means its LCOE is effectively a floor price for global supply chains. Any country that can source Chinese equipment at export pricing starts with a meaningful cost advantage.
The country’s stated ambition — reaching $388/kW total installed costs by 2030 — would bring Chinese utility LCOE below $20/MWh in high-irradiance provinces. That figure would undercut coal by 50–60% and makes LCOE-based grid parity an obsolete concept in China.
India
India achieved the world’s lowest total installed costs in 2024 at $525/kW, driven by a 28% year-over-year decrease. Its LCOE of $38/MWh reflects strong irradiance (most of India receives 1,700–2,200 kWh/m²/year), low labor costs, and an increasingly competitive domestic supply chain.
The Indian solar tender market has consistently produced sub-$35/MWh auction prices. Projects in Rajasthan and Gujarat regularly achieve capacity factors of 25–28%, compressing LCOE further. India’s challenge is grid infrastructure — curtailment in high-penetration states adds hidden cost that pure LCOE figures do not capture.
For more details, see our guide on solar design software India.
For solar EPCs using solar design software to quote Indian projects, the benchmarks to stress-test proposals against are $35–40/MWh at utility scale and $60–80/MWh for commercial rooftop.
Japan
Japan sits at the opposite end of the spectrum. At approximately $118/MWh, Japanese solar LCOE is the highest among major markets. Three factors explain this:
- High total installed costs — Japan’s mountainous terrain, strict seismic standards, and grid connection requirements push costs above $1,500/kW for many utility-scale projects.
- Lower irradiance — Japan’s average global horizontal irradiance is below that of Germany per square meter, particularly in northern Honshu and Hokkaido.
- Permitting complexity — Solar project permits in Japan can take 3–5 years for large ground-mount systems, adding financing carry costs that other markets avoid.
Japan’s feed-in tariff system (FIT) was designed to make high-LCOE solar viable, but as FIT rates have dropped, new projects depend on corporate PPAs priced well above global averages.
Southeast Asia
Vietnam, Thailand, and the Philippines sit in the $45–70/MWh range depending on system type and financing. Vietnam’s rapid auction program in 2020–2021 drove utility-scale LCOE toward $45–50/MWh before grid saturation caused curtailment. The Philippines, with complex permitting and island-grid constraints, typically sees $60–80/MWh at utility scale.
Solar LCOE in Europe: Germany, Spain, Italy, France, and the UK
Europe’s average total installed cost of $779/kW in 2024 sits between India and the USA. The region’s variation is wide — southern European countries with high irradiance and streamlined permitting approach Middle Eastern economics, while northern markets carry structural cost penalties.
Germany
Germany’s utility-scale solar LCOE ranges from approximately €0.041/kWh to €0.050/kWh — competitive with natural gas and below new coal. But the range across all system types is €0.041–€0.144/kWh, with small residential rooftop at the upper end.
Several factors keep Germany’s utility-scale costs low despite its northern latitude:
- Highly competitive EPC market with efficient procurement
- Mature financing ecosystem with green bonds and KfW loans at sub-4% rates
- Module prices at or near Chinese export pricing
- Average 1,000–1,100 kWh/m²/year irradiance in southern Bavaria, rising to 1,200 kWh/m² in favorable locations
The pressure point in Germany is permitting. Long planning periods for new ground-mount sites add 12–18 months of pre-construction cost, which increases effective LCOE by €3–5/MWh versus project economics in Spain or Portugal.
For EPCs working in Germany, our solar subsidies guide for Germany covers the EEG auction framework that determines bankable revenue alongside these LCOE figures.
Spain and Portugal
Spain and Portugal consistently show the lowest LCOE within Europe. Irradiance in southern Spain (Huelva, Almería, Badajoz) reaches 1,800–2,200 kWh/m²/year — close to Middle Eastern levels in the best sites. Utility-scale projects in those provinces achieve LCOEs of €42–46/MWh on recent bids, with the best projects in Huelva reaching €42/MWh.
Portugal’s 2019 auction produced a record-low bid of €14.76/MWh — still the EU’s cheapest-ever solar PPA. While that was an anomalous bid, Spanish and Portuguese utility LCOEs in the €42–52/MWh range are achievable and bankable at current market prices.
Italy
Italy’s solar LCOE varies more than Spain’s because of regional grid constraints and a more complex permitting environment in the south. Southern Italian utility projects target €45–55/MWh, while northern Italy’s weaker irradiance pushes LCOE toward €55–65/MWh.
Italy is relevant for installers because of its strong commercial rooftop market. The Superbonus program drove residential LCOE calculations in a different direction — incorporating subsidy value — but underlying system economics for commercial installations without incentives sit at €55–75/MWh.
Our analysis of solar panel ROI in Italy covers post-incentive economics in detail.
France
France’s utility-scale LCOE sits around €45–55/MWh. The country’s strong grid and CRE auction mechanism support bankable projects, but its permitting timeline — averaging 4–6 years for large ground-mount — inflates effective development cost. France’s feed-in premium auctions have driven competition, with recent winning bids at €40–50/MWh. Also see: France solar feed-in tariffs.
France’s feed-in tariff framework determines the revenue side of LCOE calculations for most utility developers.
United Kingdom
UK utility-scale solar LCOE sits in the £45–65/MWh range. The UK’s weaker irradiance (800–1,100 kWh/m²/year) is offset by a competitive market for grid-connected projects, favorable financing rates, and a CfD (Contracts for Difference) mechanism that provides 15-year revenue certainty. UK projects depend heavily on low cost of capital to remain competitive — even a 1% increase in discount rate adds £4–6/MWh.
Pro Tip
When comparing European LCOE figures, always confirm whether the number is EUR or USD, pre- or post-subsidy, and whether it includes grid connection costs. A Spanish project quoted at €42/MWh pre-grid connection may reach €50/MWh fully inclusive — still excellent, but the comparison only holds when figures use the same scope.
Solar LCOE in the Americas: USA, Brazil, Chile, Mexico
United States
The USA’s $70/MWh utility-scale LCOE in 2024 reflects structural cost issues that go beyond irradiance. Total installed costs of $1,058/kW are nearly double India’s and 80% higher than China’s. The gap stems from:
- Labor: US installation labor costs $25–40/worker-hour versus $5–8/worker-hour in India or China
- Permitting: NERC interconnection studies and utility-specific grid studies add $50–150/kW and 18–36 months to project timelines
- BOS costs: Steel, conduit, transformers, and civil works carry US commodity pricing
- Soft costs: Legal, financing, insurance, and customer acquisition add $100–200/kW that Asian developers avoid
The Inflation Reduction Act (IRA) investment tax credit does not appear in LCOE figures (which are pre-subsidy), but it materially changes project economics. With the 30% ITC applied, the after-credit effective cost drops to roughly $740/kW, compressing functional LCOE toward $50/MWh for well-sited projects.
The IRA solar tax credit guide covers how EPCs should present these economics to commercial clients.
US residential solar LCOE is even higher: Lazard’s 2023 estimate puts it at $117–282/MWh depending on location and financing, reflecting installation complexity, higher customer acquisition costs, and smaller system scale.
Brazil and Chile
Both countries are in the $40–50/MWh range for utility-scale solar — among Latin America’s lowest. Latin American renewable LCOE fell 23% between 2020 and 2024, driven by a 20% reduction in capital costs per kilowatt. Brazil’s auction system has produced sub-$30/MWh bids in high-irradiance northeastern states, though grid expansion costs complicate the economics of remote generation.
Chile’s Atacama Desert offers some of the world’s highest solar irradiance anywhere — above 3,000 kWh/m²/year in the best sites. Projects in the Atacama can theoretically achieve sub-$20/MWh LCOE at utility scale, though transmission from remote sites increases effective all-in costs.
Mexico
Mexico’s utility-scale solar LCOE mirrors Brazil at approximately $40–50/MWh. Strong irradiance across the northwest and central plateau, competitive EPC markets, and access to Chinese equipment at export pricing drive costs down. Policy uncertainty under recent administrations has, however, increased the risk premium lenders apply — adding $5–10/MWh to effective LCOE versus the pure engineering calculation.
Solar LCOE in the Middle East and Africa
The Middle East and Africa region recorded the world’s lowest regional solar LCOE in 2025: $37/MWh for single-axis tracker systems, according to Wood Mackenzie. This reflects irradiance levels in Saudi Arabia, UAE, and Egypt that regularly exceed 2,200–2,500 kWh/m²/year.
Saudi Arabia’s Al-Faisaliah project produced a record-low bid of $10.4/MWh in 2021 — an outlier driven by unique financing conditions, but illustrative of what exceptional irradiance combined with low cost of capital can produce.
Sub-Saharan Africa tells a different story. Despite high irradiance, Africa’s total installed costs of $1,093/kW are the second-highest globally, behind only Asia ex-China/India. Limited local supply chains, high import costs for equipment, hard-currency financing requirements, and political risk premiums all inflate LCOE to $60–100/MWh across most of the continent.
Wood Mackenzie projects Middle East single-axis tracker LCOE will fall to approximately $17/MWh by 2060 — a figure that, if realized, makes solar the cheapest energy source in the region by a factor of 2–3 relative to alternatives.
Solar LCOE vs. Fossil Fuels: Where Does Solar Now Stand?
Solar costs fell 41% below fossil fuel alternatives on average in 2024 (IRENA). The comparison below uses global weighted average new-build costs:
| Technology | Global LCOE (2024) | Notes |
|---|---|---|
| Utility-scale solar PV | $43/MWh | IRENA global weighted avg |
| Onshore wind | $34/MWh | IRENA 2024 |
| Combined-cycle gas | $60–80/MWh | Varies with gas price |
| New coal | $80–120/MWh | IEA 2024, global avg |
| Offshore wind | $100/MWh | BNEF 2025 benchmark |
| Nuclear (new build) | $130–180/MWh | Lazard 2023 |
In China and India, solar is cheaper than any fossil fuel alternative at current cost levels. In the USA, solar at $70/MWh competes with combined-cycle gas ($65–80/MWh depending on gas price) without subsidies, and beats it comfortably with the ITC applied. In Japan, the economics are reversed — solar at $118/MWh is expensive relative to imported LNG combined cycle in a market with low gas prices.
The break-even threshold shifts further in solar’s favor when carbon pricing is included. A $50/tonne CO₂ price adds $18–22/MWh to coal and $9–12/MWh to gas, while adding zero to solar. The EU’s ETS carbon price trading above €60/tonne makes European coal uneconomic against solar at current installed cost levels.
Model Solar Project Economics With Precision
SurgePV’s generation and financial tool calculates project LCOE, NPV, IRR, and payback period for any location — residential, commercial, or utility scale.
Book a DemoNo commitment required · 20 minutes · Live project walkthrough
For a direct comparison, see Arka 360 vs SurgePV.
Residential vs. Commercial vs. Utility-Scale LCOE: The System Size Gap
The LCOE figures cited so far are for utility-scale ground-mount systems. Residential and commercial rooftop solar carry significantly higher LCOE due to smaller scale, higher labor-per-watt costs, and more complex installation environments.
| System Type | Typical Size | LCOE Range (USA) | LCOE Range (Germany) | LCOE Range (India) |
|---|---|---|---|---|
| Residential rooftop | 5–15 kW | $117–282/MWh | €84–144/MWh | $70–110/MWh |
| Commercial rooftop | 100 kW–5 MW | $70–130/MWh | €55–90/MWh | $45–70/MWh |
| Utility ground-mount | 10 MW+ | $50–90/MWh | €41–55/MWh | $35–45/MWh |
Sources: Lazard (2023) for US ranges; IRENA and PV Magazine for Germany and India estimates.
The 3–4x LCOE difference between residential and utility-scale reflects several compounding factors:
Scale effects on hardware: A 500 MW solar farm in India procures panels at near-manufacturer cost. A 10 kW residential system purchases through distribution at 20–40% premium.
Labor intensity: Residential installation requires more labor per watt — roof preparation, complex racking, small inverter installation, and metering work add $0.30–0.60/W that utility-scale avoids.
Interconnection and permitting: Per-system permitting costs are similar regardless of scale. A $2,000 permit fee on a 5 kW residential system adds $0.40/W; the same fee on a 10 MW commercial system adds $0.0002/W.
Financing cost: Residential solar is typically financed through consumer loans at 6–10%. Utility projects finance at 4–6% through institutional green bonds. The 3–4% rate difference compounds significantly over 25 years of LCOE calculation.
Despite higher LCOE, residential solar is economically viable because it competes against retail electricity tariffs — not wholesale market prices. A German household paying €0.30/kWh against a residential solar LCOE of €0.10–0.14/kWh captures €0.16–0.20/kWh of savings, which produces payback periods of 8–12 years even at the higher LCOE level.
Worked LCOE Example: 10 MW Ground-Mount in Spain
To illustrate how country-level factors translate into actual project LCOE, here is a representative calculation for a 10 MW fixed-tilt system in Badajoz, Spain:
| Input | Value | Notes |
|---|---|---|
| Capital cost (CAPEX) | €620/kW | Module + inverter + mounting + civil + grid |
| Total capital | €6.2M | 10 MW × €620/kW |
| Annual OPEX | €32,000/MW/year | O&M, insurance, land lease |
| Annual energy output | 21,500 MWh | 10 MW × 2,150 full-load hours |
| Module degradation | 0.5%/year | Linear over 25 years |
| Project life | 25 years | Standard bankability assumption |
| Discount rate | 5.5% | European green project financing |
Applying the standard LCOE formula to these inputs produces an LCOE of approximately €48/MWh — consistent with the €45–52/MWh range quoted for Spanish utility projects.
The sensitivity analysis shows how individual variables move the outcome:
| Change | LCOE Impact |
|---|---|
| Discount rate +2% → 7.5% | +€8/MWh |
| CAPEX +€100/kW | +€6/MWh |
| Annual output −10% (worse site) | +€5/MWh |
| OPEX +50% | +€3/MWh |
Discount rate is the single most powerful lever after CAPEX. For EPCs and developers structuring commercial projects, securing green financing rates below 5% can be worth more than negotiating the last €20/kW on module pricing.
The solar installation cost breakdown covers CAPEX components in detail for installers building their own cost models.
How LCOE Affects Solar Project Finance and Developer Decisions
LCOE is a threshold metric, not a profit metric. A developer’s actual return depends on the gap between LCOE and contracted revenue (PPA price or feed-in tariff). Understanding this gap is the practical application of LCOE data.
The LCOE-to-PPA spread:
A project in Spain with a $50/MWh LCOE and a corporate PPA at $60/MWh generates $10/MWh of gross margin over the project life. A US project at $70/MWh LCOE needs a PPA above $70/MWh to be viable without subsidies — which is achievable in most US markets where industrial electricity rates are $80–120/MWh.
For commercial and industrial projects, the relevant benchmark is not the wholesale market price but the customer’s avoided cost — typically the retail tariff. A European commercial customer paying €0.20/kWh retail, against a commercial rooftop LCOE of €0.07/kWh, is looking at savings of €0.13/kWh. That is a straightforward value proposition regardless of what the wholesale market does.
Discount rate sensitivity:
LCOE calculations are highly sensitive to the discount rate assumed. A 10 MW utility project in Germany:
| Discount Rate | LCOE (estimated) |
|---|---|
| 3% (government bond rate) | ~€38/MWh |
| 5% (low-risk commercial) | ~€43/MWh |
| 7% (mid-market) | ~€49/MWh |
| 10% (high-risk market) | ~€61/MWh |
The IEA’s Cost of Capital Observatory shows that markets with underdeveloped green finance ecosystems pay an effective LCOE penalty of $10–25/MWh relative to OECD markets with similar irradiance — purely from financing cost differences.
Using LCOE in proposals:
For solar installers and EPCs, the generation and financial tool calculates site-specific LCOE automatically from irradiance data, system design, and user-defined financing assumptions. This removes the manual calculation risk and allows direct benchmarking against local utility tariffs.
Our guide to solar NPV, IRR, and payback calculations covers the financial metrics that work alongside LCOE when presenting projects to commercial clients.
Solar LCOE Trends: 2024 to 2035
Where costs stand in 2025:
BloombergNEF’s 2025 benchmark puts fixed-axis utility solar at $39/MWh globally — a 6% increase from 2024 due to supply chain constraints, China’s market reforms reducing export pricing incentives, and slightly lower capacity factors in some markets. This is the first year-over-year increase in BNEF’s benchmark after nearly a decade of continuous declines.
The $39/MWh BNEF figure and the $43/MWh IRENA figure represent different methodologies: BNEF uses a forward-looking benchmark cost for new projects, while IRENA uses a weighted average of all projects commissioned in the year.
The 2035 projection:
BloombergNEF projects solar LCOE will fall 30% from 2025 levels by 2035. Key drivers:
- Module efficiency gains: TOPCon and HJT panels reaching 25–27% efficiency by 2030 reduce the number of panels required per MW, cutting BOS costs
- Tracker cost reduction: Single-axis tracker costs are declining faster than module costs — expanding their addressable market and improving energy yield by 15–25%
- Battery integration: Solar-plus-storage LCOE averaged $57/MWh in 2025 for projects with 4-hour storage. Battery costs fell 27% in 2025 alone; by 2030 the LCOE of paired systems should approach current standalone solar costs in most markets
- Supply chain normalization: Post-China-reform supply chain restructuring will take 2–4 years to stabilize but should drive module prices back toward historical trend lines
What this means for 2026 projects:
Global total installed costs are expected to fall below $600/kW by 2026 on IRENA projections, from $691/kW in 2024. For developers pricing long-term PPAs today, building in a 5–10% annual cost improvement assumption is reasonable for equipment-intensive project components.
The exception is markets where soft costs and permitting dominate — USA, Japan, UK. In those markets, the hardware cost decline will not flow through at full rate because non-hardware costs are not declining at the same pace.
Key Takeaway
The next phase of solar cost reduction is not about cheaper panels — modules are already at near-commodity pricing in most markets. The gains will come from faster permitting, lower cost of capital in emerging markets, and battery integration reducing the effective cost of dispatchable solar.
How to Use LCOE Data in Your Solar Business
LCOE figures from IRENA or BNEF are benchmarks, not project-specific costs. Here is how to apply them practically:
Step 1: Establish your local benchmark. Country-level LCOE gives you a reference floor. A US EPC quoting a 1 MW commercial ground-mount should target within 15–20% of the $70/MWh national average or investigate why costs are higher. Read Design Commercial Solar System 1MW for a complete walkthrough.
Step 2: Calculate site-specific LCOE. Run your specific project through a solar design software platform that integrates irradiance data with financial modeling. Site-specific capacity factors differ significantly from national averages — a California project versus a Wisconsin project in the same country can have $15–20/MWh LCOE difference from irradiance alone.
Step 3: Benchmark against avoided cost, not LCOE alone. The comparison that wins commercial projects is LCOE versus the customer’s current electricity tariff. If a customer pays $0.12/kWh and your project delivers electricity at $0.07/kWh LCOE, the $0.05/kWh savings is the value proposition — not the absolute LCOE figure.
Step 4: Model the full financial picture. LCOE does not capture payback period, IRR, NPV, or cash flow timing — all of which matter for financing and investor returns. Use LCOE as the entry-level screening metric, then model the complete solar ROI picture before presenting to clients or lenders.
Step 5: Track subsidy value separately. Country-specific incentives (Germany’s EEG, US ITC, Italy’s Conto Energia) change project economics without changing LCOE. Model the incentivized NPV alongside the pre-incentive LCOE to show investors both the underlying project strength and the policy upside. The European solar incentives overview and solar subsidies tracker cover the policy layer for European projects.
For commercial projects that need a full proposal — covering LCOE, savings analysis, and ROI — our solar proposal software generates client-ready financial documentation directly from the design model.
Solar LCOE and the Role of Accurate Energy Simulation
LCOE calculations are only as accurate as the energy production estimate in the denominator. An error in simulated annual output flows directly into LCOE — a 10% overestimate of generation inflates the apparent LCOE by 10%.
The major sources of simulation error:
- Irradiance data quality: Using GHI data appropriate to your climate zone — GHI, DNI, or POA depending on system type. Our guide to solar irradiance metrics explains when each applies.
- Shading losses: Unaccounted near-field shading is the most common cause of LCOE underestimation. A single tree or rooftop obstacle that reduces output 8–12% moves LCOE by a corresponding amount.
- Degradation rate: Most LCOE models use 0.5%/year linear degradation. High-humidity or high-temperature environments may see 0.6–0.7%/year, which adds $2–4/MWh to lifetime LCOE.
- System losses: Wiring, mismatch, soiling, and inverter losses combine to 15–25% of nameplate generation. Under-modeling losses produces optimistic LCOE that does not match real-world performance. Shadow analysis software identifies shading issues before installation.
Using accurate solar software with validated irradiance databases (Solargis, NASA POWER, PVGIS) reduces simulation uncertainty from ±15% to ±5%, which is the level of precision lenders and investors require for bankability.
Conclusion
Three things stand out from the 2024 LCOE data:
- The cost gap between markets is structural, not temporary. China at $33/MWh and Japan at $118/MWh are not converging quickly — supply chains, permitting regimes, and financing ecosystems change slowly. Developers should price projects against their specific market benchmark, not the global average.
- Solar is definitively cheaper than new fossil fuel alternatives in most markets. At $43/MWh global weighted average versus $80–120/MWh for new coal, the economic argument for solar requires no subsidy in the majority of the world’s electricity markets.
- The next cost frontier is the cost of capital and soft costs, not hardware. Panels and inverters are near commodity pricing. Markets that solve permitting timelines, grid connection delays, and financing access will see the next phase of LCOE compression — regardless of irradiance.
Frequently Asked Questions
What is LCOE in solar energy?
LCOE (Levelized Cost of Energy) is the total lifetime cost of a solar plant divided by its total lifetime energy output, expressed in $/kWh or $/MWh. It accounts for capital costs, operating expenses, financing, and degradation over a 25–30 year project life. LCOE is the standard metric for comparing solar economics across countries, system types, and technologies.
Which country has the lowest solar LCOE in 2024?
China recorded the world’s lowest utility-scale solar LCOE at $0.033/kWh in 2024, according to IRENA. India came close at $0.038/kWh. For regional averages, single-axis tracker solar in the Middle East and Africa reached $37/MWh in 2025 — the lowest of any global region tracked by Wood Mackenzie.
What is the global average solar LCOE in 2024?
The global weighted average LCOE of utility-scale solar PV was $0.043/kWh ($43/MWh) in 2024, according to IRENA’s July 2025 Renewable Power Generation Costs report. This represents a marginal 0.6% increase from 2023, following a 12% decrease in 2022–2023. The figure is weighted heavily toward China and India, where most new capacity was commissioned.
Why is solar LCOE so much lower in China and India than in the USA?
Three factors drive the gap. First, China and India have fully integrated domestic solar supply chains — panels, inverters, and mounting systems cost 30–50% less than in the USA. Second, labor costs for installation are significantly lower. Third, permitting and grid interconnection in the USA typically add $150–300/kW to total installed costs that Chinese and Indian developers avoid. US LCOE of $70/MWh versus China’s $33/MWh reflects this structural difference.
How does solar LCOE compare to new coal or gas plants in 2024?
Solar costs fell 41% below fossil fuel alternatives on average in 2024. New utility-scale solar at $43/MWh globally is cheaper to build and operate than new coal or gas in most markets. In India and China, solar LCOE is less than half the cost of new coal. In the USA and Germany, solar now competes favorably with combined-cycle gas even before carbon pricing is applied.
What will solar LCOE cost in 2030 and 2035?
BloombergNEF projects solar LCOE will fall 30% from 2025 levels by 2035, driven by continued module efficiency improvements and supply chain stabilization. IRENA data shows global total installed costs could reach below $600/kW by 2026, with China potentially reaching $388/kW by 2030. Middle East single-axis tracker solar is projected to reach $17/MWh by 2060.