

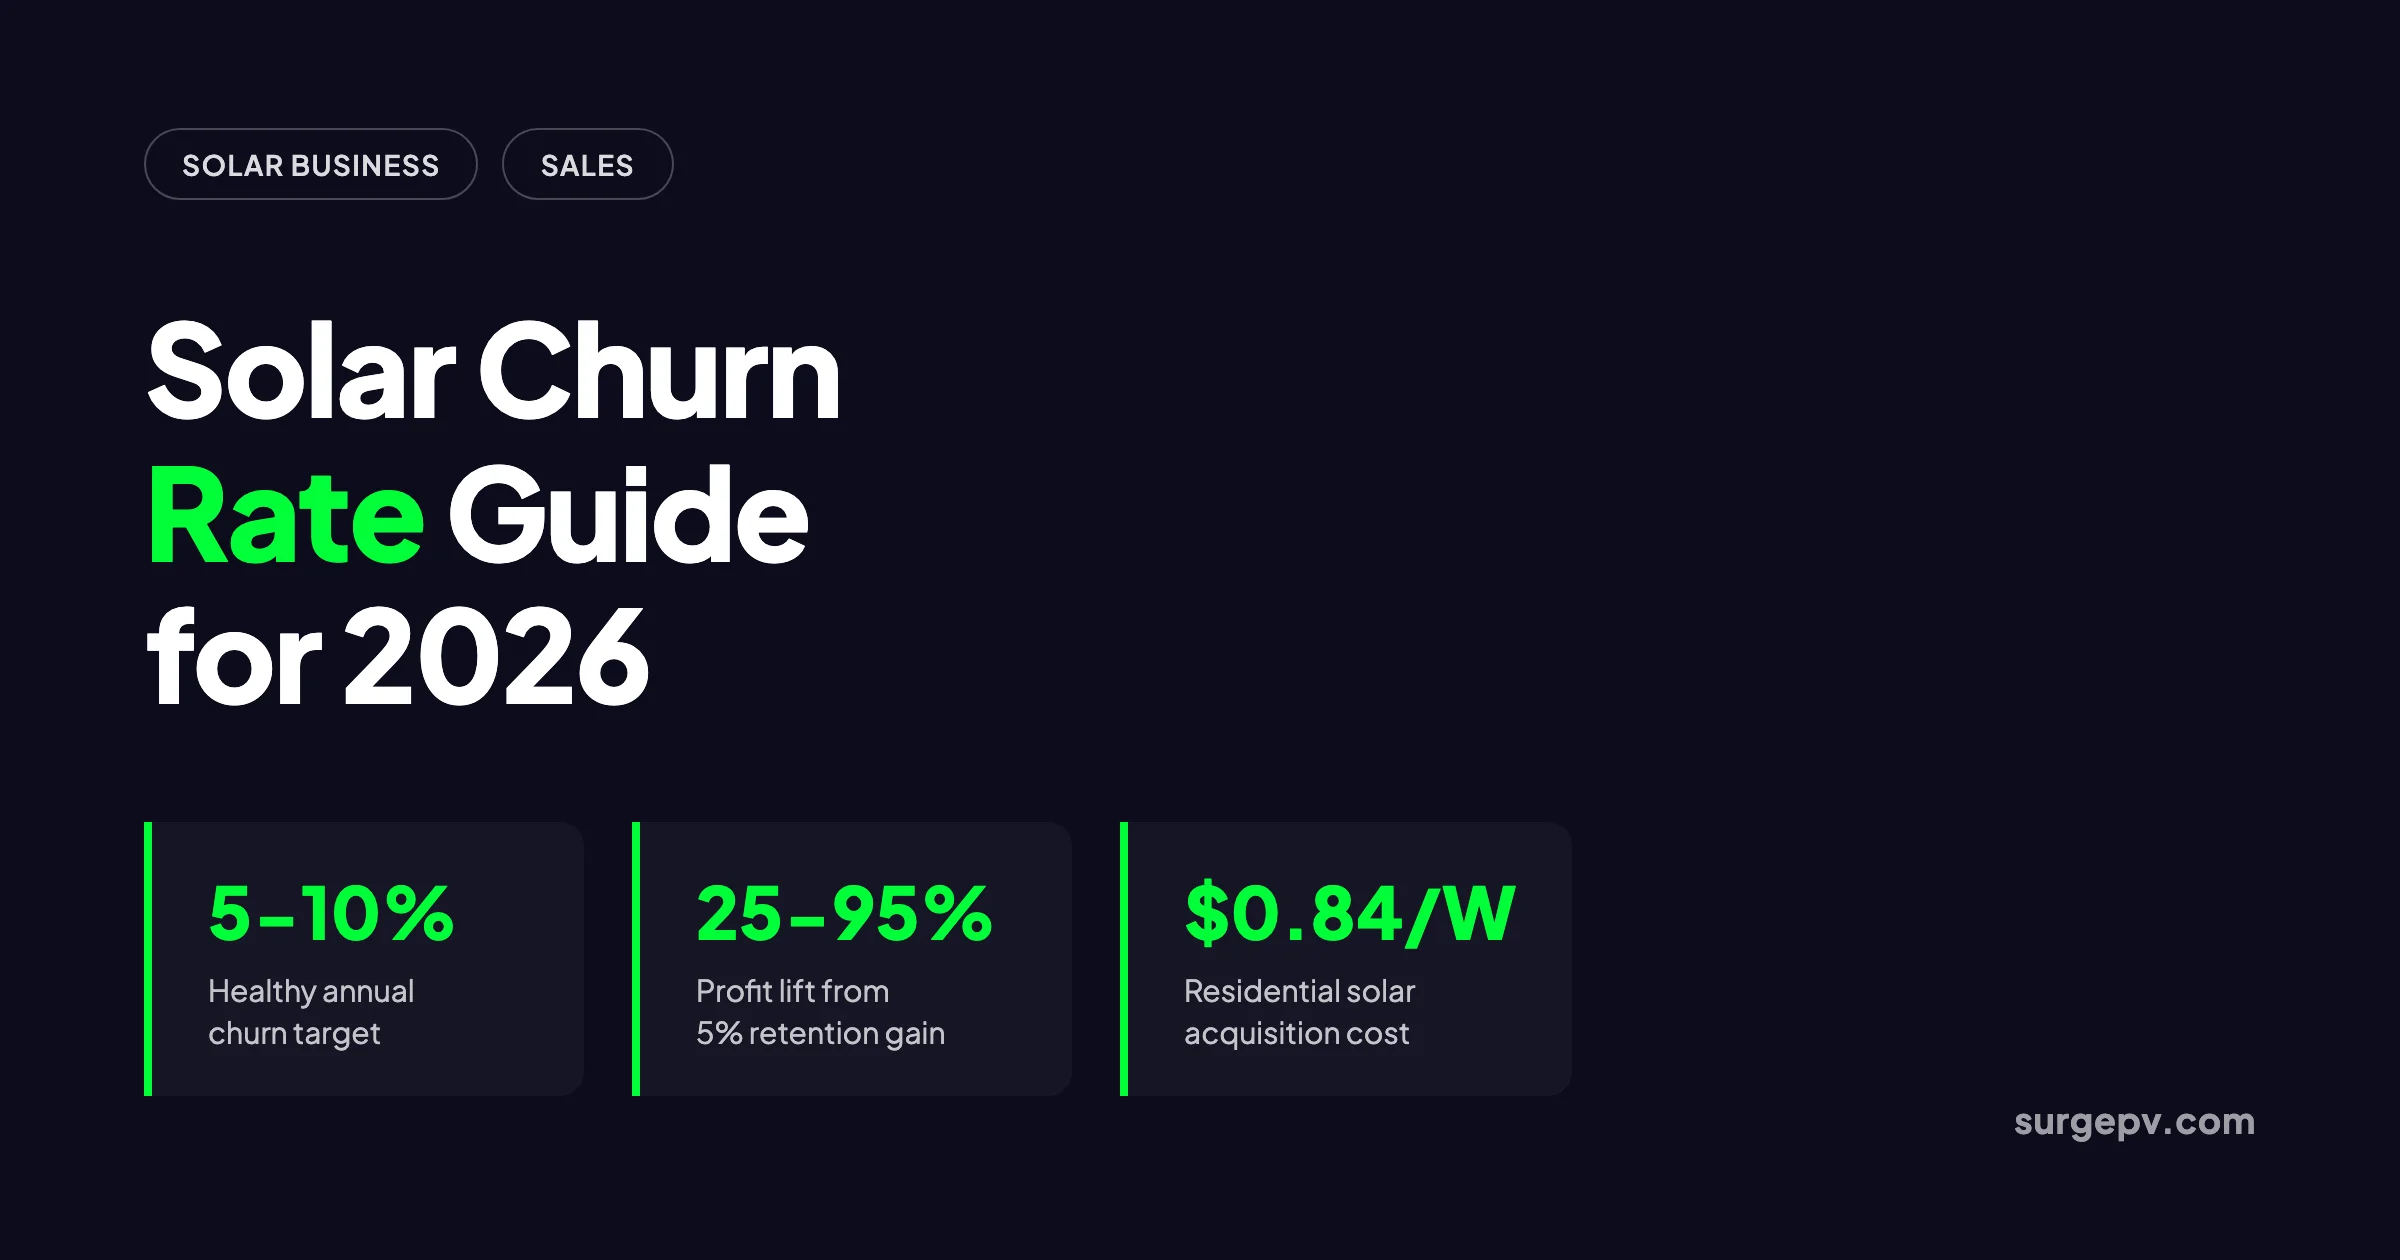
Residential solar customer acquisition cost hit $0.87 per watt in 2024 and is projected to stay near $0.84 per watt in 2026, according to Wood Mackenzie. On a typical 8 kW system, that is roughly $6,700 to acquire one customer before a single panel ships. If that customer leaves, cancels, or never returns for a battery upgrade, much of that spend is wasted.
That is why solar churn rate matters. It is a finance metric first and a customer service metric second. Churn determines how much of your acquisition spend turns into long-term value, how fast your installed base compounds, and whether your business can survive a market contraction.
In this guide, you will learn:
- What solar churn rate means and how it differs from other industries
- How to calculate customer churn, revenue churn, and annualized churn
- Benchmarks that help you judge whether your number is healthy
- The real reasons solar customers churn, with data behind each driver
- A practical framework for reducing churn and increasing lifetime value
- How churn connects to customer acquisition cost, referrals, and retention economics
Quick Answer
Solar churn rate is the percentage of customers a solar company loses over a set period. A healthy annual rate is 5% to 10% for service or subscription models. Reducing churn by 5 percentage points can increase profits by 25% to 95%, according to Bain & Company, because retaining an existing customer costs far less than acquiring a new one.
What Is Solar Churn Rate?
Churn rate is the share of customers who stop doing business with you during a specific period. In solar, the definition is more layered than in a simple subscription business.
A solar customer can churn in several ways:
- They cancel before installation after signing a contract.
- They complete the install but never buy maintenance, monitoring, or upgrades.
- They let a service agreement lapse and move to a competitor.
- They finance through a third party and the relationship stays with the financier, not you.
- They sell the home and the new owner removes your monitoring or service plan.
Each type of churn hurts a different part of the business. Pre-install cancellations hit sales efficiency. Post-install service churn hits recurring revenue. Low repeat purchase rates cap lifetime value. That is why smart solar operators track churn by segment instead of relying on one headline number.
Customer churn is the most common version. It asks: of the customers we had at the start of the period, how many left? Revenue churn asks a different question: how much recurring revenue left with them? A company can lose 5% of customers but 15% of revenue if the churned customers are large commercial accounts.
Why Churn Rate Matters More in 2026
The U.S. residential solar market is expected to contract by roughly 19% in 2026 after the federal residential Investment Tax Credit expired at the end of 2025, according to Wood Mackenzie. Fewer in-market buyers means higher competition for each lead. Higher competition means higher acquisition cost. When acquisition becomes more expensive, the value of keeping every customer rises.
The math is straightforward. If your customer acquisition cost is $6,000 and your gross margin per install is $3,750, you need more than one transaction from the average customer to break even on acquisition. A customer who adds battery storage, an EV charger, or annual maintenance pays back that CAC and creates profit. A customer who churns after the first install leaves you underwater.
This is the shift from single-transaction thinking to lifetime value thinking. In a growing market, you can afford to focus on new logos. In a contracting market, retention, expansion, and referrals become the main growth engine. The companies that reduce churn fastest will absorb the 2026 market contraction best.
How to Calculate Solar Churn Rate
The basic churn rate formula is simple:
Churn Rate = (Customers Lost During Period / Customers at Start of Period) × 100
If you started the quarter with 400 customers and lost 24, your quarterly churn rate is 6%.
For monthly tracking:
Monthly Churn Rate = (Customers Lost in Month / Customers at Start of Month) × 100
For annual tracking:
Annual Churn Rate = (Customers Lost in Year / Customers at Start of Year) × 100
The trap is converting monthly to annual churn by simple multiplication. A 5% monthly churn rate does not equal 60% annual churn. Because churn compounds, the correct formula is:
Annual Churn = 1 − (1 − Monthly Churn Rate)^12
A 5% monthly churn rate translates to roughly 46% annual churn. A 2% monthly rate translates to roughly 21% annual churn. This distinction matters because small monthly improvements create large annual gains.
Revenue Churn
Revenue churn measures dollars lost rather than only counting customers lost:
Revenue Churn = (Revenue Lost from Churned Customers / Total Revenue at Start of Period) × 100
If you started the month with $200,000 in recurring revenue and lost $12,000, your monthly revenue churn is 6%. Net revenue retention adds expansion revenue from customers who upgraded. A net retention rate above 100% means your installed base is growing even without new sales.
Segmenting the Number
One overall churn rate hides more than it reveals. Track churn by:
- Customer type: residential, commercial, or community solar subscriber
- Acquisition channel: referral, paid lead, door-to-door, partnership
- Product: solar only, solar plus battery, or solar plus service agreement
- Contract length: monthly, annual, or multi-year service plan
- Geography: different utility territories have different service expectations
A residential installer with strong service agreements may see 8% annual churn. A company that only installs and disappears may see 40% or higher effective churn because few customers ever return.
What Is a Good Churn Rate for Solar Companies?
There is no universal target. The right number depends on your business model. Service and subscription businesses should compare themselves to industry benchmarks. Pure installation businesses should track repeat purchase rate and referral rate alongside churn.
The average annual churn rate across all industries is 20% to 30%, according to Recurly Research. Energy and utilities have the lowest B2B churn at 11%, while logistics and retail run much higher.
For solar companies, the relevant benchmarks look like this:
| Business Model | Healthy Annual Churn | Warning Signal |
|---|---|---|
| O&M service agreement | 5% to 10% | Above 15% |
| Monitoring subscription | 7% to 12% | Above 18% |
| Solar lease or PPA portfolio | 2% to 5% | Above 8% |
| Pure installation, no ongoing service | Measure repeat purchase rate | Below 15% repeat |
A solar lease or power purchase agreement should churn very little because the customer has a long-term contract and switching is costly. A monitoring subscription should churn more because it is discretionary. An installation-only business should not obsess over a subscription-style churn number. Instead, it should measure how many past customers come back for battery retrofits, EV chargers, or referrals.
The real benchmark is economic, not statistical. If your churn rate is low but your customers never buy again or refer anyone, you may not have churn. You may have a silent retention problem masked by a lack of ongoing relationship.
The Real Reasons Solar Customers Churn
Churn is usually a symptom of a broken process, not a broken product. Solar panels are durable. Warranties are long. The customer relationship should last decades. When customers leave, the cause is most often something that happened before, during, or shortly after installation.
Expectation Mismatch on Production
The most common post-install complaint is that the system does not produce what the customer expected. This usually traces back to the sales proposal. A proposal that shows best-case production, ignores shading, or assumes perfect panel orientation sets the customer up for disappointment. When the first year falls short, trust collapses.
The fix is to model conservatively and explain variability. Show production by month, account for degradation, and note that weather causes real year-to-year swings. A customer who understands the range is less likely to churn when one month is cloudy.
Slow Response to Service Issues
Customers who wait more than 10 minutes for a first response are 50% more likely to churn within 6 months, according to Ringly. In solar, the issue is rarely speed alone. It is the gap between when the customer reports a problem and when they feel someone owns it.
A monitoring alert, a roof leak worry, or an inverter error creates anxiety. If the customer has to chase the installer, the relationship deteriorates fast. If the installer proactively identifies the issue and explains the fix before the customer calls, retention improves.
Poor Handoff from Sales to Operations
The solar sales process is long. The customer speaks to a rep, a site surveyor, a designer, a permitting coordinator, and an install crew. Each handoff is a chance to drop the relationship. Customers churn when they feel they are starting over with every new person.
A shared customer record, clear status updates, and a single point of contact reduce this friction. The companies with the lowest churn treat handoffs as a retention risk rather than a routine operational step.
Lack of Post-Installation Engagement
After permission to operate, many installers go silent. The customer has panels on the roof and an app on their phone, but no ongoing relationship. When a competitor offers a battery upgrade, monitoring service, or maintenance plan, the customer has no reason to stay loyal.
Post-install engagement does not mean spam. It means useful touchpoints: a first-month production summary, a one-year performance report, an annual maintenance reminder, and a referral request when satisfaction is highest.
Warranty Confusion
Solar warranties are complex. Product warranties, performance warranties, workmanship warranties, and inverter warranties often come from different entities. If the customer does not know who to call for a problem, they blame the installer. That blame becomes churn.
Clear documentation of who owns each warranty, for how long, and how to make a claim prevents this. The installer who explains warranties well during the close is the one the customer calls first when something goes wrong.
How to Reduce Solar Churn Rate
Reducing churn is a system, not a slogan. The most effective solar companies combine clear expectations, fast service, proactive communication, and ongoing value.
Set Production Expectations in Writing
Every proposal should include a production estimate with a confidence range, not a single number. Explain the assumptions behind the estimate: panel orientation, tilt, shading, local weather patterns, and degradation. When the system performs within the range, the customer sees you as accurate. When it exceeds the range, the customer sees you as conservative. Both outcomes protect trust.
Tools like solar design software and shadow analysis make conservative modeling easier. The more accurate your pre-sale model, the fewer post-install surprises you face.
Build a Structured Onboarding Sequence
The first 30 days after installation set the tone for the entire relationship. A structured onboarding sequence should include:
- A welcome call within 48 hours of permission to operate
- A first-month production summary comparing actual to estimated output
- A walkthrough of the monitoring app and what alerts mean
- A clear explanation of who to call for different types of issues
- A service agreement offer before the workmanship warranty period ends
Structured onboarding programs reduce early-stage churn by up to 50%, according to Gartner via GrowSurf.
Respond Fast and Resolve on First Contact
Speed matters, but first-contact resolution matters more. Customers are 2.4 times more likely to stay when their problem is solved on the first contact, according to Ringly.
For solar companies, this means training support staff to diagnose common issues without escalating. Inverter errors, monitoring disconnections, and production drops often have simple explanations. The customer who gets an answer in one call feels taken care of. The customer who is passed between departments feels ignored.
Offer Service Agreements That Create Stickiness
A service agreement turns a one-time installation into an ongoing relationship. It gives the customer scheduled maintenance, priority response, and performance checks. It gives the installer predictable recurring revenue and a reason to stay in touch.
The renewal rate for HVAC service agreements is 70% to 80% for average companies and above 90% for top performers, according to Oxmaint. Solar service agreements should aim for similar numbers. The key is to start the renewal conversation 90 days before expiration and show the customer value delivered during the year.
Turn Customers into Referral Advocates
Referred customers churn at an 18% lower rate than non-referred customers, according to Harvard Business Review via GrowSurf. Customers who refer others are also more likely to stay engaged themselves.
A structured referral program makes this repeatable. Ask for referrals within 30 days of activation, when satisfaction is highest. Provide a simple sharing link or message template. Track results and pay promptly. For a complete template, see our guide on solar referral programs.
Capture and Segment Cancellation Reasons
You cannot fix what you do not measure. Every cancellation or non-renewal should be tagged with a primary reason. The categories do not need to be complex. Start with these five:
- Price or payment issue
- Production or performance disappointment
- Service response complaint
- Moved or sold property
- Chose a competitor
Review the reasons monthly. If 40% of cancellations cite slow service response, that is your highest-leverage fix. If 30% cite production disappointment, your sales modeling needs attention. The pattern is more useful than the total number.
Also track which acquisition channel produced the churned customer. If leads from one paid source churn at twice the rate of referrals, that channel is more expensive than it looks. The full cost includes both acquisition spend and the lower lifetime value of the customers it produces.
The Hidden Cost of Silent Churn
Not all churn is loud. Some customers never complain. They simply do not come back. This silent churn is harder to measure but just as expensive.
A solar-only customer who never buys a battery, never refers a neighbor, and never calls for maintenance is a churned customer in economic terms. They occupied acquisition capacity without creating long-term value. The company broke even at best.
The signs of silent churn include:
- Low app engagement after the first month
- No response to upsell offers
- No referrals after two years
- Declined service agreement renewals
- Negative reviews posted without contacting support first
The best defense is proactive engagement. Send production reports that highlight savings. Offer battery retrofit assessments when tariffs change. Check in before the customer has a reason to look elsewhere.
Building a Retention-First Sales Process
Most solar sales processes are built to close the first deal. A retention-first sales process is built to close the first deal and the fifth. The difference shows up in how proposals are written, how handoffs are managed, and how post-install value is sold.
Design Proposals for the Long Term
A proposal should sell a relationship, not only a system. Include the path to future upgrades: battery storage, EV charging, smart panels, or expanded arrays. Show how monitoring and maintenance protect the investment. Explain financing in a way that leaves room for future purchases.
Solar proposal tools helps here by producing consistent, branded proposals that include upgrade pathways and service options. The proposal becomes a retention tool in addition to being a closing document.
Track the Right Metrics
Retention improves when it is measured. Track these metrics monthly:
- Customer churn rate by segment
- Revenue churn and net revenue retention
- Service agreement renewal rate
- Time to first response for support requests
- First-contact resolution rate
- Repeat purchase rate for upgrades and add-ons
- Referral rate from installed base
- Customer lifetime value by acquisition channel
The companies that reduce churn fastest are the ones that review these numbers as often as they review sales pipeline.
Use CRM Automation to Prevent Churn
A solar CRM can flag at-risk customers before they churn. Set triggers for:
- No monitoring login for 30 days
- Support ticket unresolved for more than 48 hours
- Service agreement expiring in 90 days
- Production below estimate for two consecutive months
- No engagement after an upsell offer
Automated workflows then assign follow-up tasks to the right person. For more on building these workflows, see our guide on solar CRM workflow automation.
See How SurgePV Supports Retention From Design to Post-Install
Accurate designs, fast proposals, and clear production models help solar companies set expectations that customers trust. Book a demo to see the full workflow.
Book a DemoNo commitment required · 20 minutes · Live project walkthrough
Solar Churn Rate and Customer Acquisition Cost
Churn and customer acquisition cost are two sides of the same unit economics equation. The lower your churn, the more value you extract from each acquired customer. The higher your churn, the more you spend replacing customers you already paid to win.
A 5% improvement in customer retention can increase profits by 25% to 95%, according to Bain & Company. In solar, where CAC is one of the largest cost categories, this multiplier is even more powerful.
Consider two identical installers. Each spends $6,000 to acquire a customer. Each earns $3,750 in gross margin on the first install. Installer A has 20% annual churn and no repeat business. Installer B has 8% annual churn and 30% of customers add a battery or refer a neighbor within three years.
Installer A must acquire a new customer for every dollar of growth. Installer B grows from its installed base. The gap in capital efficiency is enormous. The difference is not the product. It is the retention system.
A Hypothetical Example
Imagine a residential installer with 1,000 active customers at the start of the year. The company has a 15% annual churn rate. That means 150 customers leave. To grow by just 10%, it must acquire 250 new customers: 150 to replace churn and 100 to grow.
At $6,000 CAC, that is $1.5 million in acquisition spend. If the company reduces churn to 8%, it loses only 80 customers. To grow 10%, it now needs 180 new customers. Acquisition spend drops to $1.08 million. The $420,000 savings flow almost directly to profit because the retained customers were already acquired.
This example is hypothetical, but the mechanics are real. Every percentage point of churn reduction lowers the acquisition treadmill.
What Most Solar Companies Get Wrong
The most common mistake is treating churn as a customer service problem after the fact. By the time a customer complains, the damage is often done. The real work of reducing churn happens before the sale and in the first 90 days after installation.
Another mistake is measuring churn too slowly. Annual churn reviews hide problems that build over quarters. Monthly churn tracking, segmented by acquisition channel and product, surfaces issues while they are still fixable.
A third mistake is ignoring revenue churn. A company can celebrate low customer churn while losing its most valuable accounts. Customer churn and revenue churn must be reviewed together.
Finally, many installers fail to connect retention to sales incentives. Sales reps are paid to close deals, not to set expectations that reduce churn. Compensation plans should include post-install satisfaction, referral generation, or service agreement attachment. When retention becomes a sales KPI, behavior changes.
Frequently Asked Questions
What is solar churn rate?
Solar churn rate is the percentage of customers who stop doing business with a solar company during a specific period. It includes customers who cancel before installation, do not renew service agreements, or switch to another provider for maintenance, monitoring, or upgrades.
How do you calculate solar churn rate?
Divide the number of customers lost during a period by the number of customers at the start of that period, then multiply by 100. For example, if you started the quarter with 400 customers and lost 24, your quarterly churn rate is 6%. Annual churn compounds from monthly churn using the formula 1 minus (1 minus monthly churn rate) to the power of 12.
What is a good churn rate for a solar company?
A healthy annual churn rate for a solar service or subscription business is 5% to 10%. Pure installation businesses measure churn differently, often through repeat purchase rate and referral rate rather than subscription-style attrition. Any rate above 15% annually signals a retention problem.
Why do solar customers churn?
The top reasons are poor communication during the sales process, missed production expectations, slow response to service issues, lack of post-installation engagement, and unclear ownership of warranties. A single bad experience causes 32% of customers to leave a brand they otherwise liked, according to PwC.
How can solar installers reduce churn?
Installers can reduce churn by setting clear production expectations, automating post-install follow-up, offering service agreements, responding to service requests within hours rather than days, and turning satisfied customers into referral advocates.
How does churn affect solar customer acquisition cost?
High churn forces a company to replace customers it just spent money to acquire. With residential solar customer acquisition cost at $0.84 to $0.87 per watt, losing a customer before repeat or referral value is realized makes unit economics worse. Lower churn directly improves lifetime value and CAC payback.
What is the difference between customer churn and revenue churn?
Customer churn counts the percentage of customers lost. Revenue churn measures the percentage of recurring revenue lost from those customers. A small customer churn number can hide a large revenue churn number if the lost customers are high-value commercial accounts.
Where this fits
This article is part of SurgePV's Solar Business & Operations hub, which works through the topic from first principles to the decisions a project team actually has to make.

