Quick Answer
Solar customer acquisition costs in 2026: door-to-door $1,500–$3,000, digital leads $800–$1,500, referrals $300–$600, and partnerships $500–$1,000 per customer. US residential CAC averages $3,000–$5,000. Reducing CAC through digital marketing and referral programs improves installer margins by 15–25%.
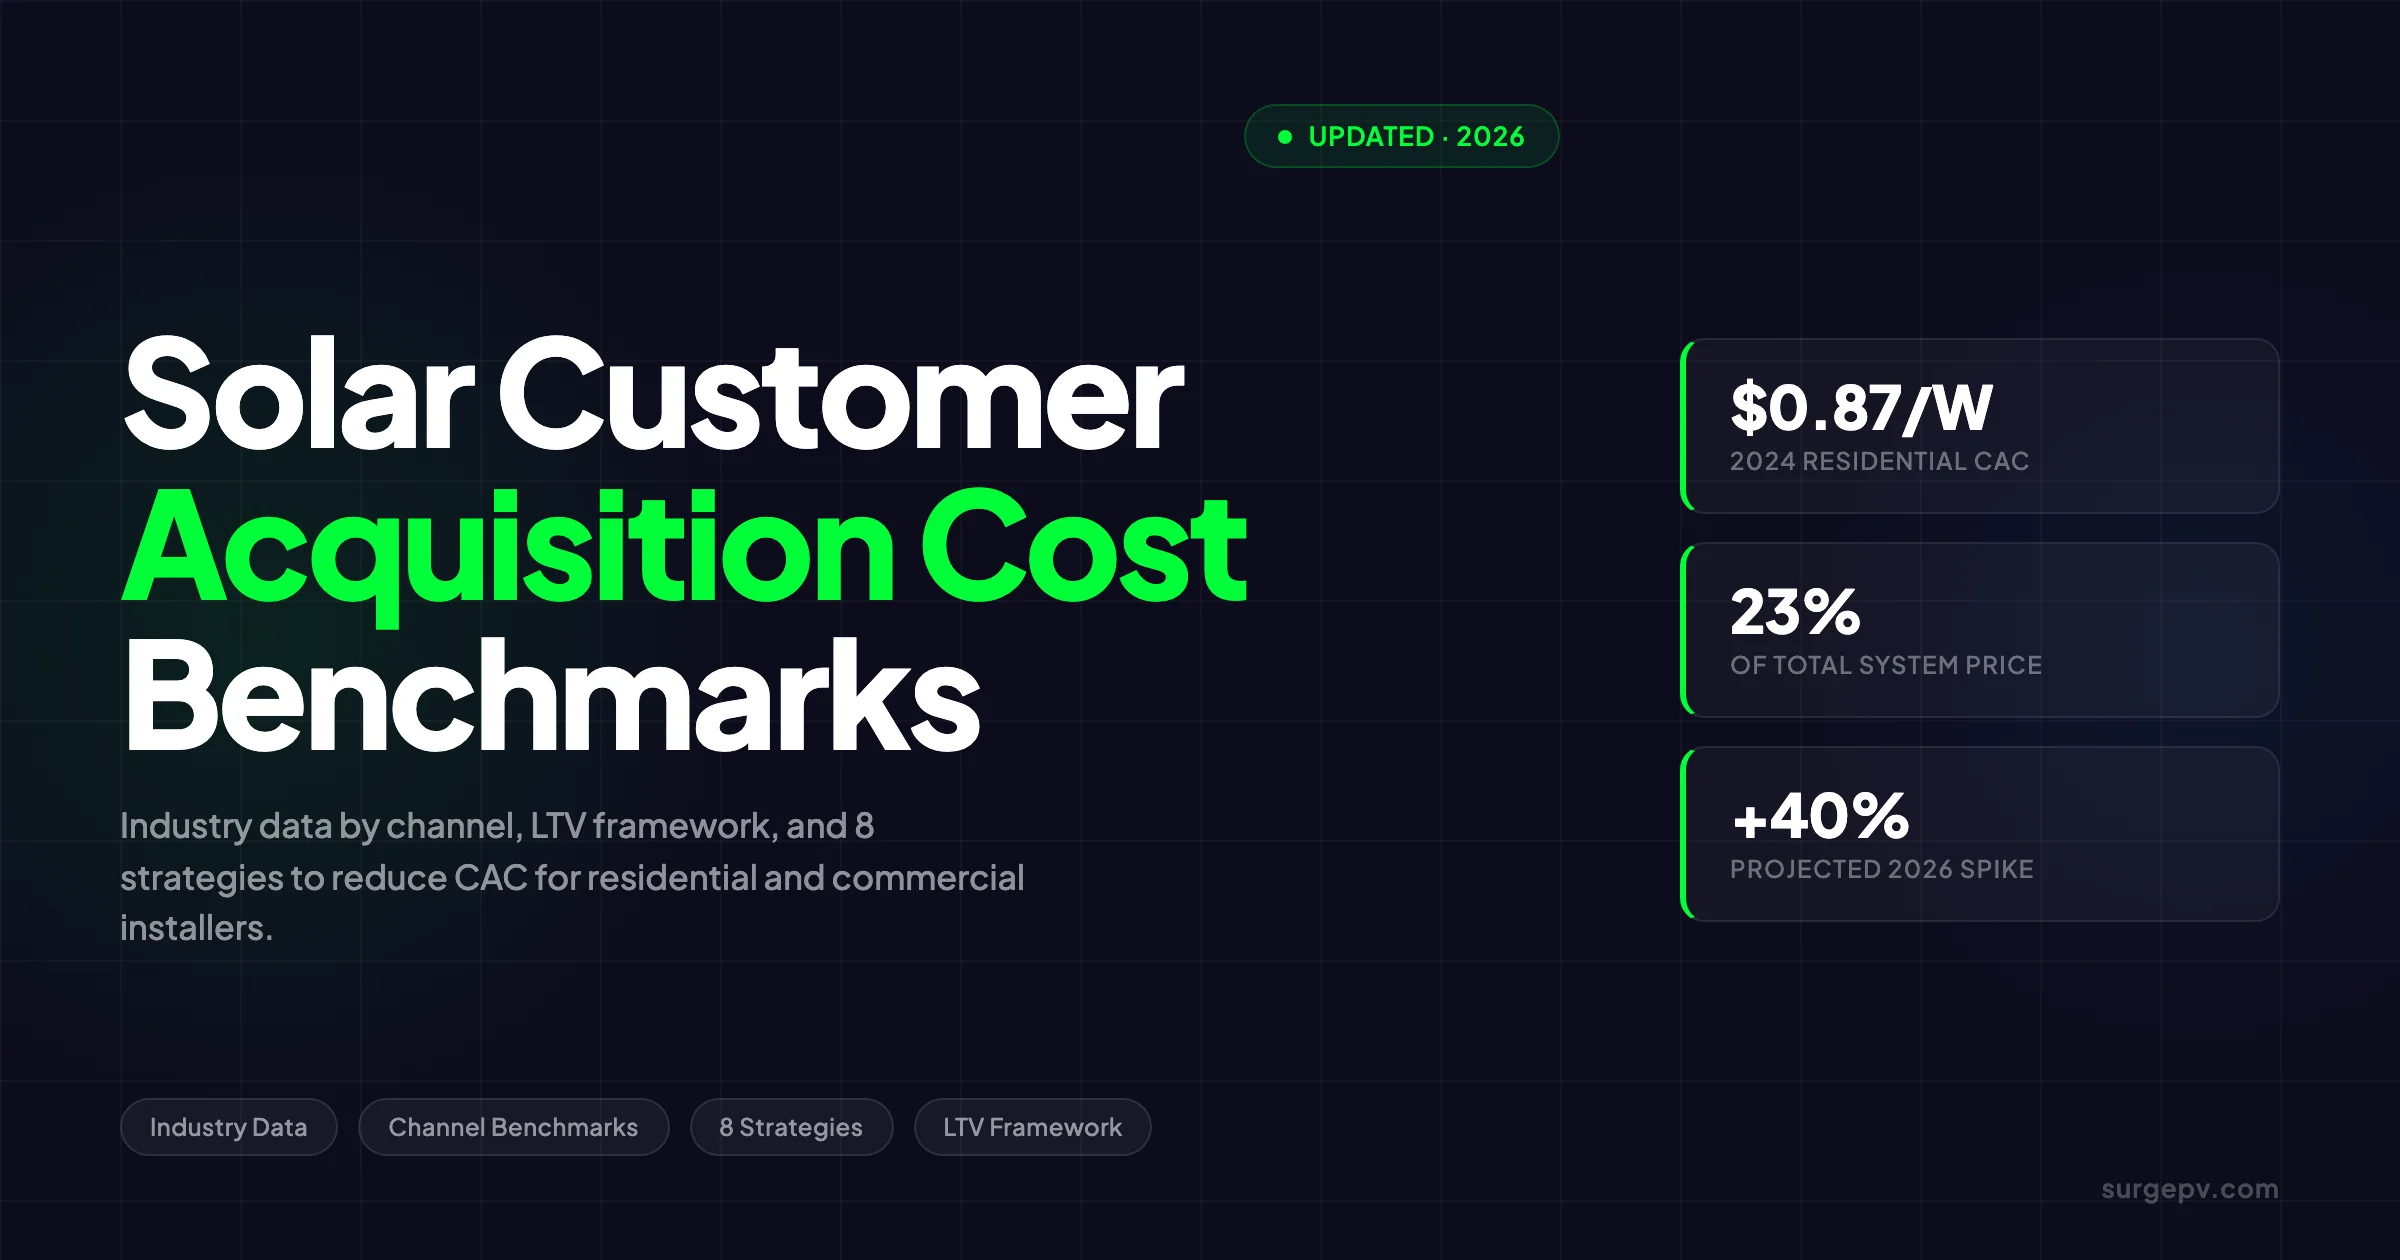
Solar customer acquisition cost (CAC) is now the single largest cost category in residential solar — in 2024, it topped $0.87 per watt, exceeding the cost of the panels themselves for the first time. For a typical 7kW residential system, that translates to roughly $6,100 in acquisition spend before installation even begins. Understanding where those costs come from, which channels produce the best return, and how to systematically reduce them separates solar businesses that grow profitably from those that grow themselves broke.
Solar customer acquisition costs in 2026: door-to-door $1,500–$3,000, digital leads $800–$1,500, referrals $300–$600, and partnerships $500–$1,000 per customer. US residential CAC averages $3,000–$5,000. Reducing CAC through digital marketing and referral programs improves installer margins by 15–25%.
Solar customer acquisition costs in 2026: door-to-door $1,500–$3,000, digital leads $800–$1,500, referrals $300–$600, and partnerships $500–$1,000 per customer. US residential CAC averages $3,000–$5,000. Reducing CAC through digital marketing and referral programs improves installer margins by 15–25%.
This guide covers industry benchmarks from NREL and Wood Mackenzie data, a channel-by-channel breakdown of lead cost versus effective cost-per-acquisition, the LTV model solar companies use to justify acquisition spend, and eight strategies that installers are using today to cut costs without shrinking their pipeline.
TL;DR — Solar Customer Acquisition Cost
Residential solar CAC hit $0.87/Wdc in 2024 and is projected to spike 40% in 2026 following the expiration of the federal residential tax credit. Referrals cost under $1,000 per completed installation; purchased leads run $1,000 to $2,500; door-to-door often exceeds $2,000 all-in before commissions. The minimum benchmark LTV:CAC ratio is 3:1. Most companies undercount their true CAC by excluding commissions from the calculation.
What Is Solar Customer Acquisition Cost?
Solar customer acquisition cost is the total spend required to convert one prospective buyer into a paying, installed customer. It includes every expense across the sales and marketing stack: lead generation fees, sales commissions, proposal preparation time, site assessments, follow-up communications, marketing overhead, and the cost of all deals that don’t close.
The standard formula:
CAC = Total Sales & Marketing Spend ÷ Number of Completed Installations
This sounds straightforward. In practice, three common errors make most companies’ reported CAC figures unreliable:
Excluding commissions. Solar commissions range from 5 to 10% of total contract value — often $1,500 to $3,500 per deal. Many installers track commissions in the operations budget rather than the sales budget, which makes CAC look artificially low. The commission is a direct cost of winning that customer. It belongs in the CAC calculation.
Using signed contracts rather than completed installations in the denominator. Some companies calculate CAC per signed contract. This understates true CAC because cancellations — which run 15 to 25% of signed deals in markets with long permit timelines — return zero revenue while consuming 100% of the acquisition cost. A $3,000 CAC against signed contracts becomes $3,750 against completed installs at a 20% cancellation rate.
Not allocating overhead. Sales manager salaries, CRM software costs, and marketing agency retainers should be allocated to CAC. Treating them as fixed overhead independent of deal volume understates the true marginal cost of each new customer.
A correct CAC calculation uses completed, energized installations as the denominator, includes commissions, and allocates a reasonable share of overhead to the acquisition cost line.
Pro Tip
Track “gross CAC” (all spend ÷ all leads) and “net CAC” (all spend ÷ completed installs) separately. The gap between them reveals your cancellation and no-close problem — not just your lead generation efficiency.
Solar CAC Benchmarks: Industry Data from 2018 to 2026
The historical trend in solar CAC is a frustrating one. While hardware costs have fallen over 90% since 2010, customer acquisition costs have moved in the opposite direction — rising almost every year since 2018.
| Year | CAC ($/Wdc) | Industry Notes |
|---|---|---|
| 2018 | $0.30–$0.44 | NREL benchmark; $0.44/W for full-service companies |
| 2021 H1 | $0.75 | +9.2% vs. 2018–2020 average; rose faster than hardware fell |
| 2022 H1 | $0.72 | Modest stabilization during market expansion |
| 2023 H1 | $0.85 | Record high at the time; +13% YoY |
| 2024 Q4 | $0.87 | +8% YoY; exceeds module cost for first time |
| 2025 | $0.60 | Five-year low; ITC pull-forward demand surge + AI tools |
| 2026 (projected) | $0.84 | +40% from 2025 baseline; federal ITC expiration effect |
Sources: Wood Mackenzie CAC Outlook 2026; NREL Solar Soft Costs Analysis
In dollar terms at a typical 7kW residential system:
| Year | Estimated CAC Per Installation |
|---|---|
| 2013 | ~$5,373 (NREL industry study) |
| 2021 | ~$5,250 |
| 2024 | ~$6,090 |
| 2026 (projected) | ~$5,880 |
Key Takeaway
In 2021, CAC represented 23% of the total residential system price — higher than the module cost. By 2024, Wood Mackenzie data shows it had become the single largest line item in the residential cost stack, a position previously held by installation labor.
The 2025 dip is real but temporary. Wood Mackenzie attributes it to an ITC pull-forward rush (the 30% federal residential tax credit was set to expire, accelerating buyer decisions) combined with AI-enabled sales tools that compressed cost-per-appointment. The 2026 rebound reflects market contraction: with the credit gone, fewer homeowners are in-market, so installers compete harder for fewer available buyers.
How Solar CAC Compares to Other Industries
Solar CAC is structurally higher than nearly every other consumer product category:
| Industry | Average CAC | CAC as % of Average Revenue |
|---|---|---|
| Retail (general) | ~$10 | 1–3% |
| Automotive | ~$1,000 | ~4% |
| Financial services | ~$400 | Varies |
| B2B SaaS | ~$800–$1,200 | 10–20% |
| Residential solar (national) | $4,000–$6,000+ | 15–30% |
| Residential solar (local) | $1,500–$3,500 | 8–15% |
Bodhi Solar’s analysis puts solar CAC at up to 30% of average revenue for national installers — compared to 4% for the auto industry. Long-tail local installers average roughly 15%.
This comparison matters for two reasons. It explains why solar company margins are thin even at healthy system prices. And it shows why CAC reduction is the highest-leverage business improvement most installers can make: a 30% reduction in CAC is worth more to the bottom line than a 30% increase in average system price, because CAC reduction flows directly to margin while price increases are partially offset by competitive pressure. For the latest details on France, see Agricultural Solar Case Study. For France-specific information, see Floating Solar Farms France.
Solar CAC by Channel: Lead Cost, Conversion Rate, and Effective CPA
Most discussions of solar lead costs stop at cost-per-lead (CPL). The number that actually determines profitability is effective cost-per-acquisition (effective CPA) — the total spend required to produce one installed customer from each channel, after accounting for conversion rates at every stage of the funnel.
| Channel | Cost Per Lead | Lead-to-Sale Conversion | Effective CPA |
|---|---|---|---|
| Referrals | $0–$50 (+ bonus $250–$500) | 29–37% | $500–$1,000 |
| Events / trade shows | $10–$50 | Varies | $500–$2,000 |
| SEO / organic content | ~$196 avg | 10–20% | $1,000–$2,000 |
| Facebook / Instagram ads | $30–$100 | 5–12% | $1,000–$2,500 |
| Exclusive purchased leads | $100–$200 | 8–15% | $750–$2,000 |
| Google Search Ads | $100–$300 | 8–15% | $1,000–$3,000 |
| Shared purchased leads | $20–$100 | 3–5% | $1,000–$2,500 |
| Set appointments | $150–$200 | 15–25% | $750–$1,500 |
| Door-to-door canvassing | $20–$50 | ~10% appointment rate | $1,500–$4,000+ |
| Telemarketing | $100–$300 | 1–3% | $3,000–$8,000+ |
Sources: Rocket Launch Media CPL Benchmarks; LeadGen Economy Solar Guide
Several patterns get missed when companies look only at CPL:
Referrals are dramatically undervalued. A $30 to $50 Facebook lead looks cheaper than a $250 to $500 referral bonus. But referrals convert at 29 to 37% versus 5 to 12% for social ads — producing an effective CPA that is often 3 to 5x lower for referrals. Referral customers also cancel less frequently and add battery storage at higher rates. See Adding Battery Storage Services for detailed guidance.
Door-to-door economics are worse than published CPL figures suggest. The quoted CPL of $20 to $50 reflects canvassing cost only. Add sales commissions, appointment no-show rates, proposal preparation time, and management overhead — and true effective CPA for D2D exceeds $4,000 in competitive markets. This is the core reason large national installers that depend heavily on D2D consistently run higher CAC than local operators using referrals and digital.
Geographic variation is extreme. LeadGen Economy data shows CPL varies 8.5x between California ($150 to $300+) and low-market states ($25 to $50). An identical lead costs $1,929 in California and $225 in North Dakota — a difference that makes national channel benchmarks unreliable in any single geography. The CPL tiers by market maturity:
| Market Tier | States | CPL Range | Channel Implication |
|---|---|---|---|
| Tier 1 (premium) | CA, HI, MA, NY | $150–$300+ | SEO + referrals dominate; D2D expensive |
| Tier 2 (strong) | TX, FL, AZ, NJ, CO | $75–$150 | Balanced mix; Google Ads viable |
| Tier 3 (developing) | NV, UT, NM, IL, VA, NC, GA | $40–$75 | D2D + digital cost-effective |
| Tier 4 (emerging) | Most Midwest / Mountain | $25–$50 | Channel optionality; referrals dominant |
| Tier 5 (thin market) | ND, SD, WY, Appalachia | Under $25 | Most paid channels unprofitable |
In Tier 1 markets, paid CPL is so high that only referrals and organic content sustain profitability at scale. In Tier 3 and 4 markets, D2D and Google Ads remain viable, and referral programs function as margin enhancement rather than survival strategy.
Speed matters more than channel selection at the point of lead receipt. Contacting a lead within 1 minute of submission increases conversion by approximately 400%. Across all channels, 78% of solar customers choose the first company that responds. This means response infrastructure — automated CRM triggers, SMS within 60 seconds — captures more value than channel optimization alone.
Key Takeaway
Evaluate channels on effective CPA — cost per completed installation — not cost per lead. A $200 exclusive lead converting at 12% costs $1,667 per installation. A $40 shared lead at 3% conversion costs $1,333 per installation on paper, but adds high follow-up volume and fraud exposure that compound real-world costs well above that figure.
For a deeper look at how conversion rates vary by lead source and sales process stage, see solar proposal win rate benchmarks.
Why Solar CAC Is Structurally High
Solar CAC has stayed elevated despite falling hardware costs because the problem is not in the panels — it is in the sales model. Five structural factors drive acquisition costs above what the fundamentals would justify.
Cancellations Inflate Effective CAC
A cancellation costs 100% of the acquisition investment but generates zero revenue. Cancellation rates typically run 15 to 25% of signed contracts in markets with long permit timelines (California, New York, Massachusetts) and spike during high-interest-rate environments when financing approvals fall through after signing.
A company with a 20% cancellation rate must sign 25% more contracts to hit the same installed volume — which means 25% more acquisition spend for the same number of energized systems. Reducing cancellations from 20% to 15% cuts effective CAC by approximately 6% with no other changes.
Channel Dependence on Door-to-Door
The largest national and regional installers built their growth on door-to-door sales and retail partnerships. Wood Mackenzie identifies these as “the most expensive sales channels” in the industry. Despite this, many companies have been slow to shift budgets toward digital and referral channels, which carry a fraction of the effective CPA. The incumbency cost — retrained sales teams, altered commission structures, redrawn territories — is real, but so is the long-term profitability gap.
High Sales Commissions
Solar sales commissions range from $200 to $400 per kW installed, or 5 to 10% of total contract value. On a 7kW system at $30,000, that is $1,500 to $3,000 per deal in commissions alone — before any marketing spend is counted. Commission structures also create misaligned incentives: representatives optimize for signed contracts, not installed systems. This inflates signed-but-cancelled volume, which in turn inflates effective CAC.
For a detailed breakdown of how commission structures affect company profitability, see solar sales commission guide.
Complex, Multi-Touch Sales Process
The residential solar sales funnel is long: ad impression → lead form → qualification call → consultation → proposal → proposal follow-up → signed contract → site survey → permit filing → installation scheduling. Each stage costs money. Most prospects exit before reaching final stages, and every exit point multiplies the cost of the customers who do convert.
The full solar sales process from lead to installation involves 7 distinct stages — each of which has its own conversion benchmark and optimization lever.
Market Stigma and Trust Barriers
High-pressure D2D tactics and high-profile installer bankruptcies have created consumer skepticism that requires more touchpoints to overcome. Every additional follow-up adds cost. Companies that invest in brand credibility — verified reviews, published case studies, transparent pricing — typically see higher conversion rates and lower all-in CAC as a result of fewer stalled deals.
Solar CAC by Installer Type
Local installers consistently outperform national chains on acquisition cost:
| Installer Type | CAC Range ($/W) | Primary Channels |
|---|---|---|
| National / large regional | $0.60–$1.00+ | D2D, retail partnerships, telemarketing |
| Mid-size regional | $0.40–$0.70 | Mixed: digital + D2D |
| Local operators | $0.25–$0.45 | Referrals, organic search, community events |
| Local with referral focus | $0.15–$0.30 | Primarily referrals + organic content |
Sources: Greentech Renewables installer segment analysis; Wood Mackenzie distributed solar data
The pattern is consistent: local installers that build referral engines and invest in organic content achieve CAC 50 to 60% lower than national brands in the same market. The trade-off is volume — referral and organic channels do not scale as fast as media buys or D2D canvassing. For installers focused on margin rather than growth-at-all-costs, the channel math strongly favors local digital and referral strategies.
For context on what drives profitability beyond CAC, see solar installer profit margins for a full unit economics walkthrough, and solar business profitability guide for how acquisition cost flows through to net margin.
The LTV:CAC Framework for Solar Companies
CAC only makes sense relative to customer lifetime value (LTV). A $4,000 CAC is unsustainable for a company selling $15,000 systems on 8% margin. The same $4,000 CAC is highly profitable for a company selling solar-plus-battery-plus-EV-charger packages at $48,000 on 20% gross margin.
The standard benchmark: LTV:CAC ratio of 3:1 or higher.
For residential solar, the math looks like this:
| Customer Type | System Value | Gross Margin % | LTV (Margin $) | Max Sustainable CAC (3:1) |
|---|---|---|---|---|
| Solar only | $25,000 | 15% | $3,750 | $1,250 |
| Solar + battery | $38,000 | 18% | $6,840 | $2,280 |
| Solar + battery + EV charger | $48,000 | 20% | $9,600 | $3,200 |
| Multi-product + referral value | $55,000+ | 22% | $12,100 | $4,033 |
Battery attachment rates in California now exceed 79%. As storage adoption grows nationally, the LTV per customer rises — which directly increases the acquisition budget a company can sustain while maintaining a 3:1 ratio. This is the financial logic behind product portfolio expansion: it does not just add revenue, it changes the economics of customer acquisition.
Key Takeaway
Adding battery storage to your product mix does not just improve per-job revenue — it changes what you can afford to spend on acquisition. A solar-only company at 15% margin can justify ~$1,250 CAC. The same company selling solar plus storage at 20% margin can justify $3,200 CAC — a 156% higher acquisition budget to compete for the same customer.
Beyond single-job LTV, referral value should be incorporated into the model. A customer who generates 1.5 referrals over their first 3 years adds meaningful additional LTV — typically $500 to $1,500 in acquisition cost savings per referral generated. This further shifts the economics toward investing in customer experience and post-installation engagement.
For building financial models around customer ROI and system performance that feed into the sales process, the generation and financial tool gives installers real project economics to anchor the customer conversation.
Cut Proposal Time. Close More Deals. Reduce CAC.
SurgePV’s solar design and proposal software cuts proposal turnaround from hours to minutes — faster proposals mean higher close rates and lower effective acquisition cost per installation.
Book a DemoNo commitment required · 20 minutes · Live project walkthrough
For a direct comparison, see Arka 360 vs SurgePV.
8 Proven Strategies to Reduce Solar Customer Acquisition Cost
1. Build a Structured Referral Program
Referrals are the highest-converting, lowest-cost channel in solar. Sunvoy’s analysis shows that doubling referral volume can cut acquisition costs by nearly 50%. The conversion rate (29 to 37%) is 3 to 6x higher than purchased leads (5 to 8%), and referral customers cancel less often and add storage at higher rates.
Most installers have an informal referral policy (“ask happy customers for names”). A structured program changes that:
- A defined incentive: $250 to $500 per successful referral, paid at installation (not at signing — this aligns your incentive with completed deals, not cancellable contracts)
- Automated trigger communications: email at 30 days post-install, 6 months, and a “solarversary” outreach at 12 months — the last of these is particularly effective at generating referral conversations
- A branded referral portal or landing page that captures the referral’s contact information directly, removing friction from the customer’s end
- Sales rep accountability: each rep is responsible for a minimum referral rate from their closed deals, tracked monthly
Referral bonuses feel expensive at $500. But $500 per acquisition compares favorably to $1,000 to $3,000 for purchased leads at half the conversion rate.
2. Invest in SEO and Content Marketing
SEO generates leads at approximately $196 average CPL with higher conversion than purchased leads and long-term ROI of 500 to 748% (Rocket Launch Media data). Unlike paid channels, organic search compounds: a page ranking on the first page today continues generating leads without additional spend.
The strategy: publish content targeting high-intent local searches (“solar installers [city],” “solar cost [state],” “solar panel payback [region]”) and build topical authority in your install geography. For a full channel breakdown, see marketing for solar installers and solar company marketing.
Solar design software like SurgePV gives installers accurate system specifications and production data they can publish as credibility signals — real project performance figures that outperform generic marketing claims in content that actually ranks.
3. Move from Shared Leads to Exclusive Inbound
Shared leads — sold to 3 to 5 installers simultaneously — have a 25 to 35% fraud rate and convert at only 3 to 5%. Exclusive inbound leads (generated by your own ads or content) convert at 8 to 15% with no fraud exposure.
The math: 100 shared leads at $40 each = $4,000 spend, 3 to 5 deals, $800 to $1,333 effective CPA before commissions. 100 exclusive leads at $150 each = $15,000 spend, 10 to 15 deals, $1,000 to $1,500 effective CPA before commissions. Exclusive leads are roughly cost-neutral on a per-installation basis while producing 2 to 3x the installed volume and dramatically less wasted follow-up time.
The hidden cost of shared leads is the sales time spent chasing unqualified, duplicate, and fraudulent inquiries — time that has an opportunity cost measured against what those reps could close on better leads.
4. Automate Lead Nurture With CRM Workflows
78% of solar customers choose the first company that responds to their inquiry. Most installers respond within hours, not minutes. An automated CRM workflow that fires an SMS and personalized email within 60 seconds of form submission — followed by a structured 7-day nurture sequence — captures deals that otherwise go to faster competitors.
Email drip campaigns for solar show 80% higher open rates than cold outreach. A sequence covering system sizing overview, local financing options, customer testimonials, and a proposal invitation runs without manual effort and keeps prospects engaged through the typical 2 to 4 week consideration window.
The 7-day sequence structure that works:
- Day 0: Instant confirmation + preliminary system size estimate
- Day 1: Local solar savings estimate with real numbers
- Day 2: Financing options overview
- Day 3: Customer testimonial or case study from the same city/state
- Day 5: Proposal invitation with scheduling link
- Day 7: Follow-up if no scheduling action
For CRM tools built specifically for solar pipelines, see best solar CRM for installers.
5. Cut Proposal Time With Solar Design Software
A proposal that takes 4 hours to produce costs money whether the deal closes or not. Solar proposal software cuts proposal time from 4 hours to under 20 minutes. At 100 proposals per month, that is 300+ hours of recovered sales capacity — which means handling more leads at the same staffing level, or maintaining the same volume with a leaner team.
Speed also affects close rates directly: proposals delivered within 24 hours of the initial consultation close at significantly higher rates than those delivered 3 to 5 days later, because homeowner interest is highest immediately after the consultation. Proposal delay is one of the most common causes of a warm lead going cold.
See how solar proposal software increases sales for documented data on proposal speed versus close rates across installer segments.
Solar software that integrates design, financial modeling, and proposal generation into a single workflow removes the handoffs between design team and sales team that create the majority of proposal delay.
6. Reduce Cancellation Rates
A 15 to 25% cancellation rate inflates effective CAC by 18 to 33% compared to a company with near-zero cancellations. Cancellation drivers include: long permit timelines, financing approval failure, buyer’s remorse from high-pressure sales, and change in homeowner circumstances after signing.
Tactics that reduce post-signing cancellations:
- Use financing pre-qualification before the contract is signed (not after) to eliminate approval fall-through as a cancellation driver
- Set realistic installation timelines at signing — undersell and overdeliver rather than promising 6 weeks when the average is 12
- Send installation milestone updates during permit delays to keep customers engaged and prevent the “I forgot I signed this” cancellation
- Follow up within 48 hours of signing to reinforce the decision and answer questions before doubt sets in
A 5-point reduction in cancellation rate (from 20% to 15%) reduces effective CAC by approximately 6% with no change in marketing spend.
7. Restructure Sales Commissions
Commissions at 8 to 10% of contract value are expensive — but the bigger problem is the incentive misalignment. Reps maximize signed contracts; the company needs installed systems. A commission structure that pays 60% at signing and 40% at installation completion aligns rep behavior with outcomes that actually generate revenue.
This structure has a second benefit: it gives reps a direct financial incentive to help reduce post-signing cancellations by maintaining customer relationships through the installation timeline — follow-up calls, permit status updates, and expectation-setting that reduce buyer’s remorse.
8. Build Post-Installation Brand Presence
The biggest missed CAC reduction opportunity is the installed base. A homeowner who had a positive installation experience will refer an average of 2 to 3 neighbors over the following 12 months — if they remember your company’s name when the conversation comes up. The problem: most installers complete the job and disappear.
Tactics to maintain presence without being intrusive:
- Branded system monitoring portal (not a generic third-party dashboard) keeps your brand visible daily when the homeowner checks their production
- Monthly performance email with production data + a naturally embedded referral link
- “Solarversary” outreach at 12 months post-installation — proven to generate referral conversations in a context where the homeowner is positively reflecting on their purchase
- Yard sign requests during and after installation, with the homeowner’s permission
Every referral from an existing customer costs $250 to $500 in bonus — compared to $1,000 to $3,000 for a purchased lead at half the conversion rate. The installed base is a perpetual lead generation asset that most installers underuse.
Building Your Channel Mix: A Practical Framework
No single channel works for every installer. The right mix depends on your market, team structure, and growth stage. Here is a starting framework based on what consistently outperforms across installer types:
For local and regional installers (under 500 installs/year):
| Channel | Budget Share | Rationale |
|---|---|---|
| Referral program | 25–30% | Highest conversion, lowest effective CPA |
| SEO + content | 20–25% | Compounds over time; builds brand authority |
| Google Search Ads | 15–20% | High-intent leads; scalable but expensive |
| Facebook / Instagram | 10–15% | Volume at moderate CPL; requires strong creative |
| Events + community | 10–15% | Low cost, high trust; works well in tight geographies |
| Purchased leads | 5–10% | Use only exclusive or set-appointment leads |
For national and large regional installers (1,000+ installs/year):
| Channel | Budget Share | Rationale |
|---|---|---|
| Door-to-door | 20–30% | Scale channel; high cost but high volume |
| Digital advertising | 25–30% | Programmatic + search; measurable at scale |
| Retail partnerships | 15–20% | Captured demand; reduces canvassing dependency |
| Referral program | 10–15% | Underutilized at scale; high-leverage for margin improvement |
| SEO + content | 10–15% | Brand protection + inbound at lower CPL |
The channel mix that most improves economics over time shifts budget progressively toward referrals and organic — not because D2D or paid media stop working, but because referral and organic channels have no marginal cost floor. Paid channel CPL rises with competition; referral CPL stays constant regardless of market dynamics.
Key Takeaway
Most installers underinvest in referrals relative to paid channels because referrals feel slower to scale. The data does not support that instinct: a referral program at steady state generates a consistent percentage of your installed base as new leads each month, with no media budget dependency. It scales with your install volume, not with your ad spend.
One practical test: run your channel-specific CAC calculation for the past 90 days and rank each channel by effective CPA. Then ask which channels you can realistically increase investment in — and whether those channels are currently at the top or bottom of your CPA ranking. That gap is where the optimization opportunity sits.
How to Track and Optimize Solar CAC Over Time
Tracking CAC correctly requires three separate metrics, not a single blended number:
Blended CAC — total sales and marketing spend ÷ total completed installations. This is the headline number that appears in company financials.
Channel-specific CAC — the same calculation applied individually to each lead source. This reveals which channels to scale and which to cut. Most installers find, when they measure this for the first time, that their highest-volume lead source (often purchased lists) has a CAC 2 to 4x higher than they assumed, while referrals — which appear “free” — have a measurable but substantially lower all-in cost.
Cohort CAC — group customers by acquisition month and track their 12-month revenue and LTV. This reveals whether low-CAC channels are producing valuable customers or cheap single-transaction ones. Referral customers typically show higher LTV not just because they are cheaper to acquire, but because they cancel less, add products at higher rates, and generate more referrals of their own.
Build a monthly dashboard that tracks: Leads by channel → Appointments set → Proposals delivered → Contracts signed → Cancellations → Completed installs. Track conversion at each stage. The stage with the largest drop-off is your highest-leverage improvement point — and it is rarely the lead generation stage you are already focused on.
For business scaling decisions built on CAC and LTV data, see solar business growth strategies, which covers how to use these metrics to make channel investment decisions as you scale.
Pro Tip
Calculate your “CAC payback period” — how many months of margin it takes to recover the acquisition cost of each new customer. For residential solar at 15% margin on $30,000, a $3,000 CAC pays back in about 8 months of ownership. This metric makes CAC budget discussions with leadership concrete rather than abstract.
2026 CAC Outlook: What the Data Shows
Wood Mackenzie projects a 40% CAC spike in 2026, driven by the expiration of the 30% federal residential tax credit (Section 25D) at the end of 2025. The mechanism: the credit’s expiration reduces total buyer demand by an estimated 19%, which means more competition for fewer in-market customers — driving up the marginal cost of each acquisition as installers bid against each other for a shrinking pool.
For community solar, Wood Mackenzie’s subscriber acquisition cost (SAC) data shows a different trend: a 12% YoY decline in 2025 to $69/kW average, with further declines projected through 2030 as subscriber acquisition processes mature. See Community Solar Business Model for detailed guidance.
For residential installers, the implications are specific:
Companies dependent on purchased leads and D2D will absorb the full 40% CAC spike because their cost structure scales with market competition. Companies that enter 2026 with a high share of referral and organic inbound traffic are largely insulated — their acquisition costs are determined by their own systems, not by market-wide bidding dynamics.
The 2026 spike is also a market structure event. Installers that cannot weather higher CAC during a demand contraction will exit or consolidate — which means the surviving companies will face less competition in 2027 and beyond. Building a low-CAC acquisition model now is both a margin protection strategy for 2026 and a competitive positioning move for the recovery.
Conclusion
Three actions with the most direct leverage on solar customer acquisition cost:
- Build a referral program with structured incentives and automated trigger outreach. Referrals convert at 29 to 37% and cost under $1,000 per installation all-in. No other channel produces comparable effective CPA, and the compounding value of a referral customer — who cancels less, buys more, and refers further — makes the math even more favorable over time.
- Recalculate your true CAC — including commissions and completed installations (not signed contracts) in the denominator. Most installers are working with a number that understates actual acquisition cost by 20 to 40%. The correct number changes which channels look viable and which need to be cut.
- Measure channel-specific CAC monthly and reallocate budget toward the lowest effective CPA. For most local and regional installers, this means shifting spend from purchased shared leads and D2D toward SEO, referrals, and exclusive inbound channels before the 2026 market contraction forces the issue.
Frequently Asked Questions
What is the average solar customer acquisition cost?
In 2024, residential solar CAC averaged $0.87/Wdc — roughly $5,200 to $6,100 for a 6 to 7kW system. This makes solar one of the most expensive consumer product categories by acquisition cost, exceeding automobile sales as a percentage of revenue.
Why is solar customer acquisition cost so high?
Solar CAC is high because of expensive sales channels (door-to-door, retail partnerships), high sales commissions (5 to 10% of contract value), a complex multi-step sales process, market oversaturation in competitive states, and high cancellation rates that inflate cost per completed installation.
How do you calculate solar customer acquisition cost?
True solar CAC = (total sales and marketing spend + commissions + lead costs + overhead allocation) divided by number of completed installations in the same period. Many companies undercount by excluding commissions or overhead allocation, which produces a misleadingly low figure.
What is a good LTV to CAC ratio for a solar installer?
A 3:1 LTV:CAC ratio is the minimum benchmark. For residential solar, this means sustainable CAC sits between $1,250 and $3,200 depending on gross margin and whether storage is included in the product mix.
What is the cheapest solar customer acquisition channel?
Referrals are the lowest-cost channel, with an effective cost under $1,000 per installation when referral bonuses are included, and a conversion rate of 29 to 37%. This compares to $1,000 to $2,500 for purchased leads and $2,000 to $4,000+ for door-to-door when full overhead is counted.
How can solar companies reduce customer acquisition costs?
The most effective strategies are: building a structured referral program, investing in SEO and content marketing, shifting from shared lead lists to exclusive inbound leads, automating lead nurturing with CRM workflows, reducing post-signing cancellations, and improving post-installation engagement to generate referrals from the installed base.
What is solar CAC expected to be in 2026?
Wood Mackenzie projects residential solar CAC will spike 40% in 2026 to roughly $0.84/W, following the expiration of the 30% federal residential tax credit (Section 25D) at the end of 2025. Reduced buyer demand forces installers to compete harder for fewer in-market customers.
How does door-to-door compare to digital marketing for solar CAC?
Door-to-door generates leads at $20 to $50 but converts at roughly 10% appointment rate, yielding effective customer acquisition costs of $1,500 to $4,000+ in competitive markets before commissions. SEO produces leads at approximately $196 average with higher conversion and long-term ROI of 500 to 748%. Large national installers depend on door-to-door; local installers typically achieve substantially lower CAC through referrals and digital channels. Solar design software helps optimize system design.


