Quick Answer
A 450-watt solar panel never produces 450 watts under real sunlight. Three developments shape how installers, solar sales professionals and engineering teams should read module datasheets in 2026. NMOT values are 1-2°C lower than NOCT, leading to slightly more conservative (and more reproducible) thermal ratings.
A 450-watt solar panel never produces 450 watts under real sunlight. The closest it gets is on a cold spring morning at 1000 W/m² with a 5-degree breeze sweeping the back of the laminate, where it might briefly hit 430 watts before the cells heat up. By 1 pm in July it is closer to 370. The 450W on the label is a laboratory number, captured at a cell temperature that almost never exists outside a flash tester.
A 450-watt solar panel never produces 450 watts under real sunlight. Three developments shape how installers, solar sales professionals and engineering teams should read module datasheets in 2026. NMOT values are 1-2°C lower than NOCT, leading to slightly more conservative (and more reproducible) thermal ratings.
This gap between nameplate and field reality is exactly why the solar industry built a family of test conditions to replace pure STC. Each one was designed to answer a different question, and each one shows up in a different place on the module datasheet.
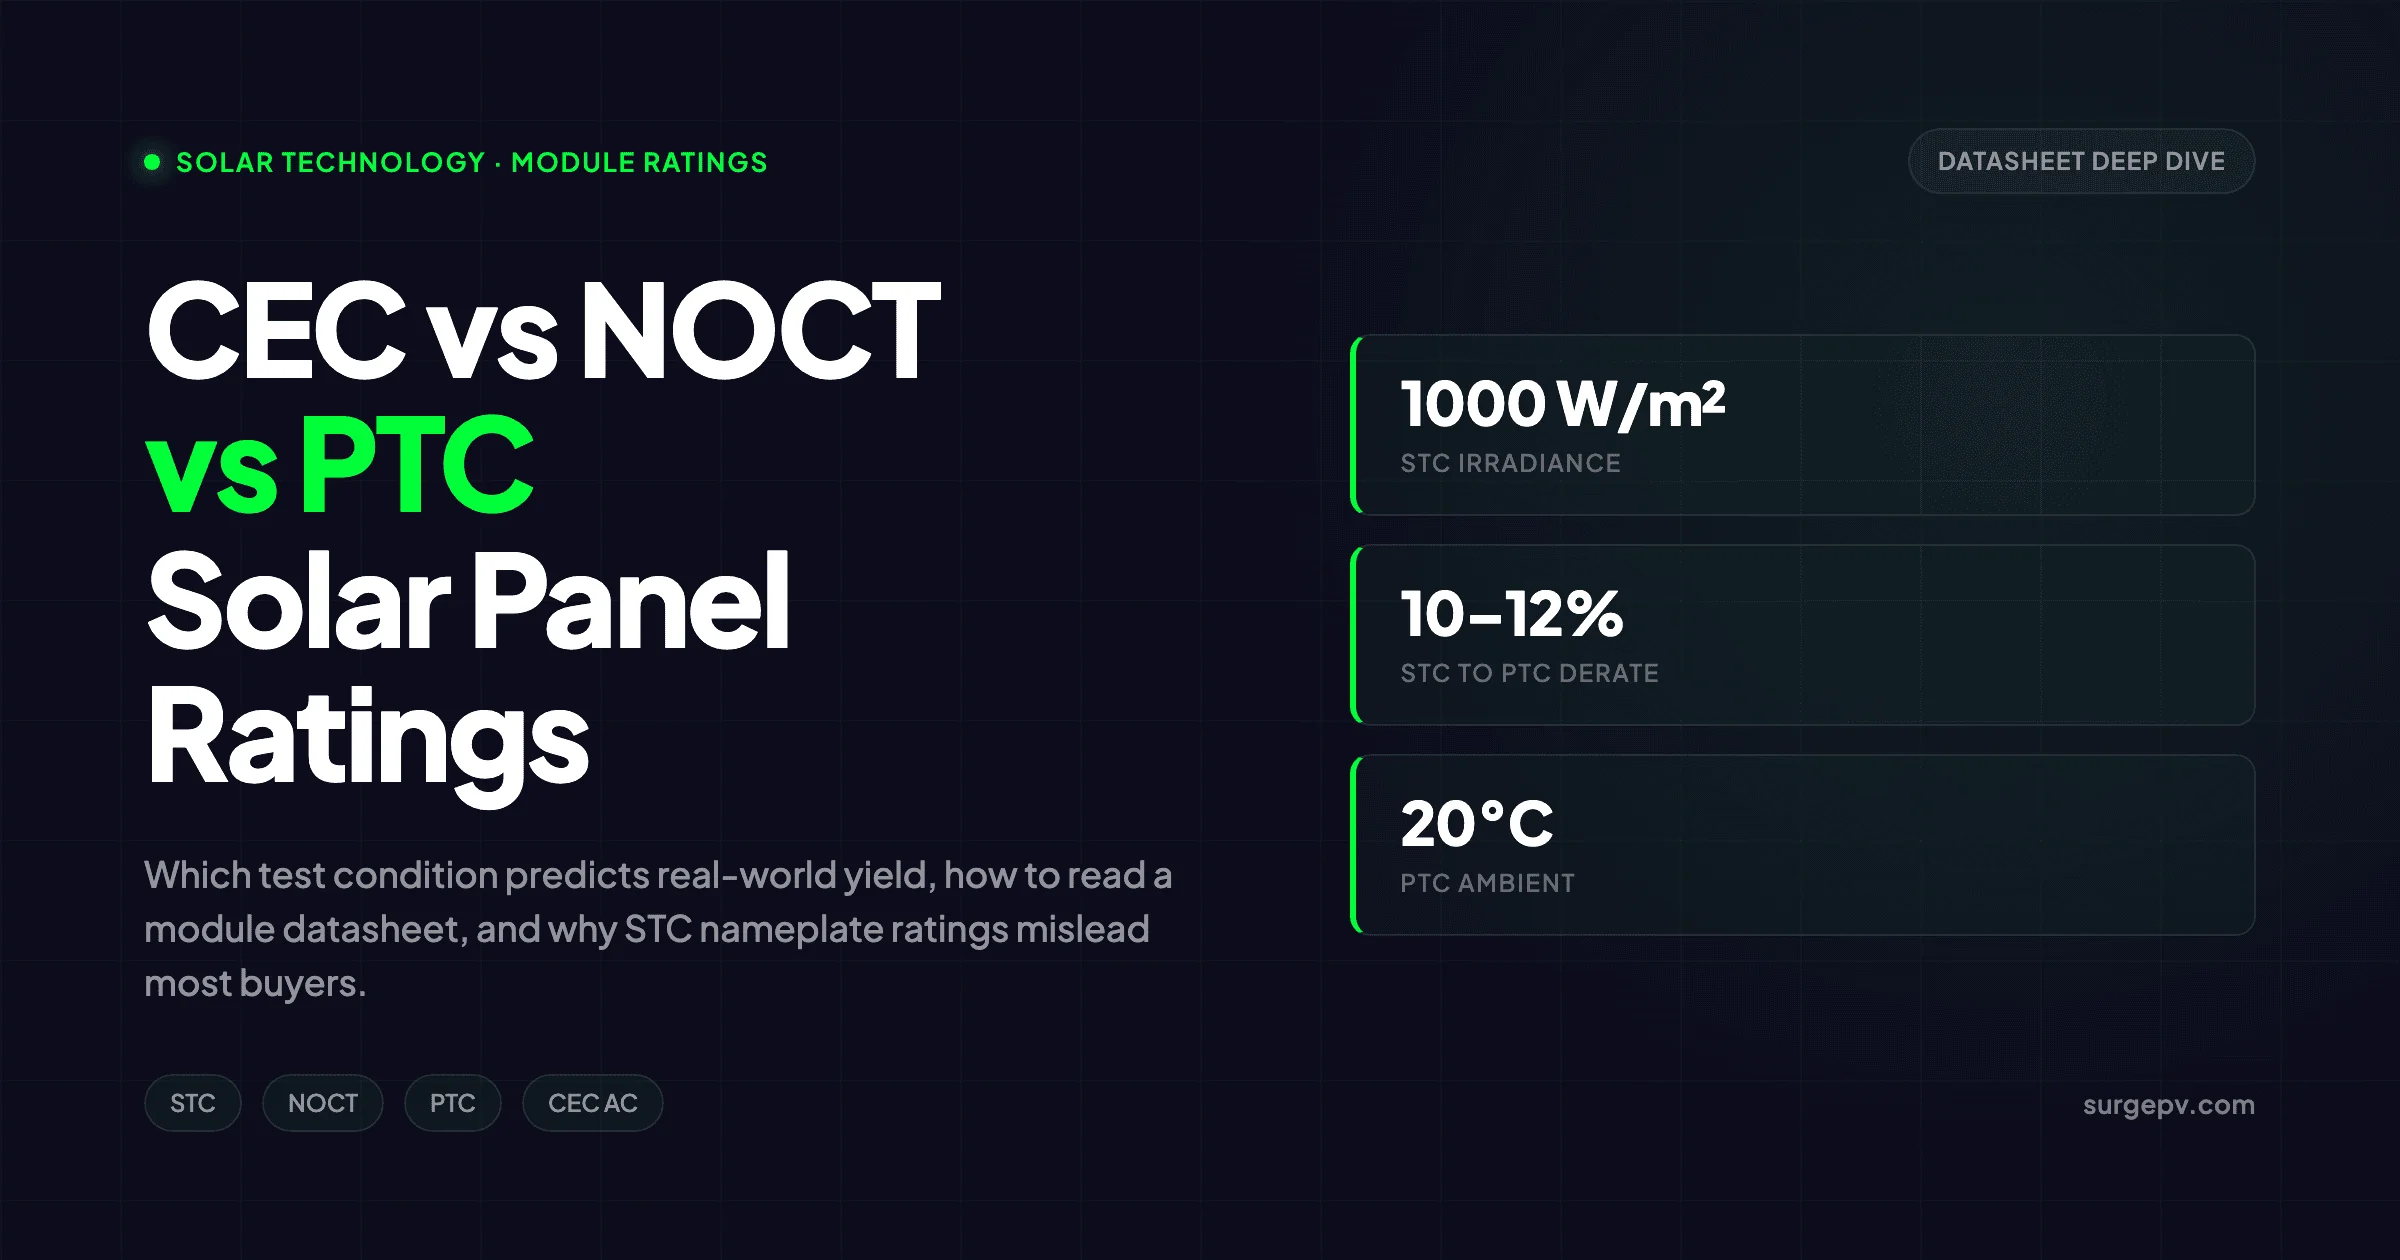
TL;DR
STC (Standard Test Conditions) gives the nameplate watt rating but assumes a 25°C cell, which is unrealistic. NOCT (Nominal Operating Cell Temperature) predicts how hot the cells run at 800 W/m² and 20°C ambient. PTC (PV-USA Test Conditions) gives a more realistic power rating at 1000 W/m² and 20°C ambient and is typically 10-12% below STC. CEC AC is PTC multiplied by weighted inverter efficiency and is the figure the California Energy Commission uses for incentive sizing. Use PTC for system sizing, NOCT for thermal selection, and STC only for marketing comparison.
See our guide on Agricultural Solar Case Study for more. Read more about Floating Solar Farms France.
What you will learn:
- Why nameplate STC ratings systematically overstate real-world performance
- The exact test conditions behind STC, NOCT, NMOT, PTC and CEC AC
- How to compute a panel’s PTC value from its STC and temperature coefficient
- What the PTC/STC ratio reveals about HJT, TOPCon and PERC thermal quality
- How to size a solar design software project against PTC rather than STC
- The 2026 push toward IEC 61853 energy rating as the next industry standard
- A worked 6 kWp example showing STC, PTC, NOCT, and field output side by side
- How the CEC PV Module List works and why it still anchors US procurement
Latest Updates: Solar Panel Rating Standards in 2026
The rating-standards landscape shifted again in the last twelve months. Three developments shape how installers, solar sales professionals and engineering teams should read module datasheets in 2026.
The CEC PV Module List is now refreshed three times a month. The California Energy Commission moved from a monthly to a tri-monthly update cycle (typically the 1st, 11th, and 21st) to keep pace with the surge of new TOPCon and HJT model variants. The Full Data download now exposes the PTC value, reported STC nameplate, temperature coefficients and cell technology for every listed module. Designers building bids in California or any market that mirrors the CEC structure should pull the list as part of every project intake.
IEC 61853 energy rating is moving from a research standard toward a commercial one. IEC 61853-3 defines a methodology for computing annual energy yield (kWh per kW) under reference climatic profiles defined in IEC 61853-4. Six climate regions are specified, ranging from tropical humid to high-altitude desert. Several tier-1 manufacturers now publish IEC 61853 energy ratings alongside STC and PTC, and procurement teams in Europe are beginning to require the data for utility-scale tenders. Also see: European Solar Tax Credits.
NMOT has fully replaced NOCT on new IEC 61215-certified modules. The 2016 revision of IEC 61215 formally retired NOCT and replaced it with NMOT, which uses the Faiman thermal model and measures back-of-module temperature directly. NMOT values are 1-2°C lower than NOCT, leading to slightly more conservative (and more reproducible) thermal ratings. Many datasheets still label the parameter “NOCT” but follow the modern NMOT procedure underneath.
| Rating Method | 2020 Industry Standard | 2026 Industry Standard |
|---|---|---|
| Cell temperature test | NOCT under IEC 61215 Ed. 2 | NMOT under IEC 61215 Ed. 3 / IEC 61853-2 |
| Field power rating | STC + manual derate | PTC published on CEC list |
| Energy yield rating | Estimated via PVsyst simulation | Reported per IEC 61853-3 (climate-specific) |
| AC rating | CEC AC for California incentives | Climate-specific energy rating + inverter weighted efficiency |
| PTC/STC ratio (typical) | 0.87-0.90 (PERC era) | 0.90-0.92 (TOPCon/HJT era) |
The Four Ratings You Will See on a Datasheet
Every crystalline silicon module datasheet shipping in 2026 reports power values at two or three operating points. The names vary across manufacturers, but the underlying physics is the same. Memorize these four and you can read any datasheet on the market.
STC: The Marketing Nameplate
Standard Test Conditions are defined by IEC 60904-3 and used by every PV manufacturer to rate the nameplate watt value. The conditions are:
- Solar irradiance of 1000 W/m²
- Cell temperature of 25°C
- Air mass 1.5G spectrum
Notice that STC specifies cell temperature, not ambient temperature. A flash tester chills the cell down to 25°C and pulses light at 1000 W/m² for milliseconds, long enough to read voltage and current but too short for the cell to warm up. That is why STC is reproducible but unrealistic. Under natural sunlight, a 1000 W/m² beam heats a typical roof-mounted cell to 45-60°C within minutes.
When a salesperson quotes “450 watts,” they almost always mean STC nameplate. It is the highest number on the datasheet and the one used for warranty purposes (e.g., 84.8% of STC nameplate after 30 years).
NOCT/NMOT: The Thermal Behavior Signal
The Nominal Operating Cell Temperature test runs the module under more lifelike thermal conditions and records the steady-state cell temperature. Per IEC 61215, NOCT conditions are:
- Solar irradiance of 800 W/m²
- Ambient temperature of 20°C
- Wind speed of 1 m/s
- Open back, 45° tilt, open-circuit module
- AM 1.5 spectrum
A typical 2026 mono-PERC panel registers a NOCT of 44-48°C. Premium HJT modules with white EVA and thin glass can drop into the 40-43°C range. Bifacial glass-glass modules with poor airflow can climb to 50°C or higher. Read Bifacial Solar Panel Design Guide for a complete walkthrough.
NOCT does double duty. First, it is a number you compare across panels — lower is better, because cooler cells lose less power. Second, datasheets typically report a “Pmax at NOCT” value, which is the panel’s power output at 800 W/m² and the measured NOCT cell temperature. That value sits in the middle of the field operating envelope and is genuinely useful for energy modeling.
Under IEC 61215 Edition 3, NOCT was renamed NMOT (Nominal Module Operating Temperature) and the test methodology was tightened using the Faiman thermal model. NMOT values run 1-2°C lower than the old NOCT for the same panel, and back-of-module temperature is measured directly rather than inferred. Functionally, the two metrics are close enough to use interchangeably for system design.
Pro Tip
If two panels have the same STC rating but different NOCT values, the panel with the lower NOCT will produce more annual energy in any climate that exceeds 25°C ambient for more than a few weeks a year. A 4°C reduction in NOCT roughly maps to a 1.2-1.6% energy yield gain across a temperate climate. Use NOCT as a tiebreaker on procurement decisions.
PTC: The Field-Realistic Power Rating
PV-USA Test Conditions originated at the Photovoltaics for Utility Scale Applications project in the late 1980s. The team built outdoor test platforms in Davis, California, and developed a regression-based model that maps measured power to a standardized set of outdoor conditions: Also see: Us Residential Solar Market Trends 2026.
- Solar irradiance of 1000 W/m²
- Ambient temperature of 20°C (not cell temperature)
- Wind speed of 1 m/s at 10 m above ground
The cell temperature is not specified — it is whatever the module thermally settles at under those conditions, which works out to roughly 45°C for a typical open-rack mounted panel. The PTC formula then collects continuous outdoor data, regresses the panel’s power against irradiance, ambient temperature, and wind, and reports the predicted power at the standardized PTC conditions.
PTC is not measured in a chamber. It is computed from outdoor data using a regression model. That distinction matters because it forces manufacturers to expose their panels to real climatic variability before they get a PTC rating.
For a typical 2026 panel, PTC is 10-12% below STC. A 450W STC nameplate becomes roughly 400-410W PTC.
CEC AC: The Bus-Bar AC Rating
CEC AC takes the PTC DC rating and multiplies it by the weighted CEC efficiency of an inverter. The weighted efficiency is computed across six operating points (10%, 20%, 30%, 50%, 75%, and 100% of nameplate) using California-specific weightings.
The CEC AC formula is:
CEC AC = PTC × Inverter CEC Weighted Efficiency
For a 450W STC panel with a 405W PTC value, paired with an inverter at 97% CEC weighted efficiency, the CEC AC value is roughly 393W. That is the figure California historically used to size incentive payments under the California Solar Initiative and is still embedded in many financing instruments.
The rule of thumb: CEC AC lands at around 86-88% of the STC nameplate. A 450W panel on a strong inverter is roughly 390W of AC capacity at the standardized operating point.
Side-by-Side: STC vs NOCT vs PTC vs CEC AC
| Parameter | STC | NOCT/NMOT | PTC | CEC AC |
|---|---|---|---|---|
| Irradiance | 1000 W/m² | 800 W/m² | 1000 W/m² | Operating point |
| Reference temperature | 25°C cell | 20°C ambient | 20°C ambient | 20°C ambient |
| Wind speed | None | 1 m/s | 1 m/s | 1 m/s |
| Cell temperature (de facto) | 25°C | ~45°C | ~45°C | ~45°C |
| Measurement method | Lab flash | Outdoor regression | Outdoor regression | PTC × inverter efficiency |
| Standard reference | IEC 60904-3 | IEC 61215 / IEC 61853-2 | PVUSA + CEC | CEC AC method |
| Typical 450W STC panel reads | 450W | 335-340W | 400-410W | 388-396W |
| Primary use | Nameplate, warranty | Thermal selection | System sizing | Incentive eligibility |
The pattern is clear. STC is the highest number on the page. NOCT power is the lowest because the irradiance is dropped to 800 W/m². PTC sits between them at the full 1000 W/m² but with realistic thermal behavior. CEC AC trims a few more percent off PTC for inverter losses.
Why STC Ratings Are Misleading Most Residential Buyers in 2026
This section is going to be controversial.
Most residential customers will never see PTC, NOCT, or CEC AC quoted on their proposal. They will see STC. A 10 kW system marketed as 10 kW STC will hit 9 kW PTC, peak around 7.5 kW after inverter losses, and average roughly 1,400-1,600 kWh per kWp annually in a typical European or US climate. The customer sees an array that “never produces 10 kW” and reasonably concludes that something is off.
The honest position is that STC ratings are misleading marketing artifacts, and the industry continues to use them because they are simple, comparable, and bigger numbers are easier to sell.
Three specific harms come from STC-centric quoting.
Mismatched expectations. Customers compare two 10 kW STC quotes and pick the cheaper one. If the cheaper quote uses panels with a 0.87 PTC/STC ratio and the more expensive quote uses panels with a 0.91 PTC/STC ratio, the cheaper system delivers roughly 4% less energy every year for 25 years. On a 10 kW system that is 400-450 kWh annually, or about 10,000 kWh of cumulative production. Real money disappears into the gap between STC and PTC.
Bad inverter sizing. A naive 1.20 STC DC:AC ratio is closer to 1.07 against PTC. That is barely any clipping headroom. The system clips heavily in winter and shoulder seasons, then underperforms in summer because the inverter is too small for the actual peak. Sizing against PTC produces healthier 1.10-1.15 PTC ratios and better lifetime energy output. Read Inverter Selection Solar Design Guide for a complete walkthrough.
Warranty disputes. A panel rated at 450W STC with a 30-year linear warranty at 84.8% of nameplate will still produce 381W at end of life. But field measurements never see 450W at the start, so installers and customers argue about whether the system is “underperforming.” If the contract instead referenced PTC, expectations would align with reality.
The fix is straightforward. Quote both numbers. Tell customers the STC nameplate is the laboratory rating, and the PTC is the field rating, and walk them through what they will see on their inverter monitoring app on a sunny April day. Customers who understand the difference become better, more patient owners.
How PTC and NOCT Are Calculated
The PTC Regression Method
PTC is not measured directly. It is computed from outdoor measurements using a four-parameter regression:
P = E × (A + B × E + C × Ta + D × WS)
where:
- P is the measured power output (W)
- E is the in-plane irradiance (W/m²)
- Ta is the ambient air temperature (°C)
- WS is the wind speed (m/s)
- A, B, C, D are regression coefficients fit to the data
The test platform records hundreds or thousands of data points spanning a range of irradiance, temperature, and wind conditions. The regression captures the panel’s sensitivity to each variable. Once the coefficients are known, the equation is evaluated at the PTC reference point (E = 1000 W/m², Ta = 20°C, WS = 1 m/s) to produce the PTC power value.
The key insight is that PTC is irradiance-corrected and temperature-corrected, but it is not a chamber test. The panel must spend time outdoors under real climatic variation before it earns a PTC rating.
The NOCT Calculation
NOCT is measured under the IEC 61215 Standard Reference Environment (SRE) with the module on an open rack, open-circuit, at 45° tilt. The cell temperature is recorded at thermal equilibrium and reported as a single value, typically 40-48°C.
The expected operating cell temperature at other conditions is then approximated:
T_cell = T_ambient + ((NOCT − 20) / 80) × S
where S is the in-plane irradiance in mW/cm² (so 100 means 1000 W/m²).
The panel’s power output at any field condition can then be derated from STC using the temperature coefficient:
P_field = P_STC × [1 + γ × (T_cell − 25)]
where γ is the temperature coefficient of power (typically −0.30% to −0.42% per °C for crystalline silicon).
A worked example: a 450W STC panel with NOCT = 45°C and γ = −0.34% per °C, operating at 30°C ambient and 1000 W/m²:
- T_cell = 30 + ((45 − 20) / 80) × 100 = 30 + 31.25 = 61.25°C
- P_field = 450 × [1 + (−0.0034) × (61.25 − 25)] = 450 × (1 − 0.1232) = 394.5W
The same panel at the PTC reference point (Ta = 20°C, 1 m/s wind, which holds T_cell near 45°C) delivers:
- P_PTC = 450 × [1 + (−0.0034) × (45 − 25)] = 450 × (1 − 0.068) = 419W
That 419W PTC is consistent with what the manufacturer would publish on the CEC list for this panel. The PTC/STC ratio is 0.931, which is excellent for a TOPCon-class module.
Quick calculation rule
If you do not have the PTC value but you do have STC, NOCT, and temperature coefficient, you can estimate PTC as: PTC ≈ STC × [1 + γ × (NOCT − 25)]. For a 450W panel with NOCT = 45°C and γ = −0.34% per °C, the estimated PTC is 419W. This rule of thumb is accurate to within plus or minus 2% of the official CEC-listed PTC value for most modern panels.
The PTC/STC Ratio as a Quality Signal
The PTC/STC ratio compresses thermal sensitivity, NOCT, and cell quality into a single number that is easy to compare across modules. Higher is better. The benchmarks for 2026 procurement:
| PTC/STC Ratio | Interpretation | Typical Cell Technology |
|---|---|---|
| Above 0.92 | Premium thermal performance | n-type HJT, top-tier TOPCon |
| 0.90 - 0.92 | Strong, modern n-type | Mainstream TOPCon, premium PERC |
| 0.88 - 0.90 | Acceptable mid-range | Mainstream PERC, older multi-Si |
| 0.86 - 0.88 | Below contemporary benchmark | Budget multi-Si, older mono |
| Below 0.86 | Re-evaluate, possible inflated STC | Question the datasheet |
Why HJT and TOPCon Score Higher
Heterojunction (HJT) cells use amorphous silicon layers that passivate the wafer surfaces and reduce recombination losses. The result is a much lower temperature coefficient of power, typically −0.24% to −0.28% per °C, against −0.34% to −0.40% per °C for conventional PERC.
A panel with γ = −0.26% per °C loses only 5.2% of its STC power between 25°C and 45°C cell temperature. A PERC panel with γ = −0.38% per °C loses 7.6% over the same temperature swing. The difference compounds across thousands of hours of operation every year.
TOPCon cells, sitting between PERC and HJT in architecture, also achieve temperature coefficients in the −0.28% to −0.31% per °C range. Combined with the higher absolute STC efficiency (22-23% for production-grade TOPCon), the PTC/STC ratio lands at 0.91-0.92.
PERC cells, the workhorse of 2018-2023, run γ at −0.34% to −0.40% per °C. PTC/STC ratios are typically 0.88-0.90.
Example: PTC/STC Comparison Across Brands
| Manufacturer | Model | STC (W) | PTC (W) | PTC/STC | Cell Technology |
|---|---|---|---|---|---|
| LONGi | Hi-MO X10 | 460 | 421.5 | 0.916 | n-type TOPCon |
| Jinko | Tiger Neo N-Type | 480 | 440.7 | 0.918 | n-type TOPCon |
| Trina | Vertex N | 445 | 408.0 | 0.917 | n-type TOPCon |
| Maxeon | Maxeon 7 | 460 | 425.0 | 0.924 | IBC (premium) |
| REC | Alpha Pure-RX | 470 | 432.0 | 0.919 | HJT |
| Canadian Solar | HiKu7 (PERC) | 450 | 401.5 | 0.892 | p-type PERC |
| Q CELLS | Q.PEAK DUO ML-G11 | 410 | 364.5 | 0.889 | p-type PERC |
The TOPCon and HJT panels cluster at 0.91-0.93 while the older PERC modules sit at 0.88-0.90. That 3-percentage-point gap translates directly into annual energy yield differences once the panels are exposed to real thermal cycling.
How the CEC PV Module List Works
The California Energy Commission maintains the most authoritative public PV module list in North America. The list was created under California Senate Bill 1 (2006) to enforce equipment standards for the California Solar Initiative, but it has since become a de facto reference for utility procurement, solar proposal software databases, and incentive programs across multiple states.
What the List Contains
The Full Data version of the PV Module List includes, per module:
- Manufacturer and model number
- STC nameplate (Pmax, Vmp, Imp, Voc, Isc)
- PTC value (the field-realistic DC rating)
- Temperature coefficients (Pmax, Voc, Isc)
- Cell technology (mono, multi, HJT, TOPCon, thin film)
- Construction (glass-glass, glass-backsheet)
- Number of cells, dimensions, weight
- Bifaciality factor (for bifacial modules)
The Simplified version is a stripped-down spreadsheet with just manufacturer, model, description, and PTC value. Most installers use the Simplified list for quick lookups and the Full Data list for serious system design.
Update Cadence and Submission Process
The CEC publishes updates on the 1st, 11th, and 21st of each month (or the next business day). Manufacturers submit new models or revisions, and the CEC review and evaluation typically takes 45 days. The CEC reviews the submitted information but does not independently verify performance — the data is manufacturer-self-reported subject to listing requirements.
Why Non-California Installers Should Still Care
Even if a project is in Texas, Florida, New York, or any other state with no formal CEC requirement, the CEC list is the cleanest publicly available source of PTC data. Solar design software packages pull from the list, financiers reference it for collateral pricing, and large EPCs use it as the canonical PTC source for bid documents.
If a manufacturer’s panel is not on the CEC list, that is a small but real flag. It usually means the manufacturer chose not to pay the listing fee or did not pass review. Either way, it makes apples-to-apples comparison harder.
Read the CEC PTC value automatically inside your design
SurgePV pulls the latest CEC PV Module List directly into your project workspace. Pick any panel and the PTC, NOCT, temperature coefficient and CEC AC rating populate the model — no manual datasheet lookups, no spreadsheet drift.
Book a DemoNo commitment required · 20 minutes · See PTC-aware sizing in action
Worked Example: A 6 kWp Residential System Through Every Rating
Take a typical 6 kWp residential roof array in Madrid, Spain. Module choice: Jinko Tiger Neo 480W TOPCon. Inverter: SolarEdge SE5000H with 97.5% CEC weighted efficiency. Also see: Spain net metering.
Array Specifications
- 13 panels × 480W STC = 6,240W STC nameplate
- PTC per panel = 440.7W → 13 × 440.7 = 5,729W PTC
- NOCT = 45°C
- Temperature coefficient of power = −0.30% per °C
- Inverter CEC weighted efficiency = 97.5%
Power at Each Rating Point
| Operating Point | DC Power (W) | AC Power (W) | Notes |
|---|---|---|---|
| STC nameplate | 6,240 | — | Lab condition, 25°C cell |
| NOCT power | 4,651 | — | 800 W/m² at NOCT |
| PTC | 5,729 | — | 1000 W/m² at ~45°C cell |
| CEC AC | 5,586 | 5,586 | PTC × 97.5% inverter |
| Field noon (June, 30°C ambient) | 5,455 | 5,318 | Higher cell temp than PTC |
| Field afternoon (June, 35°C ambient + 0.5 m/s wind) | 5,170 | 5,041 | Hot stagnant conditions |
| Field morning (April, 18°C ambient + 2 m/s wind) | 5,975 | 5,825 | Cool, breezy, near-ideal |
Annual Energy Yield
Running this system through PVsyst with the typical Madrid climate file (TMY, 1,820 kWh/m²/year POA irradiance) gives roughly 9,100 kWh AC per year, or 1,520 kWh/kWp AC against the STC nameplate. For software options, see 7 Best PVsyst Alternatives in.
Note that the 1,520 kWh/kWp ratio is computed against STC. Against PTC, it is 9,100 / 5.73 = 1,588 kWh/kWp PTC, which sits within the IEC 61853 climate-specific yield range for southern European Mediterranean climates.
The takeaway is that PTC-anchored yield numbers are more meaningful for cross-climate comparison, because they already account for thermal variation. STC-anchored yield numbers conflate panel quality with climate effects.
How Solar Design Software Should Handle These Ratings
Modern solar design software handles the rating multiplicity differently from legacy tools. The cleaner platforms pull the CEC PTC directly into the module database and run the energy simulation against PTC-derived parameters, not raw STC.
What Good Software Does
- Stores both STC and PTC per module
- References the CEC list as the authoritative PTC source
- Applies the temperature coefficient at each simulation timestep using ambient temperature, wind speed, and POA irradiance — not a static derate
- Shows the PTC/STC ratio in the module selection UI
- Reports both STC kWp and PTC kWp in the design summary
- Sizes the inverter against PTC for DC:AC ratio calculations
- Pulls the CEC AC weighted efficiency for the chosen inverter
What Legacy Software Does
- Stores only STC and applies a flat 14% derate
- Pulls module data from manufacturer-supplied PDFs (which usually omit PTC)
- Reports only STC kWp in the design summary
- Uses naive STC DC:AC ratios for inverter sizing
- Cannot distinguish a 0.92 PTC/STC HJT panel from a 0.88 PTC/STC PERC panel in energy yield
The result is that legacy tools overpredict energy yield for PERC-heavy designs and underpredict for HJT-heavy designs. Across a 25-year contract, the gap can run to plus or minus 3-5% of total expected revenue, which is enough to flip the economics of a deal.
For installer teams, the practical fix is to pick a platform that exposes the PTC value in the module picker. If you cannot see PTC during module selection, you are flying blind on thermal performance.
IEC 61853: The Next Standard
IEC 61853 is the energy-rating standard the global PV industry has been slowly adopting for the last decade. It is more rigorous than PTC and more useful for cross-climate comparison. For Global-specific compliance details, see Global net-metering-by-country.
What It Measures
IEC 61853-1 specifies a power matrix measured at 23 different combinations of irradiance and module temperature, spanning 100 to 1100 W/m² and 15 to 75°C cell temperature. The module’s behavior is fully characterized across the operating envelope, not just at one or two reference points.
IEC 61853-2 specifies the thermal model (Faiman) used to estimate cell temperature from ambient temperature, wind speed, and irradiance.
IEC 61853-3 defines the methodology for computing annual energy output and Climate-Specific Energy Rating (CSER) from the power matrix and a reference climatic profile.
IEC 61853-4 specifies six reference climatic profiles representing different global climate zones: subtropical arid, subtropical coastal, temperate coastal, temperate continental, high-elevation, and tropical humid.
Why It Matters
A panel rated under IEC 61853 carries a kWh-per-kWp rating for each of the six climate zones. That is far more useful than STC or PTC for predicting how the panel will perform in a specific deployment location.
For example, a panel might score 1,650 kWh/kWp in the subtropical arid profile, 1,520 kWh/kWp in temperate coastal, and 1,420 kWh/kWp in tropical humid. Those numbers map directly to revenue under most PPA structures and let financiers price collateral against location-specific yield rather than generic STC capacity.
Adoption is uneven. Premium European manufacturers like Meyer Burger and SolarWatt publish IEC 61853 ratings as a matter of course. Most Tier-1 Chinese manufacturers do not yet, though several have committed to phase-in by 2027. In US utility-scale procurement, IEC 61853 is rapidly becoming a tender requirement.
For residential installers, the practical impact in 2026 is small. PTC and CEC AC remain the operational anchors. By 2028-2030, expect IEC 61853 CSER to start appearing on module datasheets alongside or in place of PTC.
Reading a Real Datasheet: What to Look For
A typical TOPCon 480W datasheet from a Tier-1 manufacturer will report:
| Datasheet Field | Typical Value | What It Tells You |
|---|---|---|
| Pmax at STC | 480 W | Nameplate, marketing |
| Vmp at STC | 35.6 V | Operating voltage at STC |
| Imp at STC | 13.5 A | Operating current at STC |
| Voc at STC | 42.8 V | Open-circuit voltage at STC (sizing string lengths) |
| Isc at STC | 14.2 A | Short-circuit current at STC (sizing combiner fuses) |
| NOCT / NMOT | 45°C | Thermal behavior under SRE |
| Pmax at NOCT | 360 W | Power at 800 W/m² and 45°C |
| Temperature coefficient of Pmax | −0.30%/°C | Thermal sensitivity |
| Temperature coefficient of Voc | −0.25%/°C | Cold-temp voltage rise (NEC 690.7 calc) |
| Temperature coefficient of Isc | +0.045%/°C | Current rise with temperature |
| Module efficiency | 22.5% | Power per unit area |
PTC is almost never printed on the datasheet itself. You have to either look it up on the CEC list or compute it yourself using the formula in the NOCT section above.
The temperature coefficient of Voc is the most safety-critical number on the page. Cold-weather voltage rise must be checked against the inverter’s maximum DC input voltage rating per NEC 690.7. A panel with γ_Voc = −0.25%/°C at -25°C minimum design temperature will have a Voc roughly 12.5% higher than the STC Voc, which can push a marginal string design over the inverter’s voltage limit.
Pro Tip
When reviewing a module spec sheet, write down four numbers: STC Pmax, NOCT (or NMOT), temperature coefficient of Pmax, and bifaciality factor (if applicable). Those four numbers plus the CEC list lookup gives you everything you need to model the panel in any solar design software or hand calculation. Everything else on the datasheet is either marketing or specific to one installation detail.
Common Mistakes Installers Make With These Ratings
After eight years training installers and reviewing several hundred residential and small commercial designs, I see the same handful of rating-related mistakes repeated across the industry.
Mistake 1: Sizing the Inverter to STC Instead of PTC
A 10 kWp STC array on an 8 kW inverter looks like a 1.25 DC:AC ratio. Against PTC of about 9 kWp, the ratio is closer to 1.13. The first number sounds aggressive and might worry a financier. The second number is in the healthy range for most US and European climates.
The fix is to publish both ratios and explain that PTC is the field-realistic anchor.
Mistake 2: Comparing Two Quotes on STC Wattage Alone
Two 10 kWp STC arrays can have very different PTC values. A PERC array at 0.89 PTC/STC delivers 8.9 kWp PTC. A TOPCon array at 0.92 PTC/STC delivers 9.2 kWp PTC. The 3.4% gap compounds every year for 25 years.
The fix is to quote both STC and PTC on every proposal. Customers who care will reward the higher-PTC quote.
Mistake 3: Confusing NOCT with Cell Temperature
NOCT is the cell temperature under the SRE conditions (800 W/m², 20°C ambient). It is not the cell temperature at any other operating point. A panel with NOCT = 45°C will run at 60-65°C cell temperature on a hot summer rooftop at 1000 W/m² and 35°C ambient.
The fix is to use the cell temperature formula (T_cell = T_amb + ((NOCT − 20) / 80) × S) rather than treating NOCT as a fixed operating temperature.
Mistake 4: Ignoring the Temperature Coefficient of Voc
The Voc temperature coefficient matters more for inverter compatibility than the Pmax coefficient matters for energy yield. A cold morning can push string Voc above the inverter’s maximum input rating and trip the system or damage the inverter.
The fix is to check NEC 690.7 cold-temperature voltage rise on every design, using the panel’s actual Voc temperature coefficient and the local 100-year minimum temperature.
Mistake 5: Treating CEC AC as the Universal AC Rating
CEC AC is computed at one operating point with one inverter weighted efficiency methodology. It is not the same as the AC rating that would result from the European weighted efficiency (Euro Efficiency) or the Indian or Australian weighted methods. Use the regional weighted efficiency in non-CEC markets. Also see: Best Solar Design Software India. For India-specific information, see 5kW Solar Panel Price in India. For Australia-specific compliance details, see Australia comparisons/lgc-vs-stc.
The fix is to ask the inverter manufacturer for the weighted efficiency relevant to the deployment region rather than copying CEC AC into every region.
Roof Type, Mounting, and the Thermal Penalty
NOCT and PTC both assume open-rack mounting with airflow on the back of the panel. Real installations often deviate.
Open Rack (Ground Mount or Tilted Carport)
This matches the NOCT and PTC test conditions. Back-of-module temperatures stay close to NOCT. Annual energy yield closely follows the PTC-based prediction.
Roof Mount with Standoff (Standard Residential)
Standoff distance of 75-150 mm between the panel and the roof allows some airflow. Back-of-module temperatures run 3-6°C hotter than open rack at peak irradiance. Energy yield drops by roughly 1-2% relative to open-rack PTC prediction.
Flush Mount (Building-Integrated)
Less than 50 mm standoff, or panels integrated into the roof surface. Back-of-module temperatures can climb 8-12°C above open rack. Energy yield drops by 2-5% relative to PTC prediction.
Floating PV
Water cools the back of the panel. Cell temperatures run 3-5°C cooler than equivalent open-rack land mount. Energy yield improves by 1-2% relative to PTC prediction.
These thermal penalties or gains are real and should be applied as a separate factor in any field energy model. PTC gives you the panel’s open-rack performance. The mounting choice modifies it.
ROI Implications: STC vs PTC Sizing on a 10 kWp Project
A homeowner in Spain installs a 10 kWp STC system. Two scenarios:
Scenario A: PERC panels, 0.88 PTC/STC ratio
- STC nameplate: 10,000 W
- PTC: 8,800 W
- Annual yield (Madrid, 1,580 kWh/kWp PTC): 13,904 kWh
- Energy value at 0.18 EUR/kWh: 2,503 EUR/year
Scenario B: TOPCon panels, 0.92 PTC/STC ratio
- STC nameplate: 10,000 W
- PTC: 9,200 W
- Annual yield (same climate): 14,536 kWh
- Energy value at 0.18 EUR/kWh: 2,616 EUR/year
The TOPCon scenario delivers 113 EUR more per year, or 2,825 EUR over 25 years (undiscounted). If the TOPCon panels cost 200-400 EUR more on the upfront bid, the customer breaks even in 2-4 years and pockets the rest as pure margin.
This is the core economic case for paying attention to PTC. Two systems with identical STC nameplates can deliver materially different energy and revenue depending on the panel-level PTC/STC ratio. Customers who only look at STC are leaving real money on the table.
For more detail on solar economics, see our solar panel ROI analysis for Italy or the European solar incentives guide for how PTC-aware sizing intersects with rebate and feed-in tariff structures. Also see: solar panel ROI in Italy.
Where Each Rating Shows Up in Procurement
| Document | Rating Used | Reason |
|---|---|---|
| Module datasheet front page | STC | Marketing nameplate |
| Module datasheet thermal page | NOCT + temp coefficient | Field thermal estimation |
| CEC PV Module List | STC + PTC + temp coefficients | Regulatory listing |
| Utility interconnect application | STC nameplate | Sized to label rating |
| EPC bid document | STC and PTC | Both for comparison |
| Inverter sizing calculation | PTC | Realistic DC peak |
| String length calculation | STC Voc + Voc temp coefficient | NEC 690.7 cold rise |
| PPA pricing | STC kWp and IEC 61853 yield | Revenue modeling |
| Warranty document | STC | Nameplate-based degradation |
| Financial pro forma | PTC or IEC 61853 yield | Field-realistic revenue |
Notice that the same physical panel shows up in different documents at different rating points. STC dominates the contract-level documents because it is what the customer signed. PTC dominates the engineering and financial documents because it is what the system actually delivers.
What This Means for 2026 Buyers and Installers
If you are buying or specifying solar panels in 2026, three rules will keep you out of trouble:
-
Pull the CEC list before signing. Look up the PTC value and PTC/STC ratio of every panel you are considering. Anything below 0.90 needs a justification. Anything above 0.92 is worth the small price premium.
-
Size the inverter against PTC. A 1.10-1.15 PTC ratio is generally healthier than a 1.20-1.25 STC ratio. The clipping behavior matches what an experienced design engineer would target.
-
Use field-realistic numbers when talking to customers. Quote both STC and PTC. Tell the customer what to expect on their inverter monitoring app. Set expectations to PTC, not STC, and you will have happier, more patient owners.
For installer teams, the operational change is small. Pull the CEC list once a month. Bake the PTC value into your design tool. Update proposal templates to show both STC and PTC. Train your sales staff to explain the difference in 60 seconds. That is the entire upgrade.
Conclusion
Three concrete actions for any installer or buyer reading this:
- Add the CEC PTC value to every panel comparison spreadsheet and reject panels with PTC/STC ratios below 0.90 unless there is a strong commercial reason.
- Re-size every inverter-to-array ratio against PTC, not STC, on the next 10 projects you quote. Document the difference and use it as a sales differentiator against competitors who quote STC ratios.
- Train your front-line sales team to explain STC, NOCT, PTC, and CEC AC in plain language. Customers who understand the rating system become long-term advocates for the company.
PTC remains the most useful single field-realistic rating on a 2026 module datasheet. NOCT remains the thermal selection signal. STC remains the marketing nameplate. IEC 61853 is the future. Treat each one for what it is and you will design better, sell more honestly, and avoid the most common rating-related disputes that derail residential and small commercial projects.
For deeper module performance modeling, explore our guides on albedo values in solar design, anti-reflective coatings on solar panels, and the solar irradiance glossary entry. For inverter sizing and AC system design, see our notes on AC disconnect sizing and the solar proposal software overview.
Frequently Asked Questions
What is the difference between STC, NOCT, and PTC solar panel ratings?
STC (Standard Test Conditions) is the laboratory benchmark at 1000 W/m² irradiance, 25°C cell temperature, and AM 1.5 spectrum. It produces the nameplate watt rating on every module datasheet. NOCT (Nominal Operating Cell Temperature) is measured at 800 W/m², 20°C ambient, 1 m/s wind, and an open-back module. It predicts how hot the cells will run in the field. PTC (PV-USA Test Conditions) uses 1000 W/m², 20°C ambient, and 1 m/s wind. It is the most field-realistic comparison and typically lands 10-12% below STC.
Why does my 450W solar panel never produce 450W?
The 450W figure is the STC nameplate. STC assumes a 25°C cell temperature that is almost never present under real sunlight, because a 1000 W/m² beam heats the cell to 45-60°C. The PTC rating of the same module is roughly 405-415W, and the AC output after the inverter falls another 4-6%. A clean panel at solar noon in mild weather will deliver close to its PTC rating. On a hot rooftop in July the same panel might deliver 350-380W instantaneously.
What does the CEC AC rating mean on a module list?
The CEC AC rating is the PTC value of the module multiplied by the weighted CEC efficiency of the chosen inverter. It is the watts you can expect to feed into the household AC bus at the operating point used by the California Energy Commission for incentive sizing. As a rule of thumb, the CEC AC rating is around 86% of the STC nameplate rating. The full PV module list with PTC, CEC AC and temperature coefficients is published by the California Energy Commission and refreshed three times a month.
Is PTC the same as NOCT?
No. The irradiance is different and the cell temperature is different. PTC uses 1000 W/m² and lets the cell self-heat to roughly 45°C. NOCT uses 800 W/m² and measures the equilibrium cell temperature, typically 40-48°C. PTC is a power rating in watts. NOCT is both a temperature value and an associated power rating. The two numbers describe different operating points and should not be used interchangeably.
What is a good PTC to STC ratio for a 2026 solar panel?
A PTC/STC ratio above 0.91 is excellent and signals very low thermal sensitivity. Most modern n-type HJT and TOPCon panels land between 0.90 and 0.92. PERC modules with older p-type cells typically come in at 0.88-0.90. A ratio below 0.87 should raise questions about temperature coefficient quality or cell-to-module losses. The PTC/STC ratio is one of the most useful single numbers for comparing thermal performance across brands.
Has NOCT been replaced by NMOT?
Yes, under IEC 61215:2016 the formal cell-temperature test was renamed to NMOT, which stands for Nominal Module Operating Temperature. The environmental conditions are identical to NOCT, but NMOT measures the back-of-module temperature using the Faiman thermal model rather than estimating cell temperature directly. NMOT readings are typically 1-2°C lower than NOCT for the same panel. Many manufacturers still print “NOCT” on their datasheets out of habit, even when the test was performed under the modern NMOT procedure.
Should I size my inverter to STC or PTC?
Size the DC-to-AC ratio against PTC, not STC, if you want the inverter to clip the right number of hours per year. A 10 kWp STC array is closer to 9 kWp PTC. Pairing it with an 8 kW inverter gives a 1.13 PTC ratio, which is a healthier real-world target than the 1.25 STC ratio the same combination implies. Most modern solar design platform reads the module’s PTC value from the CEC list and applies a temperature-corrected coincident power model rather than naive STC scaling.
Where do I find a panel’s PTC and CEC AC rating?
The California Energy Commission publishes the official PV Module List with PTC values, nameplate STC ratings and temperature coefficients. The list is searchable at the CEC website and is updated three times a month. Most module manufacturers do not print the PTC value on the front-page datasheet, but they will list NOCT and the temperature coefficient of power, which let you compute an approximate PTC value yourself.