Quick Answer
The US residential solar market added 4.5 GW in 2025 despite NEM 3.0 reducing export compensation in California. Battery attachment rates reached 25% nationally. Installer consolidation accelerated with Sunrun, Sunnova, and regional independents competing. The 30% ITC remains through 2032.
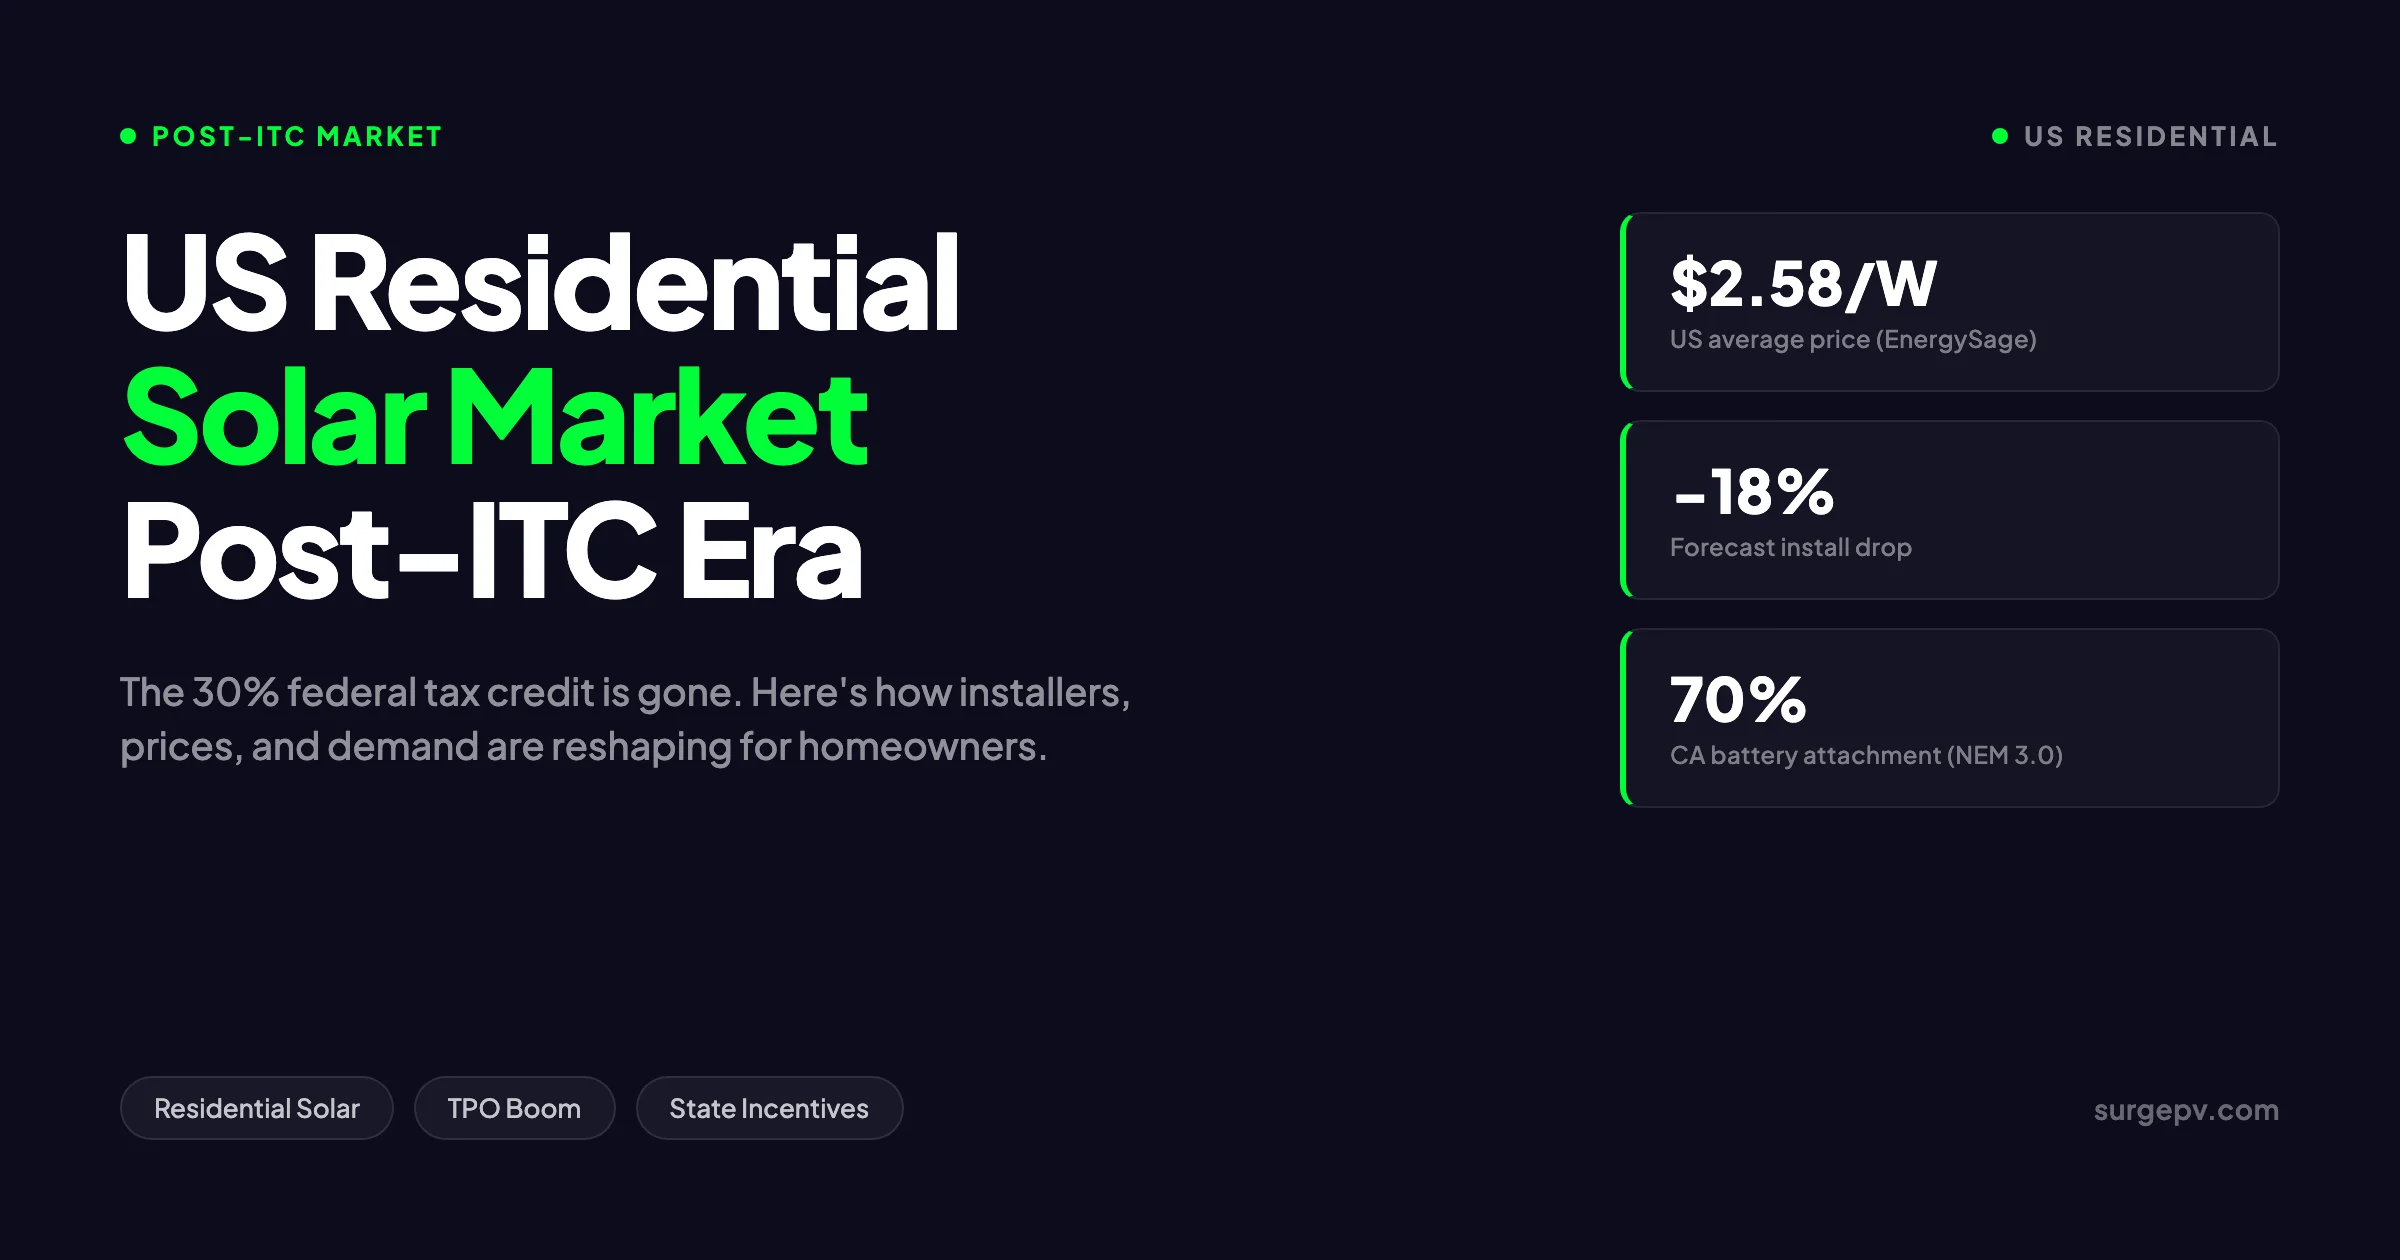
Most homeowners in California planning rooftop solar in 2026 are still anchoring their financial model to the 30% federal tax credit they will never receive. The Section 25D Residential Clean Energy Credit expired on December 31, 2025. The mistake is reshaping how the entire US residential solar market is sold — and how installers price, prospect, and close in every state.
The US residential solar market added 4.5 GW in 2025 despite NEM 3.0 reducing export compensation in California. Battery attachment rates reached 25% nationally. Installer consolidation accelerated with Sunrun, Sunnova, and regional independents competing. The 30% ITC remains through 2032.
This guide breaks down the new US residential solar market trends shaping 2026: the post-ITC demand reset, state-by-state incentives that now drive economics, California’s NEM 3.0 aftermath, the TPO boom replacing customer-owned systems, and what installers must change in their sales playbook to survive the year.
Quick Answer — US Residential Solar in 2026
The Section 25D 30% federal Investment Tax Credit for homeowner-owned residential solar expired Dec 31, 2025. SEIA and Wood Mackenzie forecast an 18% drop in residential installations in 2026. Customer acquisition costs are spiking 40% to $0.84 per watt. National average price sits at $2.58 per watt (EnergySage). The market is pivoting to TPO leases and PPAs, which still qualify for the Section 48E commercial credit through 2027.
In this guide:
- Where US residential solar stands right now and what changed on January 1, 2026
- Post-ITC demand shifts: who is still buying solar and why
- Full state-by-state breakdown of active 2026 incentives
- California after NEM 3.0 — the market restructuring no one saw coming
- The contrarian take: what most installers are getting wrong about the post-ITC playbook
- Sun Belt vs Northeast — where 2026 demand is actually holding up
- How financing replaces incentives: TPO, PPAs, and solar loans in 2026
- 2026 to 2028 outlook with installer guidance
Where US Residential Solar Stands in 2026
The US residential solar market is in the messiest transition since the 2017 module tariffs. Installation volume, financing structure, and customer mix are all changing at once.
The headline numbers from SEIA and Wood Mackenzie’s Q4 2025 Solar Market Insight Report tell the story.
| US Residential Solar Metric | 2024 | 2025 | 2026 Forecast |
|---|---|---|---|
| Annual installations (residential) | ~6.0 GWdc | ~5.9 GWdc (−2%) | ~4.8 GWdc (−18%) |
| Distributed solar total | ~8.8 GWdc | 8.4 GWdc (−5%) | TBD |
| Average price (EnergySage) | $2.49/W | $2.49–$2.57/W | $2.58/W |
| Average system size (EnergySage) | 11.7 kW | 11.8 kW | 12.0 kW |
| Battery attachment rate | 28% | ~35% | 40%+ |
| Customer acquisition cost | $0.60/W | $0.60/W | $0.84/W (+40%) |
Sources: SEIA / Wood Mackenzie US Solar Market Insight Q4 2025, EnergySage Marketplace H2 2025 Report, Wood Mackenzie Residential CAC Outlook.
Three things happened in 2025 that set up the 2026 reset.
First, the One Big Beautiful Bill Act (OBBBA) passed in July 2025. It eliminated Section 25D — the 30% Residential Clean Energy Credit for customer-owned residential solar — effective December 31, 2025.
Second, installers spent the second half of 2025 racing to close every cash and loan deal before the deadline. EnergySage reported a 205% increase in homeowner engagement on its marketplace through H2 2025. Q4 2025 was the strongest quarter for US solar deployment since 2023.
Third, module supply tightened. Many installers report distributors are sold out of both domestic and imported panels through year-end 2026, according to SEIA. SEIA and Wood Mackenzie downgraded the near-term residential outlook by 8% for 2026 on this constraint alone.
The result is a market that pulled forward demand into late 2025 and is now staring at a contraction.
Key Takeaway — The 2026 Setup
If you sell solar in 2026, your pipeline is competing against a customer base that was just pulled forward by 12 to 18 months of accelerated buying. Add an 18% volume decline and a 40% CAC spike. Pricing power matters less than pipeline math. Installers without a financing strategy beyond cash and loans will not make it through Q4 2026 without restructuring.
Post-ITC Reality — How Demand Has Shifted Since Dec 2025
The 30% federal tax credit was the single largest line item in most residential solar proposals. Removing it changes payback math, financing structure, and buyer psychology all at once.
Here is what shifted on January 1, 2026.
The Math Changed Overnight
A typical 8 kW system at the EnergySage national average of $2.58 per watt is $20,640 gross. Under the old Section 25D rules, a homeowner with sufficient federal tax liability claimed $6,192 back over up to five tax years. Net cash cost: $14,448.
In 2026, that same homeowner pays the full $20,640. At an average US residential electricity rate of $0.18 per kWh (US EIA, 2025), an 8 kW system in a 1,500 kWh/kW location generates about $2,160 in annual savings. Simple payback moves from roughly 6.7 years to 9.6 years — a 43% extension.
In high-cost states like California, Massachusetts, Hawaii, and New York, where retail electricity sits at $0.30 to $0.42 per kWh, payback math is still strong: 6 to 9 years even without the federal credit. In low-cost states like Washington, Louisiana, and Idaho where rates are $0.10 to $0.13 per kWh, customer-owned solar without the ITC stops penciling.
The Customer Mix Compressed
Solar.com’s analysis is direct: solar still works for most homeowners paying above $0.20 per kWh, with a 10 to 13 year payback and $40,000 to $60,000 in 25-year savings. Below that price point, the federal credit was what made the deal close.
Roughly 38% of US households now pay above $0.20 per kWh for electricity, according to US Energy Information Administration retail rate data. That is the new addressable market for customer-owned residential solar. Outside that band, the conversation has to be about lease or PPA economics, not ownership.
TPO Took Over the Conversation
The Section 48E commercial Investment Tax Credit is still alive through 2027. Third-party owners — companies like Sunrun, Sunnova (in restructuring), Palmetto, and Lightreach — can still claim the 30% credit on systems they own and pass savings to homeowners through lower monthly payments.
Ohm Analytics initially projected a 50% drop in customer ownership in 2026 combined with 10 to 15% growth in TPO. The TPO picture has shifted upward since due to the aggressive go-to-market strategy of well-capitalized new entrants in the prepaid lease space.
Sunrun’s CEO said on the company’s Q4 2025 earnings call that TPO would account for over 80% of its 2026 originations. Pre-OBBBA, TPO was approximately 35% of the US residential market. The structural shift is happening in real time.
Pro Tip — Use Real Post-ITC Math in Every Quote
If your proposal software still pre-fills the 30% federal credit by default for residential systems quoted in 2026, the lead will catch it and lose trust. Modern solar proposal software like SurgePV updates federal incentive logic by jurisdiction and quote date. Quoting the wrong credit costs deals faster than a $1,000 price difference.
For a direct comparison, see Arka 360 vs SurgePV.
Story From the Field
Rebecca, a homeowner in Sacramento, California, signed a 7.2 kW Sunrun lease in February 2026 for $0 down. Her quoted monthly payment is $148, against an average pre-solar PG&E bill of $231. Her estimated lifetime savings is $32,000 over the 20-year lease term.
Before OBBBA, Rebecca would have likely been quoted a $24,000 cash purchase at $2.50 per watt with a $7,200 federal credit. That option is now economically inferior for her exact situation: she does not have $24,000 in cash, the loan rate is 8.5%, and Sunrun’s TPO model is the only way she captures any federal tax benefit. Her decision is rational. It is also a leading indicator for the entire 2026 market.
State-by-State Incentive Breakdown 2026
With the federal credit gone for customer-owned systems, state incentives now drive the deal economics. The variation is wider than most national installers realize.
Top States Ranked by 2026 Residential Solar Incentive Value
| State | Personal Income Tax Credit | Performance Incentive | Property Tax Exemption | Sales Tax Exemption | 2026 Net Incentive (8 kW, $20k system) |
|---|---|---|---|---|---|
| New York | 25%, up to $5,000 | NY-Sun rebate (varies) | Yes | Yes | $5,000–$8,000 |
| Massachusetts | 15%, up to $1,000 | SMART (battery only) | Yes | Yes | $2,500–$5,500 |
| New Mexico | 10%, up to $6,000 | None | Partial | None | $2,000–$4,000 |
| South Carolina | 25%, up to $3,500 | None | Partial | None | $3,500 cap |
| Arizona | 25%, up to $1,000 | None | Yes | Yes | $1,500–$3,000 |
| Hawaii | 35%, up to $5,000 | None | None | None | $5,000 cap |
| Utah | Up to $400 fixed | None | Yes | None | $400 + property tax |
| Texas | None | Utility-level only | Yes | Yes | $1,000–$2,500 |
| Florida | None | Net metering | Yes | Yes | $1,200–$2,800 |
| California | None | NEM 3.0 export credits | Yes (until 2027) | None | Storage-dependent |
Sources: Solar.com 2026 State Incentive Guide, ConsumerAffairs Solar Incentives by State 2026, Tesla 2026 Incentive Map, individual state tax authorities.
New York: The Strongest Standalone State
New York is widely viewed as the top state for residential solar incentives in 2026. The New York State Solar Tax Credit gives a 25% deduction up to $5,000 against state income tax. NY-Sun adds rebates worth several thousand dollars for many utility customers, with extra support for low- and moderate-income households. Sales and property tax exemptions apply on top. Also see: Us Residential Solar Market Trends 2026. For United States-specific compliance details, see United States arizona/phoenix.
For a typical 8 kW system in New York, the combined state-level benefit can reach $8,000 — about 80% of what the old federal credit delivered, with no federal credit on the table.
Massachusetts: SMART Program in Transition
Massachusetts uses the SMART program, a performance-based incentive that pays a fixed adder per kWh for 20 years. The base 2026 residential rate is $0.03 per kWh — but rising utility avoided-cost rates have pushed the solar-only SMART incentive to $0 per kWh in all Massachusetts territories. Pairing with battery storage is now essential to capture SMART value. Read Adding Battery Storage Services for a complete walkthrough.
Massachusetts also offers a 15% state income tax credit (up to $1,000), property tax exemption, sales tax exemption, and Mass Save rebates. Total package can reach $5,500 for a battery-paired 8 kW system.
Texas and Florida: Tax Exemptions, No Direct Credits
Texas and Florida share a strategy: aggressive property and sales tax exemptions, but no state income tax credit (because neither has a state income tax). Most utility-level incentives in Texas are run by Austin Energy, CPS Energy, and a handful of cooperatives. Florida’s net metering protections remain among the strongest in the country, though they faced repeated legislative challenges through 2024 and 2025.
For Texas homeowners, the meaningful incentive in 2026 is the property tax exemption on the value added by solar — typically $15,000 to $25,000 of assessed value protected.
California: NEM 3.0 Replaces Direct Incentives
California has no state income tax credit or rebate for residential solar. Under NEM 3.0 (the Net Billing Tariff), the entire economic model is determined by export rates and battery attachment. The state’s incentive structure is functionally embedded in the avoided-cost compensation methodology — which dropped 75% relative to NEM 2.0. See the dedicated NEM 3.0 section below.
Key Takeaway — The State Incentive Map Just Got Critical
In 2025, a sales rep in any state could lead with the 30% federal credit. In 2026, the same rep needs a state-by-state playbook. New York and Massachusetts close at $5,000 to $8,000 of state benefit. Texas closes on property tax savings and electricity rate inflation. Quoting an Iowa homeowner the same way you quote a Long Island homeowner kills the deal both ways.
California After NEM 3.0 — The Market Restructuring
California is the most consequential state in US residential solar — and its market has been gutted by NEM 3.0.
What NEM 3.0 Changed
The Net Billing Tariff (NEM 3.0) took effect April 15, 2023 for new solar customers in PG&E, SCE, and SDG&E territories. It cut the export rate from a near-retail blend (around $0.30 to $0.40 per kWh under NEM 2.0) to a time-of-use avoided cost rate of roughly $0.05 to $0.08 per kWh. That is a 75% reduction in export compensation.
The result: a solar-only system in California that previously paid back in 5 to 6 years now takes 9 to 13 years, per Solar.com analysis.
The Demand Drop
CALSSA (California Solar & Storage Association) data shows California year-on-year solar sales fell 60% to 80% after NEM 3.0 took effect. Over 17,000 California solar jobs were lost.
Rooftop installations in California fell from approximately 2,300 MW in 2022 to about 1,375 MW in 2024 — a 40% drop. The April 15, 2026 NEM 2.0 grandfathering deadline (the last date for systems with pre-April-2023 applications to achieve Permission to Operate) is creating a small final spike before installations decline further.
In March 2026, the California 1st District Court of Appeal upheld NEM 3.0 on remand from the California Supreme Court, ending the most credible legal challenge to the tariff. NEM 3.0 is the rule for the foreseeable future.
Battery Attachment Becomes Mandatory
The economic logic of NEM 3.0 is unambiguous: if you cannot self-consume solar production, exporting it earns you almost nothing. CPUC proceeding data shows battery attachment rates among SCE and PG&E solar customers jumped from approximately 11% before April 2023 to nearly 70% by late 2024.
By 2026, virtually no new California solar system is being installed without storage. The state has effectively moved from “solar” to “solar plus storage” as a single product category.
NEM 3.0 Compensation Reality
| Time of Year | Time of Day | NEM 3.0 Export Rate (Estimated) | NEM 2.0 Equivalent |
|---|---|---|---|
| Summer evening (peak) | 4pm–9pm | $0.40–$0.60/kWh | $0.40–$0.55/kWh |
| Summer midday | 10am–3pm | $0.04–$0.06/kWh | $0.30–$0.40/kWh |
| Winter midday | 10am–3pm | $0.03–$0.05/kWh | $0.25–$0.35/kWh |
| Winter morning | 7am–9am | $0.10–$0.15/kWh | $0.30/kWh |
NEM 3.0 export rates are time-of-use avoided cost — they vary by hour and season. Most solar production happens midday when rates are lowest. Sources: CPUC NEM 3.0 ACC tables, Solar.com NEM 3.0 explainer.
The Avoided Cost Calculator (ACC) Plus adder — a bonus locked at enrollment — is also stepping down 20% per year through 2028. By 2026, the adder is worth roughly 40% less than at NEM 3.0 launch.
Sacramento and LADWP Exception
NEM 3.0 only applies to the three investor-owned utilities (PG&E, SCE, SDG&E). LADWP (Los Angeles Department of Water and Power) and SMUD (Sacramento Municipal Utility District) customers operate under their own net metering rules — both more favorable to homeowners than NEM 3.0. This creates a notable carve-out within California where solar economics still resemble pre-2023 conditions.
For accurate California solar payback modeling, installers need design tools that correctly handle NEM 3.0 ACC tables, battery dispatch logic, and time-of-use rate plans. The generation and financial tool at SurgePV is built to handle this complexity for California projects.
What Most Installers Are Getting Wrong
This is the contrarian take. Most US residential installers in 2026 are misreading the moment in three specific ways.
Mistake 1: Treating TPO as a Fallback Instead of the Primary Product
Many installers still position TPO leases and PPAs as a backup option for homeowners who “cannot afford” ownership. That framing is six months out of date.
In 2026, TPO is the optimal financial structure for a large share of US households — not a fallback. A Sunrun or Palmetto lease passes the 30% commercial credit to the homeowner through lower payments. A cash purchase does not. For a homeowner without $20,000 sitting in checking, TPO is the only way to capture federal tax value.
Installers leading with cash quotes and pivoting to TPO when the customer balks are losing deals to competitors who lead with TPO. The conversation has flipped. Lead with the product that delivers the best math for that customer’s tax situation.
Mistake 2: Cutting Marketing Spend in a CAC Spike
Wood Mackenzie projects customer acquisition costs jumping 40% in 2026 to $0.84 per watt. Many regional installers responded by cutting marketing spend, reasoning that demand is contracting and ad costs are climbing.
That math is backwards. In a shrinking market, the installers who maintain marketing presence capture disproportionate share of remaining demand. Those who go dark hand customers to competitors and to TPO national players (Sunrun, Palmetto) who never stopped advertising. Wood Mackenzie’s data shows the installers gaining share in 2026 are those who increased marketing budgets relative to 2025, not cut them.
Mistake 3: Selling Solar Instead of Energy Independence
Pre-OBBBA, the residential solar pitch was simple: “Save money. Get a 30% tax credit.” That pitch is dead.
The pitch that works in 2026 — and is backed by survey data from pv magazine USA’s May 2026 reporting on shifting demand drivers — is energy independence. Homeowners increasingly buy solar for grid reliability, EV charging, backup power during outages, and protection from rising utility rates. Installers still leading with “save money” are missing the actual buying motivation of the 2026 customer.
The pv magazine USA report puts it directly: “The US residential solar market is transitioning from an incentive-driven luxury to an essential infrastructure necessity, as homeowners prioritize energy independence and grid resilience.”
Pro Tip — Reframe the Sales Conversation
If your 2026 sales script still opens with savings math, retire it. Open with grid reliability, utility rate inflation (US residential electricity prices rose 6.2% in 2025 per US EIA), or EV readiness. Get the customer talking about their pain. Then translate the solution into solar plus storage. The savings math is the closer, not the opener.
Quote US Residential Solar Right in the Post-ITC Era
SurgePV’s solar proposal software handles 2026 state-by-state incentives, NEM 3.0 California, TPO vs cash math, and accurate post-25D payback in one workflow. Stop quoting with stale federal credit assumptions.
Book a DemoNo commitment · 20 minutes · Live walkthrough with your US project pipeline
Sun Belt vs Northeast — Where Demand is Holding
The national 18% decline forecast masks sharp regional variation. Some markets are contracting much faster. A handful are growing.
Regional 2026 Growth Forecast
| Region | 2024 Volume Share | 2025 Volume Share | 2026 Direction | Primary Driver |
|---|---|---|---|---|
| California | 28% | 23% | Down 25–35% | NEM 3.0 + ITC loss compounding |
| Texas | 11% | 13% | Up 5–10% | Grid reliability, low CAC |
| Florida | 9% | 10% | Up 2–5% | Hurricane resilience, net metering |
| Arizona | 8% | 9% | Up 3–8% | Storage retrofit demand |
| New York | 7% | 8% | Flat | Strong state credits offset ITC |
| Massachusetts | 4% | 4% | Down 5–10% | SMART solar-only at $0/kWh |
| Northeast (other) | 8% | 9% | Flat to down 5% | Rate inflation supports demand |
| Carolinas + Southeast | 7% | 8% | Up 5–12% | New TPO penetration |
| Mountain West + Hawaii | 6% | 7% | Up 3–5% | Wildfire backup demand |
| Midwest + Plains | 12% | 9% | Down 10–20% | Cash/loan market weakest |
Sources: SEIA / Wood Mackenzie US Solar Market Insight Q4 2025, Ohm Analytics state-level data, pv magazine USA reporting. 2026 directional estimates synthesized from public installer guidance.
Why Texas and Arizona Are Holding Up
Texas added 2.3 GW of residential and small commercial solar from 2023 to 2025 according to ERCOT interconnection data. The state’s growth is driven by three factors that are independent of federal credits.
First, grid reliability. After Winter Storm Uri in 2021 and ongoing summer reliability concerns, Texas homeowners increasingly buy solar plus battery for resilience.
Second, low customer acquisition cost. Texas has a fragmented utility landscape and large geography, so paid customer acquisition costs are still around $0.50 to $0.65 per watt in 2026 — below the national average of $0.84 per watt.
Third, electricity rate inflation. Texas retail rates rose 38% between 2020 and 2025 per ERCOT and EIA data. Even without federal credits, customer-owned solar pencils on rate inflation alone.
Arizona shares similar dynamics: hot summers, grid concerns, falling solar prices ($2.09 per watt — the lowest in the country per EnergySage), and a strong battery retrofit market.
Why Mountain West and Hawaii Demand Is Resilient
Hawaii’s retail electricity rate averages $0.43 per kWh — the highest in the nation. Solar payback in Hawaii remains under 7 years even without federal credit. Demand has held up.
In the Mountain West (Colorado, New Mexico, Nevada, Utah), wildfire-driven Public Safety Power Shutoffs (PSPS) and storm outages drove a 28% growth in residential solar plus storage installations in 2024 (per Wood Mackenzie), and that demand is continuing into 2026.
Why the Midwest Is Bleeding
Midwest residential solar was disproportionately a cash and loan market. Most Midwest homeowners financed through bank loans or cash purchases that depended on the 30% federal credit for the deal to pencil. With that credit gone, retail electricity rates of $0.12 to $0.16 per kWh do not support payback math without state credits.
Ohio, Indiana, Iowa, and Missouri are projected to see 25 to 40% installation drops in 2026. Illinois holds up better thanks to the state’s SREC market and the Illinois Solar for All program. Also see: Best Solar Design Software India. See our guide on 5kW Solar Panel Price in India for more. For India-specific compliance details, see India andhra-pradesh.
For accurate state-level modeling that captures these regional dynamics, professional solar software tools with current incentive databases are essential. Manual incentive lookup tables fall out of date within months in this environment.
Financing Replaces Incentives — TPO, PPA, Loans
With the federal tax credit gone for ownership, financing structure is now the central economic variable in US residential solar. Three primary models compete in 2026.
Cash Purchase (Customer-Owned)
The traditional path. Homeowner pays $15,000 to $30,000 upfront, owns the system outright, captures all savings and any state-level incentives.
| Pros | Cons |
|---|---|
| Maximum lifetime savings | Largest capital outlay |
| Full ownership of SRECs (where applicable) | No federal tax credit in 2026 |
| Property tax exempt in 36 states | 9–13 year payback in $0.20/kWh states |
| Adds $15K–$25K to home value | All performance risk on owner |
Best fit: high-cost-electricity states (CA outside NEM 3.0 IOUs, MA, NY, HI), homeowners with cash on hand, those staying in the home 8+ years.
Solar Loan
Homeowner borrows $15,000 to $30,000 from a solar lender (Mosaic, Sunlight Financial, GoodLeap, Lightreach Loan) at rates currently 7.5% to 11% for 20 to 25 year terms.
| Pros | Cons |
|---|---|
| $0 down, immediate ownership | Interest cost over 25 years can equal system cost |
| Captures state credits | Loan rates eat into savings |
| 100% home value uplift | Performance risk still on owner |
| Builds equity | Default risk in soft economies |
Best fit: homeowners in $0.18+/kWh states with strong credit (FICO 700+) and confidence in staying long-term.
Third-Party Owned (TPO) — Lease or PPA
A solar company (Sunrun, Palmetto, Lightreach, Tesla Energy) owns the system, claims the 30% Section 48E commercial Investment Tax Credit, and either rents the equipment to the homeowner (lease) or sells the electricity to the homeowner (PPA) at a fixed rate below retail.
| Pros | Cons |
|---|---|
| $0 down | Lower lifetime savings than ownership |
| TPO captures 30% Section 48E credit | No state tax credits for homeowner |
| Maintenance included | Transferability complexity at home sale |
| Performance warranty on TPO provider | TPO provider must remain solvent |
Best fit: homeowners without cash for a purchase, those in moderate-cost-electricity states, anyone unable to use federal tax credit even when it existed.
Lifetime Cost Comparison: 8 kW System in California (Post-NEM 3.0 with Battery)
| Financing | Upfront Cost | Annual Net Bill | 25-Year Total Cost | 25-Year Bill Savings vs No-Solar |
|---|---|---|---|---|
| Cash purchase | $26,000 | $480 | $34,000 | $44,000 |
| Solar loan (8.5%, 25yr) | $0 | $1,920 (loan + bill) | $43,000 | $35,000 |
| Lease (TPO) | $0 | $1,560 (lease + bill) | $39,000 | $39,000 |
| PPA (TPO) | $0 | $1,680 (PPA + bill) | $42,000 | $36,000 |
Assumes $26,000 system + battery cost, $2,800 annual no-solar PG&E bill, 4% annual utility rate escalation, no battery degradation adjustment, lease/PPA escalator at 2.9% annually. Illustrative model — actual results vary.
The takeaway: for cash buyers, cash still wins. For everyone else, TPO is usually within 10% of solar loan economics with significantly less complexity, no performance risk, and bundled maintenance.
The TPO Risk Most Sales Reps Skip
TPO contracts are 20 to 25 years long. Sunnova entered bankruptcy in mid-2025. Mosaic filed for bankruptcy shortly after. SunPower’s residential business was acquired out of bankruptcy. Counterparty risk matters when the warranty depends on the TPO provider remaining solvent for two decades.
Homeowners signing TPO contracts in 2026 should ask three questions: who actually owns the system asset (often a tax equity partner, not the brand selling the lease), what happens if the brand goes bankrupt (the asset typically transfers to the owner of the underlying TEP), and what are the home sale transfer terms (most leases require buyer qualification — and approximately 4% of TPO home sales experience complications, per a 2024 LBNL study).
Key Takeaway — Financing Is the Whole Conversation Now
In 2024, financing was a closing detail. In 2026, financing structure determines whether the deal pencils at all. Installers selling cash and loans only are losing 40 to 60% of qualified leads to TPO providers. Get a TPO partner — Sunrun Channel, Palmetto, Lightreach, Goodleap Pre-paid Lease — set up in your stack by Q2 2026 or accept a smaller addressable market.
2026 to 2028 Outlook
The post-ITC contraction is real but not permanent. Wood Mackenzie and SEIA both forecast recovery beginning in 2027, with average annual growth of 7% from 2027 to 2030 for residential solar.
Five-Year US Residential Solar Forecast
| Year | Annual Volume (GWdc) | Year-on-Year Change | Primary Driver |
|---|---|---|---|
| 2024 | 6.0 | −31% | High interest rates, NEM 3.0 |
| 2025 | 5.9 | −2% | Pull-forward demand pre-OBBBA |
| 2026 | 4.8 | −18% | Section 25D expiration |
| 2027 | 5.3 | +10% | Rate inflation, TPO normalization |
| 2028 | 5.8 | +9% | Solar cost continued decline |
| 2029 | 6.3 | +9% | Domestic supply ramp |
| 2030 | 6.7 | +7% | Mass-market penetration |
Sources: Wood Mackenzie Residential Solar Forecast (Q4 2025), SEIA US Solar Market Insight, with directional 2027–2030 extrapolation from public Wood Mackenzie commentary.
What Drives the 2027 Recovery
Three factors set up a 2027 inflection.
First, retail electricity rate inflation continues. US residential electricity prices rose 6.2% in 2025 per US EIA. Wood Mackenzie projects average annual increases of 4 to 6% through 2028 driven by transmission upgrades, data center load growth, and gas price volatility.
Second, solar costs keep falling. EnergySage’s $2.58 per watt 2026 floor is expected to drop to $2.30 to $2.40 per watt by 2028 as FEOC restrictions normalize and domestic supply ramps. Per Solar.com analysis, each 1% reduction in interest rates equates to roughly $0.15 per watt cost reduction. Federal Reserve rate cuts expected through 2026 and 2027 should add $0.30 to $0.45 per watt of effective cost relief.
Third, TPO ITC adders are accelerating. The Section 48E commercial credit includes bonus adders for domestic content (10%), energy community location (10%), and low-income community (10 to 20%). TPO providers that qualify for stacked adders can capture up to 70% credit, with margin passed to homeowners as lower lease payments.
The 2027 Cliff Risk
The Section 48E commercial Investment Tax Credit expires at the end of 2027 under OBBBA. The residential industry faces deadlines of July 4, 2026 to safe harbor long-term solar projects and December 31, 2027 to complete projects not covered under safe harbor.
If Section 48E expires without extension, the TPO model loses its primary economic engine. Wood Mackenzie’s base case assumes some form of TPO incentive will be extended through legislation between 2026 and 2027. The downside case (no extension) would extend the contraction through 2028 and 2029.
FEOC Headwinds
The Foreign Entity of Concern (FEOC) restrictions in OBBBA limit federal credit eligibility for systems using equipment from China and certain other countries. The Material Assistance Cost Ratio (MACR) starts at 40% in 2026 and increases 5 percentage points yearly to 60% by 2030.
For installers, this means more careful equipment sourcing, longer lead times on FEOC-compliant modules, and continued pricing volatility. Final IRS rules on “material assistance” are not expected until late 2026, creating ongoing TPO vendor approval uncertainty.
What This Means for Installers and Sales Teams
Surviving 2026 as a residential solar installer requires explicit changes in operations, sales, and offering mix.
Operational Changes That Matter
Vertically integrate sales. Wood Mackenzie data shows installers using outsourced dealer networks faced the largest 2026 margin compression. Companies bringing customer acquisition in-house (door-to-door, paid search, referral programs) preserve more margin per watt.
Expand the service offering. EnergySage’s H2 2025 marketplace report shows 51% of installers regularly service systems they did not install. As installer bankruptcies create orphaned systems and older Section 25D-era systems age past their first inverter, service and repair are a real revenue stream.
Add adjacent products. Solar plus battery is table stakes. Add EV chargers (15 to 22% attach rate among new solar customers), roofing (especially in hurricane- and hail-prone markets), heat pumps, and home energy management systems. Installers diversifying beyond pure solar reported 18% higher 2025 revenue per customer per Wood Mackenzie.
Sales Playbook Updates
Lead with energy independence, not savings. The 2026 buyer cares about resilience first, monthly bill reduction second.
Quote TPO and cash side-by-side. Letting the customer compare $0-down lease numbers vs cash purchase math at the first call doubles close rates per Sunrun and Palmetto channel partner data.
Master the state incentive map. State income tax credits, sales tax exemptions, and property tax exemptions are now the dominant tax structure. New York 25% state credit closes deals. Texas property tax exemption closes deals. Generic national pitches lose to localized ones.
Use post-ITC payback math by default. Software defaults matter. The first installer to misstate a federal credit in front of a customer is the first installer to lose trust.
Tool Stack for 2026
A residential solar installer in 2026 needs four things to operate effectively.
-
Design and proposal software that handles state-by-state incentives, NEM 3.0 California, and TPO vs cash comparisons. SurgePV’s solar designing and solar proposals modules cover this end-to-end.
-
Accurate shadow analysis software for site-specific yield modeling. Battery sizing math depends on accurate self-consumption ratios that depend on accurate annual production curves.
-
A TPO partnership (Sunrun, Palmetto, Lightreach, Goodleap) for customers without cash.
-
A CRM with installer-specific lead routing — generic CRMs miss solar-specific pipeline stages.
For installers ready to professionalize their proposal workflow with built-in 2026 incentive modeling, see the solar design software approach SurgePV takes — purpose-built for residential and commercial solar professionals.
Conclusion
Three concrete actions for any US residential solar business in 2026.
-
Get TPO product live in your sales workflow by end of Q2 2026 — Sunrun Channel, Palmetto Hyperion, Lightreach, or Goodleap Pre-paid Lease. Customers without $20,000 cash now demand a $0-down structured option, and Section 48E credit pass-through makes the math competitive with ownership for most non-cash buyers.
-
Update every proposal template to remove the Section 25D federal credit by default. Add state-specific credit lookup logic — New York 25% income tax credit, Massachusetts 15% income tax credit, property tax and sales tax exemptions where applicable. Quoting stale federal incentives in 2026 ends conversations.
-
Reframe sales conversations around grid reliability, EV charging readiness, and electricity rate inflation. Use US EIA data — residential rates rose 6.2% in 2025 — as the opening data point, not a tax credit math problem. Then translate the solution into solar plus storage with TPO or cash optionality.
The 18% volume decline is real. The 40% CAC spike is real. The market will be smaller in 2026 than 2025. But the installers who restructure their sales, financing, and operating model — instead of waiting for incentives to come back — will pick up share when the 2027 recovery starts.
For broader US solar market context, see related guides on commercial solar market outlook 2026, solar customer acquisition cost, and how to upsell battery storage on every residential solar quote. For the design and proposal tooling that powers post-ITC quoting accuracy, solar software from SurgePV handles current 2026 incentive logic across all 50 states.
Frequently Asked Questions
What are the biggest US residential solar market trends in 2026?
The biggest US residential solar market trends in 2026 are a projected 18% drop in customer-owned installations after the Section 25D 30% Investment Tax Credit expired on Dec 31, 2025, a 40% spike in customer acquisition costs to $0.84 per watt according to Wood Mackenzie, a sharp pivot to third-party ownership (TPO) leases and PPAs which still qualify for Section 48E, and 70% battery attachment rates in California under NEM 3.0. National average price stands at $2.58 per watt per EnergySage marketplace data.
Is residential solar still worth it in the US in 2026 without the federal tax credit?
Yes — residential solar remains financially viable in 2026 for most US homeowners paying above $0.20 per kWh. A typical system pays back in 10 to 13 years and saves $40,000 to $60,000 over 25 years, according to Solar.com analysis. Returns are strongest in California, Hawaii, New York, Massachusetts, and the Northeast where retail electricity rates exceed $0.30 per kWh. TPO models like leases and PPAs are now the dominant pathway for homeowners who want zero-down solar with monthly savings.
How did NEM 3.0 affect the California residential solar market?
NEM 3.0 cut export compensation from full retail rate (around $0.30 to $0.40 per kWh under NEM 2.0) to avoided cost (around $0.05 to $0.08 per kWh) — roughly a 75% reduction. California sales fell 60% to 80% and the state lost over 17,000 solar jobs according to CALSSA. The 1st District Court of Appeal upheld NEM 3.0 in March 2026. Battery attachment rates jumped from 11% before April 2023 to nearly 70% by late 2024 because storage became the only way to capture meaningful solar value.
What is the average cost of residential solar per watt in the US in 2026?
The US national average residential solar cost is $2.58 per watt according to EnergySage marketplace data for 2026, with a 12 kW system averaging $30,505 before any state incentives. State variation is wide: Arizona is cheapest at $2.09 per watt while New Hampshire is most expensive at $3.18 per watt. Prices have dropped 61% since 2010 from $7.14 per watt per LBNL Tracking the Sun. Module shortages from FEOC restrictions may cause pricing volatility through 2026. For more on this topic, see Solar Racking Design Guide.
Which US states still offer the best residential solar incentives in 2026?
New York and Massachusetts lead with state income tax credits — 25% up to $5,000 in New York, and 15% up to $1,000 in Massachusetts. Massachusetts also runs the SMART performance-based incentive (now battery-paired only). New York adds NY-Sun rebates worth thousands of dollars for LMI homeowners. Texas and Florida offer property tax and sales tax exemptions but no direct credits. Arizona, Hawaii, New Mexico, South Carolina, and Utah also offer personal tax credits for solar.
What is the TPO solar boom and why is it happening in 2026?
TPO stands for third-party ownership — solar leases and power purchase agreements (PPAs) where a company owns the system and sells the homeowner power or rents the equipment. The TPO boom in 2026 is driven by Section 48E of the IRA, which still allows the 30% commercial Investment Tax Credit through 2027 for company-owned systems. Since Section 25D for customer-owned systems expired Dec 31, 2025, TPO is now the only way most US homeowners can access federal solar tax benefits — typically passed through as lower monthly payments.
How big is the US residential solar market in 2026?
The US distributed solar industry installed 8.4 GWdc in 2025 (a 5% decline from 2024) according to SEIA and Wood Mackenzie’s Q4 2025 Solar Market Insight Report. Residential was approximately flat at a 2% contraction in 2025. SEIA and Wood Mackenzie forecast an 18% drop in residential installations in 2026 due to the Section 25D expiration, before recovery in 2027. Average annual growth of 7% is expected from 2027 through 2030 as retail electricity rates rise and solar costs continue to fall.
What does the post-ITC residential solar market mean for installers and sales teams?
Post-ITC, US solar installers face a 40% spike in customer acquisition costs to $0.84 per watt according to Wood Mackenzie, forcing a strategic reckoning. Successful installers in 2026 are pivoting from loan-focused sales to prepaid lease and TPO products, vertically integrating customer acquisition (bringing sales in-house), bundling solar with batteries, EV chargers, and roofing, and diversifying revenue with service contracts. EnergySage data shows 51% of installers regularly service systems they did not originally install — a growing revenue stream.
Key sources cited in this guide:
- SEIA / Wood Mackenzie US Solar Market Insight Q4 2025
- EnergySage 2026 Solar Panel Cost Data
- Wood Mackenzie Residential CAC Outlook 2026
- pv magazine USA — Residential Demand Shifts to Infrastructure (May 2026)
- pv magazine USA — California Court Upholds NEM 3.0 (Mar 2026)
- Solar.com 2026 Pricing Analysis
- Solar.com State Incentives Guide 2026 Solar proposal software generates professional quotes in minutes.