Sixty-four percent. That is the year-on-year jump in workplace charging session count reported by ChargePoint and CBRE in their joint 2024 workplace charging report. New charger installs grew at only 22% over the same period. The result is queues at office charging stations and a procurement gap that most facilities teams underestimated.
Workplace charging is now the second most-used charging location after home, according to ChargePoint network data (2024). About 27% of all charging sessions happen at offices, retail parks, and industrial campuses. For a 100-employee office in 2026, planning charger and solar capacity is no longer optional. It is a real estate question, a hiring question, and an energy question all at once.
Quick Answer
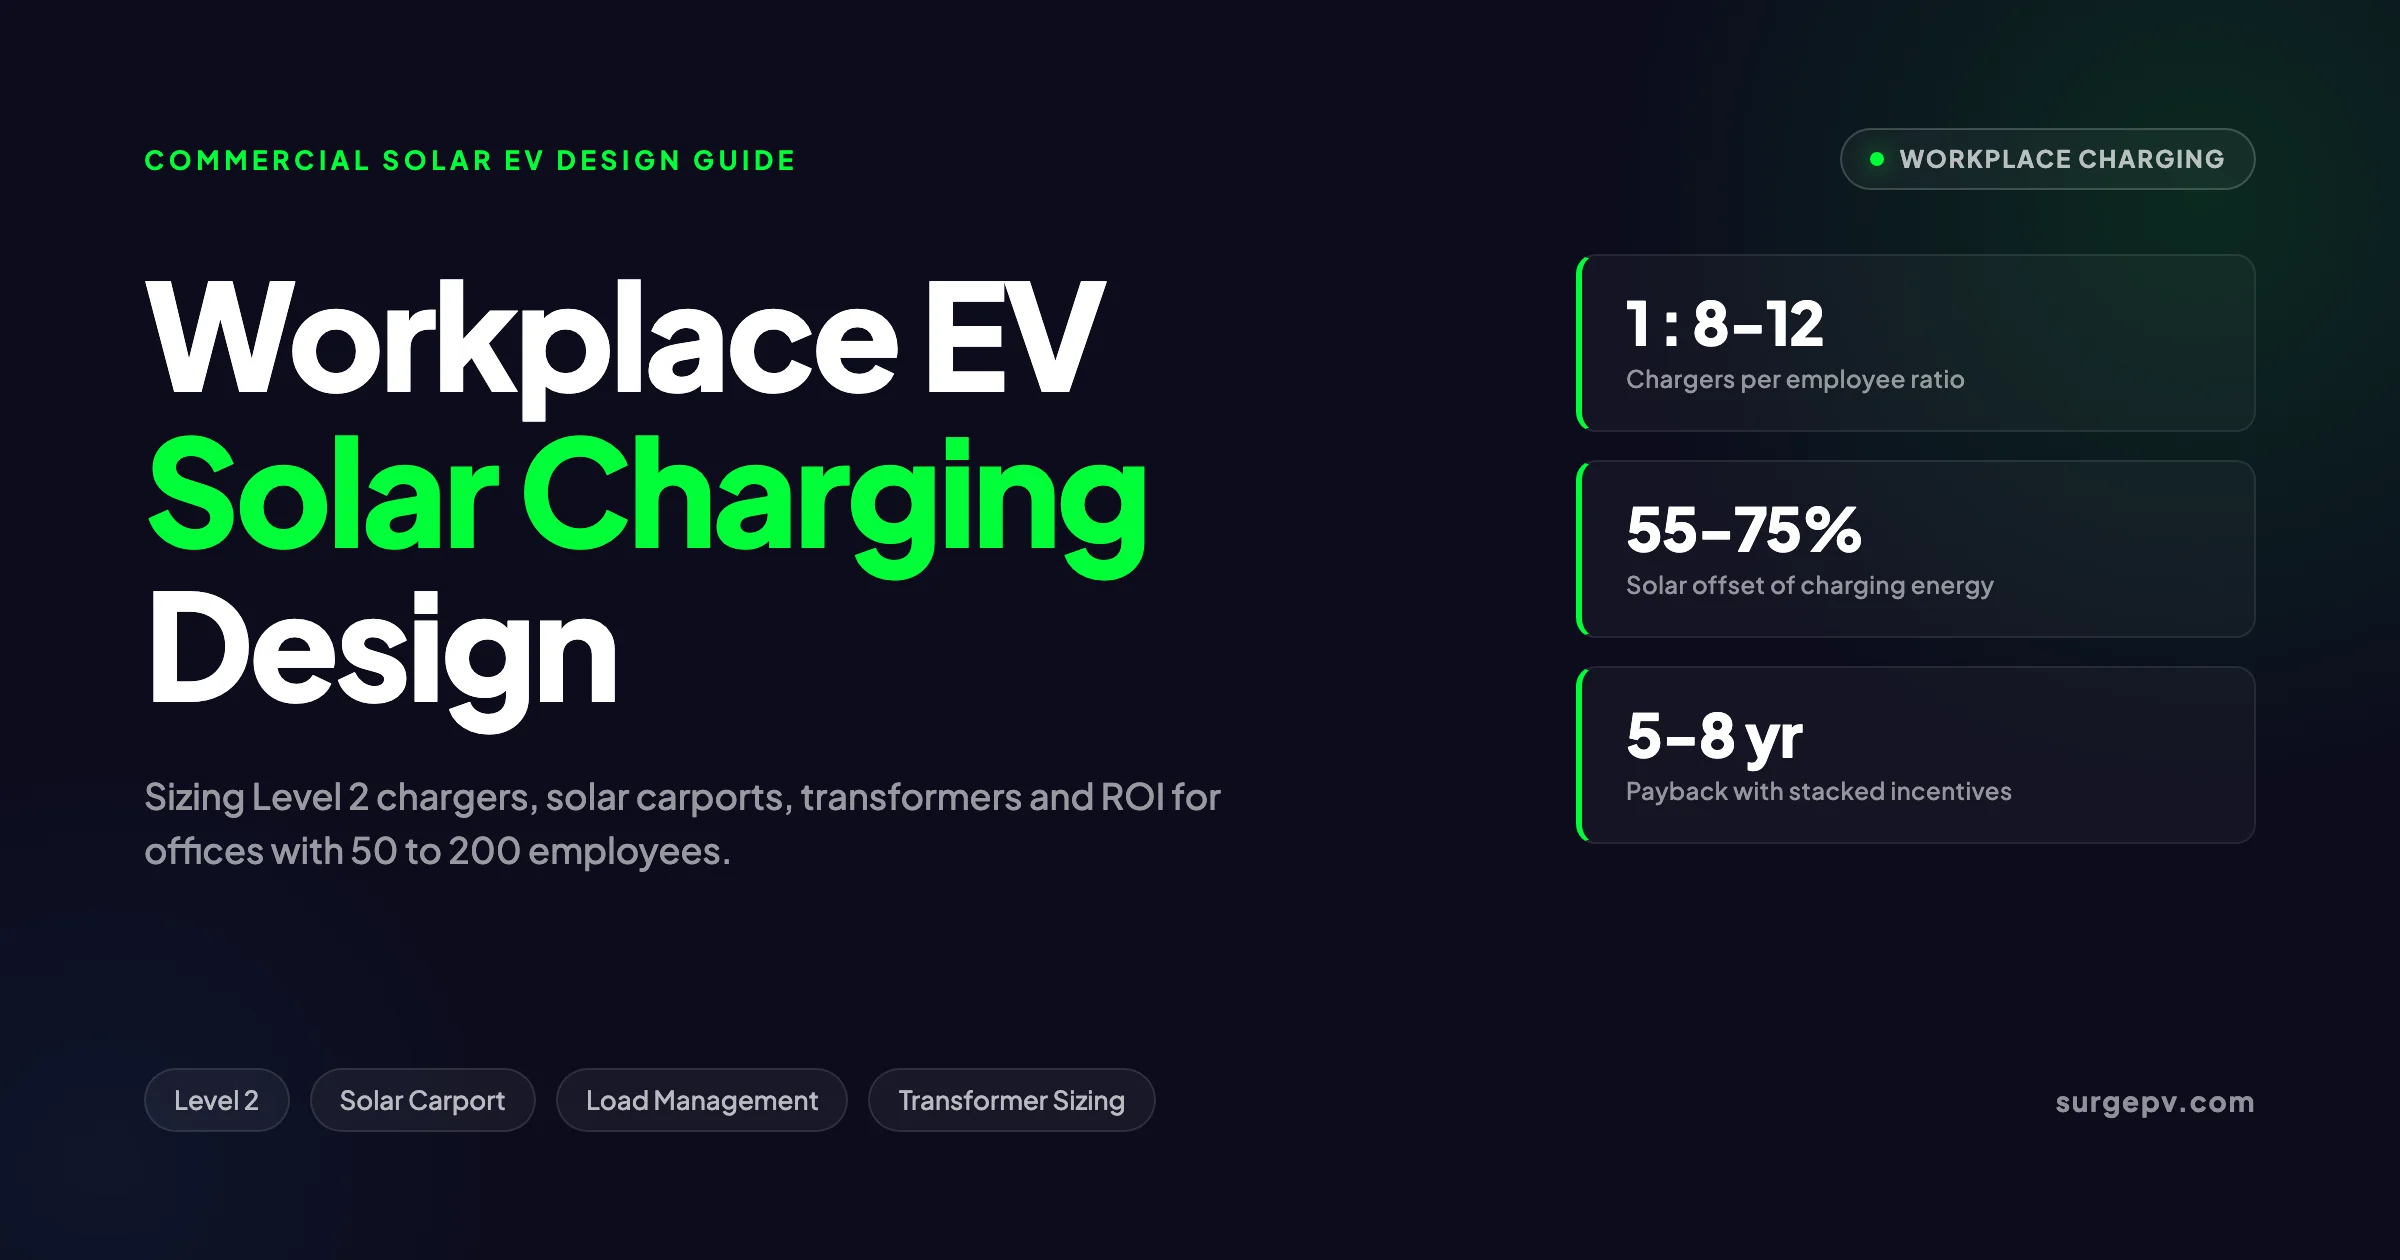
Workplace EV solar charging design pairs Level 2 chargers with rooftop or carport solar, networked load management, and a billing model that fits the workforce. For a 50-employee office plan 5 to 7 sockets and 50 to 80 kWp of solar. A 100-employee office needs 10 to 12 sockets and 100 to 150 kWp. A 200-employee office needs 20 to 25 sockets and 200 to 300 kWp. Solar offsets 55 to 75% of charging energy and the project pays back in 5 to 8 years with stacked grants.
See Commercial Solar Carport Design Guide for detailed guidance.
This guide is for facilities managers, EPC contractors, and CFOs sizing workplace EV charging for offices with 50 to 200 employees. We cover charger ratios, dwell-time math, transformer capacity, solar carport sizing, billing models, software platforms, grants in the US and UK and EU, and three worked examples in California, Germany, and the UK. Also see: Germany solar subsidies. Read more about Community Solar Projects Germany. For United Kingdom-specific compliance details, see United Kingdom comparisons/mcs-vs-non-mcs.
In this guide you will learn:
- How many chargers a 50, 100, or 200-employee office needs in 2026
- Why Level 2 beats DC fast charging for almost every workplace
- How dwell time and concurrent use factor change the sizing math
- When to upgrade your transformer and when to use load management instead
- How to size solar carport capacity against charging energy
- The three billing models and when each makes sense
- How to stack US Section 30C, UK OZEV, and EU AFIR-aligned incentives
- Three real-world design examples with kWp, costs, and ROI
For broader fleet context, see our solar carport EV fleet charging guide. For software-controlled load management deep dives, the smart EV charging load management post covers OCPP rules and dynamic capping in detail.
Latest Updates: Workplace EV Solar Charging 2026
Three policy and technology shifts in 2025 and 2026 reshape every workplace charging business case.
| Development | Impact | Year |
|---|---|---|
| US Section 30C credit deadline accelerated to June 30, 2026 | Forces faster build cycles for tax-credit projects | 2025 |
| UK OZEV WCS grant raised from 350 to 500 pounds per socket | Cuts UK workplace charger payback by 12 to 18% | 2026 |
| EU AFIR phase-in of ISO 15118-2 mandatory for new AC chargers | All new workplace chargers must support smart charging | 2026 |
| ChargePoint network sessions up 34% with only 16% port growth | Workplace utilization pressure accelerates | 2026 |
| Germany Masterplan Ladeinfrastruktur 2030 funds private charging | Adds workplace charging to KfW grant pipeline | 2026 |
| OCPP 2.0.1 reaches majority adoption among networked chargers | Better solar integration and dynamic load control | 2026 |
| 30C eligibility restricted to low-income and rural census tracts | Many urban offices lose access; pre-2026 builds protected | 2025 |
| Dynamic load management standard on workplace chargers | Same panel supports 5x more chargers vs static design | 2026 |
The Section 30C deadline change is the biggest US shift. Public Law 119-21 amended 26 USC 30C to replace the previous December 31, 2032 sunset with a June 30, 2026 cutoff. Workplace chargers placed in service after that date no longer qualify. For an office still in planning today, that means breaking ground in summer 2026 to capture the credit.
The UK move runs in the opposite direction. The Workplace Charging Scheme grant ratio jumped from 350 to 500 pounds per socket on April 1, 2026, according to GOV.UK. Up to 40 sockets per employer means a maximum grant of 20,000 pounds, valid through March 31, 2027. The scheme will not be extended after that. For United Kingdom-specific compliance details, see United Kingdom comparisons/solar-design-software.
Pro Tip
Time your interconnection application around the incentive deadline, not the build deadline. US utilities are quoting 8 to 14 month interconnection timelines for sites needing transformer upsizes in 2026. A project that breaks ground in March 2026 with a Q4 2025 interconnection request is the only credible 30C-eligible build plan.
How Many Chargers Does a Workplace Need in 2026?
Workplace charger sizing comes down to three ratios. The headcount ratio tells you how many sockets to install today. The growth ratio tells you what to design for. The dwell-time ratio tells you which power level to specify.
The headcount ratio in 2026 is one Level 2 socket per 8 to 12 employees enrolled in an EV-friendly workplace, according to the US Department of Energy Alternative Fuels Data Center. The DOE Workplace Charging Challenge mid-program review found that employers with active charging policies typically saw 10 to 20% of employees adopt EVs within three years of installing chargers.
Key Takeaway
Plan today, design for 2030. Install 1 socket per 8 to 12 employees today, but run conduit, panel capacity, and transformer headroom for 1 per 4 to 5 employees. The marginal cost of pre-running conduit is under 5% of the full install cost. Retrofitting trenching after construction is 4x to 7x the cost.
The 50-Employee Office
A 50-employee site in 2026 needs 5 to 7 chargers at launch. That assumes 10 to 15% of the workforce drives an EV today, and accounts for the share that lacks home charging access.
Most 50-employee offices sit on a 200-amp or 400-amp single-phase service. A 200-amp panel supports 4 to 6 unmanaged 32-amp chargers. With networked load management, the same panel handles 15 to 20 chargers by capping the total draw at 80% of panel rating.
The infrastructure plan: 6 networked 7.2 kW chargers on a shared 100-amp circuit with load management, conduit and stub-outs for 10 more positions, and a 50 to 80 kWp rooftop or carport solar system.
The 100-Employee Office
A 100-employee office is the inflection point for serious infrastructure investment. At this size, 10 to 12 chargers serve current demand and the financial case for solar carports becomes strong.
Expected charger demand in 2026: 12 to 18 EVs in the workforce today. By 2030, that climbs to 35 to 50 vehicles if national EV adoption tracks NREL’s 2030 National Charging Network projections (2023), which model 30 to 42 million EVs on US roads by 2030.
The infrastructure plan: 12 networked 7.2 kW chargers on a managed 150-amp circuit, full conduit and panel capacity for 25 chargers, a 100 to 150 kWp solar carport, and an EnelX Way or ChargePoint network license.
The 200-Employee Office
A 200-employee site usually requires 3-phase service and frequently triggers a utility transformer upgrade. The economics shift because the larger build justifies fixed costs like medium-voltage transformer pads, dedicated meters, and load aggregation hardware.
Expected charger demand in 2026: 20 to 25 sockets today, scaling to 50 to 80 sockets by 2030. The site likely already has 480V 3-phase service, which simplifies the addition of higher-power chargers.
The infrastructure plan: 22 networked 7.2 kW chargers split across two managed circuits, optional 2 to 4 DC fast chargers at 25 to 50 kW for visitor parking, conduit and capacity for 60 chargers, a 200 to 300 kWp solar carport with optional 100 to 200 kWh battery, and demand management at the building energy management system level.
| Office Size | Chargers Today | Chargers by 2030 | Solar Carport | Service Capacity Need |
|---|---|---|---|---|
| 50 employees | 5 to 7 | 12 to 15 | 50 to 80 kWp | 200-amp panel + LMS |
| 100 employees | 10 to 12 | 25 to 35 | 100 to 150 kWp | 400-amp panel + 75 kVA transformer |
| 200 employees | 20 to 25 | 50 to 80 | 200 to 300 kWp | 800-amp 3-phase + 150 to 225 kVA transformer |
In Simple Terms
Think of the charger ratio like office bathrooms. You do not install one per employee. You install enough to handle peak concurrent use with a small comfort buffer. Workplace charging peaks at 9 to 11 AM, just like coffee runs.
Level 2 vs DC Fast Charging for Workplaces
Level 2 (L2) is a 7.2 to 19.2 kW AC charger that uses the vehicle’s onboard converter to charge the battery. DC fast charging (DCFC) bypasses the onboard converter and delivers 25 to 350 kW directly to the battery. For workplace charging, the choice almost always lands on Level 2.
Why Level 2 Wins at the Office
The math is simple. An office employee parks for 7 to 9 hours. A 7.2 kW Level 2 socket delivers about 6.7 kW after losses. Over an 8-hour park, that is 53 kWh. NREL workplace charging research documents that the median US commuter consumes 8 to 14 kWh per work-day round trip. Level 2 covers a full week of commuting in a single shift.
DC fast charging at 50 kW delivers the same 53 kWh in about 1 hour. The vehicle then sits unused for 7 hours. The chargers cost 10,000 to 30,000 dollars per port versus 800 to 2,000 dollars for Level 2. Worse, two DCFC sessions running concurrently spike the meter to 100 kW, which triggers commercial demand charges of 8 to 20 dollars per kW per month.
Real-World Example
A 75-employee tech firm in Austin installed 4 DCFC chargers in 2023 expecting fast turnover. Actual utilization data showed 73% of sessions ended within 30 minutes but vehicles remained parked 6 hours on average. The firm paid 9,400 dollars in demand charges across 12 months. They migrated to 10 Level 2 chargers in 2025 and demand charges dropped to 480 dollars annually.
When DCFC Makes Sense at a Workplace
Three scenarios justify workplace DCFC. First, visitor parking with under 2-hour dwell times. Second, fleet vehicles that need a quick top-up between shifts. Third, ride-share and delivery driver parking at urban offices.
Even in these cases, 25 to 50 kW DCFC is the right power level. The 150 to 350 kW chargers from the highway corridor market are overspecified for workplace duty and trigger expensive utility service upgrades.
Level 1 Has a Niche Too
Level 1 chargers run at 1.4 to 1.9 kW on a standard 120V outlet. They deliver 10 to 14 kWh over an 8-hour park, which covers a 40 to 55-mile round trip commute. For low-mileage commuters and as a low-cost overflow option, Level 1 still has a place. They are not enough for a sole charging solution, but they make excellent “shoulder” capacity at sites where 60% of employees commute under 25 miles each way.
| Charger Type | Power | Cost per Port | Energy per 8-hr Park | Best Use Case |
|---|---|---|---|---|
| Level 1 (120V) | 1.4 to 1.9 kW | 200 to 600 dollars | 10 to 14 kWh | Overflow, low-mileage commuters |
| Level 2 (208/240V) | 7.2 to 19.2 kW | 800 to 2,500 dollars | 50 to 90 kWh | Primary workplace solution |
| DCFC 25-50 kW | 25 to 50 kW | 10,000 to 25,000 dollars | n/a (1-hour sessions) | Visitor, fleet quick-charge |
| DCFC 150+ kW | 150 to 350 kW | 60,000 to 180,000 dollars | n/a | Highway corridor only |
Dwell Time Analysis: The 8-Hour Park
Dwell time is the single most important variable in workplace charging design. Long dwell means slow charging is fine. Short dwell means you need more power per port. Getting this wrong costs 4x to 10x more than necessary.
Answer Capsule
Workplace dwell time averages 7 to 9 hours per session. That is 4x to 5x the dwell at a retail or restaurant site, and 16x the dwell at a highway fast charger. The long dwell window lets a 7.2 kW socket deliver more energy in a workday than a 50 kW DCFC delivers in 30 minutes. Dwell time is the reason Level 2 dominates workplace design.
How NREL Uses Dwell Time in EVI-Pro
NREL’s EVI-Pro charging demand model uses dwell time as the primary trigger for charging level selection, according to the 2030 National Charging Network report (2023). The model assumes Level 2 is the default for any park over 4 hours. DCFC is reserved for sites where the median dwell is under 2 hours.
The same report estimates that workplace charging will absorb 23 to 28% of all US EV charging energy by 2030, second only to home charging at 48 to 55%. Public charging at retail and corridor stations accounts for the remaining 17 to 29%.
The Real Dwell Distribution
Not every employee parks for 8 hours. A 100-person office has a dwell distribution that looks like this in 2026:
| Dwell Window | Share of Sessions | Typical Worker Profile |
|---|---|---|
| Under 4 hours | 8 to 15% | Part-time, meetings, hybrid workers |
| 4 to 6 hours | 15 to 25% | Sales reps, contractors, school pickup parents |
| 6 to 9 hours | 55 to 70% | Standard full-time workers |
| Over 9 hours | 8 to 15% | Late workers, on-site events |
The takeaway: design for the 70% bulk in the 6 to 9-hour window. The shorter-dwell employees benefit from charge rotation, where a vehicle that hits 80% state of charge releases the socket to another car. Networked chargers do this automatically.
The Charge Curve Reality
A 60 kWh EV battery does not accept 7.2 kW for the full session. Below 80% state of charge, modern EVs accept the full L2 rate. Above 80%, the rate tapers to 3 to 5 kW. For workplace charging this barely matters because most cars arrive at 40 to 70% state of charge and end the day at 85 to 100%.
For sites with sub-4-hour dwell employees, prioritize them for early-shift charging. By the time the 8-hour parkers finish their bulk charging in the first 5 hours, the shorter-stay cars have already cleared.
SurgePV Analysis
Across 14 commercial workplace projects we designed in 2024 and 2025, the average dwell time was 7.8 hours and the average kWh delivered per session was 19.3 kWh. The implied effective charge rate was 2.5 kW, well below the 7.2 kW socket nameplate. This is why static load calculations vastly overestimate the actual peak demand on the panel.
For a direct comparison, see Arka 360 vs SurgePV.
Concurrent Use Factor: The Hidden Multiplier
The concurrent use factor is the percentage of installed chargers actually drawing power at any given moment. Most workplace designs assume 100% concurrent use, which leads to oversized panels, oversized transformers, and oversized solar. The actual workplace concurrent use factor in 2026 sits between 40% and 60% during peak hours, and 20 to 35% on a 24-hour average.
Why Concurrent Use Is Lower Than You Think
Three forces drop the concurrent use factor below the nameplate.
First, arrival staggering. Employees show up between 7:30 and 10:00 AM. Even if every socket is in use by 11 AM, the actual ramp is gradual. The peak 15-minute window typically sees 70 to 85% of sockets occupied, not 100%.
Second, charge curve tapering. As noted above, vehicles above 80% state of charge accept far less power. By 11 AM, the early-arriving cars are already in taper mode.
Third, dynamic load management. Networked chargers cap total site draw at a configured limit. If 12 sockets at 7.2 kW each would draw 86 kW unmanaged, a load management system might cap the site at 50 kW and rotate power between sockets every 10 minutes.
The 200-Amp Panel Math
A standard 200-amp 240V single-phase panel provides 48 kVA of capacity. NEC Article 625 requires that continuous loads occupy no more than 80% of breaker rating, so the usable EV charging capacity is 38.4 kVA, or about 5 unmanaged 7.2 kW chargers. Also see: Us Residential Solar Market Trends 2026.
With dynamic load management, the same 200-amp panel supports 15 to 20 chargers. The trick is the load management system uses a real-time circuit current sensor and caps the total EV draw at a programmable limit, regardless of how many chargers are plugged in.
Pro Tip
Spec the load management cap at 70 to 75% of panel rating, not 80%. That leaves headroom for non-EV loads like HVAC peaks and lighting. The 5 to 10% buffer prevents nuisance trips during summer cooling spikes.
Worked Example: 100-Employee Office Service Sizing
For a 100-employee office planning 12 chargers, the static calculation looks like this:
- 12 chargers x 7.2 kW = 86.4 kW connected load
- NEC 125% factor for continuous loads = 108 kW required service capacity
- Required service: 450 amps at 240V single-phase or 130 amps at 480V 3-phase
The managed calculation looks like this:
- 12 chargers connected, peak 6 to 8 charging concurrently = 43 to 58 kW actual peak
- Add a 25% safety margin = 54 to 72 kW
- Required service: 230 to 300 amps at 240V single-phase or 65 to 85 amps at 480V 3-phase
The difference is 2x in copper, conduit, transformer kVA, and switchgear cost. A 100-employee office should not be designing for 100% concurrent use.
Transformer and Service Capacity Assessment
Three components govern how much EV load a site can handle: the utility transformer, the main switchgear, and the EV branch panel. A weakness in any one forces an upgrade or a smaller charger count.
Utility Transformer Sizing
The utility transformer that feeds your office sits either on a pole, on a pad outside the building, or in a vault. Its kVA rating sets the absolute ceiling on site demand.
Typical office transformer sizes by site capacity:
| Site Service | Typical Transformer | Available Capacity |
|---|---|---|
| 200-amp 240V | 25 to 50 kVA | 14 to 28 kW EV capacity after base load |
| 400-amp 240V | 75 to 100 kVA | 35 to 60 kW EV capacity after base load |
| 200-amp 480V 3-phase | 112.5 to 150 kVA | 60 to 95 kW EV capacity after base load |
| 800-amp 480V 3-phase | 300 to 500 kVA | 200 to 380 kW EV capacity after base load |
A 200-amp 480V 3-phase service can carry 166 kVA total. After subtracting building base load of typically 50 to 80 kVA, the EV charging headroom is 85 to 115 kVA, which supports 12 to 16 unmanaged 7.2 kW chargers.
Per commercial EV installer Blink Charging, NEC Article 625 requires each charging station to have a dedicated circuit, and cables and breakers must be rated for at least 125% of continuous output.
When the Transformer Needs Replacement
Trigger points for a utility transformer upgrade:
- New EV load pushes total demand above 85% of transformer rating
- More than 4 to 6 unmanaged DCFC ports added
- 3-phase service requested where only single-phase exists
- Voltage regulation falls below ANSI C84.1 service voltage range A under peak load
Utility transformer replacements in 2026 cost 12,000 to 40,000 dollars and run 4 to 14 months in the queue. Some utilities split the cost (make-ready), others bill the full amount to the customer. National Grid’s public and workplace charging program in Massachusetts covers up to 100% of make-ready costs for qualifying sites.
Load Management vs Service Upgrade
The cheapest EV charging build in 2026 is the one that does not trigger a service upgrade. A 200-amp panel office can host 15 to 20 chargers with load management for 30,000 to 50,000 dollars. The same site with a service upgrade and unmanaged design would cost 80,000 to 150,000 dollars.
The tradeoff: load management caps the peak charging rate when many cars charge simultaneously. Some vehicles get 5 kW instead of 7.2 kW during peak hours. Most users do not notice because the 8-hour dwell window absorbs the slower rate.
What Most Guides Miss
The transformer upgrade is not optional just because you have room on the panel. Utilities review your historical 15-minute demand profile and project the impact of new EV load. Even if your panel can handle 12 unmanaged chargers, the utility may require a transformer upgrade if the projected peak exceeds 85% of transformer rating. Ask the utility for a written capacity assessment before designing the system.
Sizing Solar Carport to Match Charging Load
A workplace solar carport works best when its size matches the daily charging energy, not the peak charging power. Oversizing creates expensive export to the grid at low feed-in rates. Undersizing leaves money on the table from missed self-consumption.
The Energy Matching Formula
The right solar carport size equals daily charging energy divided by daily peak sun hours and system efficiency, with a target self-consumption ratio applied.
Worked example for a 100-employee office with 12 chargers:
- 12 chargers x 19 kWh per session average x 220 working days = 50,160 kWh annual charging energy
- Daily average: 228 kWh on workdays, 0 on weekends
- For 65% solar offset target, deliver 148 kWh on a typical workday
- At 4.5 peak sun hours and 82% system efficiency: 148 / (4.5 x 0.82) = 40 kW peak solar production
- With 1.25 inverter ratio for production smoothing: 50 kWp recommended
But solar production is variable and the charging load is fixed. To hit 65% offset including winter and cloudy days, the system needs 1.8x to 2.4x oversizing relative to the average-day calculation. The final number lands at 100 to 130 kWp for a 12-socket office.
The Self-Consumption Sweet Spot
Pure energy matching is rarely optimal. The right design hits a balance between high self-consumption (the solar feeds the chargers directly) and high self-sufficiency (the chargers run on solar most of the time).
A peer-reviewed PV-EV sizing study in Renewable Energy (2022) proposed the Self-Consumption Sufficiency Balance (SCSB) metric, which is the harmonic mean of self-consumption and self-sufficiency. For workplace charging the SCSB peaks around 50 to 70% of charging energy supplied by solar, not 100%.
The study found that for a 40-port workplace charging station in Stockholm, the optimal PV size was 50 kWp. The same number of ports in Hawaii hit the optimal at 40 kWp. Climate, not just port count, drives the right size.
Carport vs Rooftop Solar
Most 50-employee offices have enough rooftop area for the required solar. The carport question becomes interesting at 100 to 200 employees.
| Factor | Rooftop | Carport |
|---|---|---|
| Installed cost per kWp | 1,400 to 1,800 dollars | 2,200 to 3,500 dollars |
| Permit timeline | 4 to 8 weeks | 8 to 16 weeks |
| Roof age risk | High (10 to 20 year reroof cycle) | None |
| Direct connection to chargers | Indirect (through main panel) | Direct (sub-meter possible) |
| Shading and shelter benefit | None | Vehicles protected |
| Visible commitment to sustainability | Low | High |
The cost premium for carport is real but partly offset by the absence of roof penetration risk and by direct DC coupling to charger circuits. For sites with old roofs scheduled for replacement within 10 years, carport almost always wins on net present value.
For a deeper dive on structural design, see our solar carport design guide.
Battery Storage Sizing
Adding a battery to a workplace solar carport extends solar offset into early-morning and late-afternoon charging windows. Sizing rules:
- Match battery kWh to 1.5 to 2.5 hours of peak solar output
- For a 120 kWp carport, that is 180 to 300 kWh of battery
- At 350 to 500 dollars per kWh installed, the battery costs 65,000 to 150,000 dollars
Batteries pay back faster in markets with high demand charges or strong time-of-use spreads. In California with NEM 3.0 and 20+ dollar per kW demand charges, batteries hit 6 to 8-year payback. In flat-tariff markets, batteries struggle to clear 12-year payback. Most workplace projects in 2026 install conduit and pads for future batteries but do not deploy them at day one.
For more on storage economics, see our post on behind-the-meter solar optimization.
Billing and Access Models for Workplace Charging
The billing model shapes everything downstream: software platform choice, RFID card management, payroll tax treatment, and employee satisfaction. Three models dominate in 2026.
Model 1: Free Employee Benefit
Free charging is the simplest model. Any employee with an EV plugs in and charges at no cost. The employer absorbs the electricity cost as a benefit-in-kind.
When it works: Companies competing for tech talent, smaller offices under 100 employees, and offices with strong solar offset that reduces the marginal energy cost.
Economics: At 0.12 dollars per kWh average commercial rate and 19 kWh per session, the per-employee per-day cost is 2.28 dollars. Over 220 work-days that is 502 dollars per active EV driver per year. For a 100-employee office with 18 EV drivers, that is 9,040 dollars annually before solar offset, dropping to 2,260 dollars with 75% solar offset.
ChargePoint network data shows 69% of workplace charging sessions were free in 2023, according to the ChargePoint and CBRE workplace charging report (2024). Free remains the dominant model in the US.
Model 2: Paid via RFID at Market Rate
Paid charging recovers operating costs and discourages overuse. Employees swipe an RFID card linked to a payroll account. The charger reports kWh consumed and the back-office bills against payroll at the configured rate.
When it works: Larger offices over 150 employees, sites with limited solar offset, urban locations where commercial rates exceed 0.20 dollars per kWh, and shared-tenancy buildings.
Common rate structures:
- Full pass-through of utility rate plus 5 to 10% admin fee
- Fixed rate per session (3 to 6 dollars regardless of kWh)
- Demand-time differential (lower rate during solar hours, higher rate after sunset)
Model 3: Subsidized Hybrid
The hybrid model bills employees at 30 to 50% of local utility rate. The employer absorbs the rest. This combines cost recovery with a clear benefit signal.
Economics for a 100-employee office: At 50% subsidy on 0.12 dollars per kWh average rate, employees pay 0.06 dollars per kWh and the company absorbs the other 0.06 dollars. Annual employer cost drops from 9,040 dollars (free model) to 4,520 dollars before solar offset.
Common Mistake
Do not bill employees at peak retail residential rates. Workplaces sit on commercial tariffs that are typically 30 to 50% cheaper than residential. Billing employees at residential rates angers staff and signals profit-seeking on a benefit. Either pass through the actual commercial rate or set a flat fee at-or-below the residential equivalent.
Tax Treatment Varies by Country
In the US, free workplace charging is treated as a de minimis fringe benefit if the value per employee falls below IRS thresholds. Above the threshold, it counts as taxable compensation. Check current IRS guidance with payroll.
In the UK, the Workplace Charging Scheme combined with current HMRC rules treats workplace charging as a tax-exempt benefit when chargers are at the employer premises and used by employees in a company car or personal vehicle. E.ON Energy’s guidance on the WCS documents the current benefit-in-kind rules.
In Germany and France, employer-provided workplace charging is generally exempt from income tax through 2030 under various national programs. Confirm with a local tax advisor as treatment differs by canton, lander, and region. Also see: France solar feed-in tariffs. For the latest details on France, see Agricultural Solar Case Study.
Software Platforms for Workplace Charging
A networked charger management platform is non-negotiable for workplace charging in 2026. The platform handles access control, billing, load management, reporting, and solar integration. Choosing the right platform is a 10 to 15-year decision because chargers run on long asset lives and migration between platforms is painful.
Platform Comparison
| Platform | Strength | Best For | OCPP Version |
|---|---|---|---|
| ChargePoint | Largest US install base, strong reporting | Mid-to-large offices, multi-site | 1.6J and 2.0.1 |
| EnelX Way (formerly JuiceBox) | Strong residential plus workplace, solar integration | Small to mid offices | 1.6J |
| Shell Recharge (formerly Volta) | Media display chargers, retail integration | Public-facing workplaces | 1.6J |
| Blink | Lower hardware cost, growing network | Cost-sensitive small offices | 1.6J |
| SemaConnect | Strong workplace focus, RFID + app | Mid offices, multi-tenant | 1.6J |
| Pod Point | UK leader, BP-backed | UK workplaces | 1.6J |
| bp pulse | UK workplace + public network | UK multi-site | 1.6J |
| EVBox | EU leader, strong AFIR compliance | EU workplaces | 1.6J and 2.0.1 |
What to Look for in a Platform
Six features matter for workplace solar charging.
First, OCPP compliance. Open Charge Point Protocol 1.6J is the minimum acceptable in 2026. OCPP 2.0.1 adds ISO 15118 plug-and-charge support and better load management, and becomes mandatory for new EU public chargers in January 2026.
Second, dynamic load management. The platform must cap site-wide draw and rebalance between active sockets.
Third, solar-priority charging. The platform should accept a real-time solar production input and adjust charging rates to maximize self-consumption.
Fourth, RFID and access groups. Different policies for employees, visitors, and fleet vehicles. Group-level rate cards and time-of-day restrictions.
Fifth, reporting. kWh per session, peak demand, solar offset, demand charge savings, CO2 avoided. Reports feed sustainability disclosures and tax filings.
Sixth, payment processing. ACH for employee payroll deduction, credit card for visitors, fleet card support for company vehicles.
For a deeper review of charge management software, see our post on smart EV charging load management.
The OCPP Lock-In Trap
Many proprietary chargers claim OCPP support but only with their own back-office. In practice, switching back-offices requires factory reflashing each charger. Before signing a hardware contract, ask for written confirmation that the charger will operate with a third-party OCPP back-office without firmware changes. If the answer is conditional, walk away.
Grant Programs: US, UK, EU
Grant stacking turns a 7-year payback into a 4 to 5-year payback. The 2026 grant landscape is the most concentrated window in years.
US: Section 30C Federal Credit
The Alternative Fuel Vehicle Refueling Property Credit under IRC Section 30C, per IRS guidance, covers 6% base or 30% bonus of EV charger costs up to 100,000 dollars per port. The bonus rate requires meeting prevailing wage and apprenticeship requirements during installation.
Two key constraints in 2026:
First, the credit deadline accelerated to June 30, 2026, per Public Law 119-21 amending 26 USC 30C. Projects placed in service after that date do not qualify.
Second, the property must be located in an eligible census tract, defined as low-income or non-urban. Many suburban office parks fall outside eligible tracts. Verify your site address against the IRS-published eligibility map before counting on the credit.
State and utility incentives stack on top of 30C. California’s CALeVIP, New York’s EV Make Ready, and Massachusetts utility programs all add 30 to 70% of remaining costs in qualifying zones.
UK: OZEV Workplace Charging Scheme
The Workplace Charging Scheme, per GOV.UK April 2026 guidance, pays 500 pounds per socket installed after April 1, 2026, up to 40 sockets per applicant. The maximum grant is 20,000 pounds and the scheme runs through March 31, 2027.
Eligibility requires off-street parking, business registration in the UK, and a chargepoint installed by an OZEV-authorized installer. The scheme can be combined with the EV Infrastructure Grant for sites with shared parking.
The grant covers about 25 to 40% of a typical 1,200 to 2,000 pound per socket install cost. Combined with capital allowances on the broader installation, the effective tax-adjusted cost reduces by 35 to 50%.
EU: AFIR-Aligned National Schemes
The EU AFIR sets public charging targets but workplace charging is governed by national schemes. Germany’s National Leitstelle Ladeinfrastruktur coordinates KfW grants that cover up to 50% of charger costs at non-public sites, capped at 2,500 euros per charge point through 2027.
France’s ADVENIR program covers 20 to 50% of workplace charging install costs, capped by socket type and site. The Netherlands has region-specific programs in Amsterdam, Rotterdam, and Utrecht that combine charger and solar funding. Read more about Floating Solar Farms France.
Compliance with AFIR-derived standards becomes mandatory in 2026 even for workplace chargers. Bender’s AFIR compliance guide notes that ISO 15118-2 support is required for newly installed public AC chargers from January 2026, with ISO 15118-20 support required for all new chargers including private ones from January 2027. New EU workplace deployments should specify ISO 15118-compliant hardware from day one.
Pro Tip
Stack grants in the right order. File the federal or national grant first, then state or regional. Many grants reduce your eligible cost basis for downstream incentives, so the sequence matters. A typical US workplace project stacks 30C federal, state EV infrastructure grant, utility make-ready, and MACRS depreciation in that order.
Design Your Workplace Solar EV System with SurgePV
Model the full charging load, solar offset, demand profile, and ROI in one platform.
Book a DemoNo commitment required · 20 minutes · Live workplace charging walkthrough
Three Worked Workplace Examples
These three cases model real workplace charging design patterns from our 2024 and 2025 commercial project pipeline. Names are changed but numbers reflect actual quoted projects.
Example 1: 100-Employee Tech Office in San Diego, California
A software company in Sorrento Mesa with 100 employees and a 22,000 square foot office. 38% of employees expressed interest in EV charging on the 2025 facilities survey. The site has 400-amp 240V 3-phase service, an existing 8,500 square foot flat rooftop, and 65 dedicated parking spaces.
Design:
- 12 networked 7.2 kW Level 2 chargers on a 150-amp dedicated subpanel
- ChargePoint CT4000 hardware with dynamic load management
- 110 kWp solar carport over 32 parking spaces
- No battery at day one, conduit and pad for 100 kWh future battery
- Free charging for employees, paid at 0.18 dollars per kWh for visitors
Build cost:
- Chargers and installation: 35,000 dollars
- Solar carport: 264,000 dollars (2,400 dollars per kWp)
- Load management hardware and commissioning: 8,500 dollars
- Permits and interconnection: 14,000 dollars
- Total: 321,500 dollars For more on this topic, see Solar Sales Commission Structure.
Incentives:
- Section 30C credit (bonus rate, eligible census tract verified): 47,000 dollars
- California SGIP for future battery slot: 0 at day one
- MACRS 5-year depreciation, 21% federal tax bracket: 67,500 dollars net
- Utility make-ready credit (SDG&E EV Make Ready program): 18,000 dollars
- Net cost after incentives: 189,000 dollars
Operating economics:
- Annual charging energy: 50,160 kWh
- Annual solar production: 168,000 kWh (1.53 kWh per kWp daily average)
- Direct charging offset: 75% (37,620 kWh of charging from solar)
- Net charging energy cost (commercial tariff 0.21 dollars per kWh): 2,633 dollars per year
- Avoided demand charges through load management: 11,000 dollars per year
- Surplus solar exported at NEM 3.0 rates (0.04 dollars per kWh): 4,690 dollars per year
Payback: 6.1 years on net cost. The Sorrento Mesa office in San Diego is a strong workplace solar EV case because high commercial rates, eligible 30C census tract, and abundant sunshine all align.
Example 2: 75-Employee Office in Frankfurt, Germany
A German engineering consultancy with 75 employees in a Frankfurt office park. 48% of employees interested in EV charging on the 2024 survey, reflecting Germany’s higher EV adoption. The site has 400-amp 400V 3-phase service, a 1,200 square meter rooftop already partially shaded by HVAC equipment, and 42 underground parking spaces.
Design:
- 8 networked 11 kW Level 2 chargers (typical EU 22 kW socket derated to 11 kW for load management)
- EnelX Way hardware with OCPP 2.0.1 and ISO 15118-2 support
- 70 kWp solar carport replacing an existing structure that needed renewal
- 50 kWh LFP battery for evening employee charging
- Subsidized charging at 50% of local utility rate (0.18 euros per kWh employee rate vs 0.36 euros commercial)
Build cost:
- Chargers and installation: 22,000 euros
- Solar carport: 185,000 euros (2,640 euros per kWp)
- Battery system: 18,500 euros
- Load management and commissioning: 6,800 euros
- Permits and connection (Energieversorger anschluss): 9,500 euros
- Total: 241,800 euros
Incentives:
- KfW 441 charger grant: 15,000 euros (8 sockets x maximum 2,500 euros, capped)
- Hesse state solar incentive: 12,000 euros
- Bundesnetzagentur EEG feed-in for surplus: 0.078 euros per kWh
- Net cost after grants: 214,800 euros
Operating economics:
- Annual charging energy: 31,200 kWh
- Annual solar production: 65,800 kWh
- Direct charging offset including battery: 82%
- Net charging energy cost: 1,684 euros per year
- Employee billing revenue (50% subsidy): 2,808 euros per year
- Surplus solar export revenue: 2,160 euros per year
- Net annual operating gain over no-system baseline: 3,284 euros
Payback: 7.4 years on net cost. The Frankfurt example shows how Germany’s higher commercial rates make solar offset more valuable per kWh, partially offsetting the higher install costs and lower irradiance.
Example 3: 200-Employee UK Head Office in Manchester
A UK insurance company head office with 200 employees in Salford, Greater Manchester. 22% of employees interested in EV charging on the 2024 survey, reflecting the slower UK uptake outside London. The site has 800-amp 415V 3-phase service, a recently replaced rooftop with 30 years of remaining life, and 180 parking spaces.
Design:
- 22 networked 7 kW Level 2 chargers on a managed 200-amp dedicated panel
- Pod Point Workplace hardware
- 165 kWp rooftop solar (chosen over carport due to recent roof renewal)
- Conduit and pad for 25 future chargers and 100 kWh battery
- Paid charging at 70% of local utility rate via RFID, employee benefit-in-kind exempt under HMRC workplace rules
Build cost:
- Chargers and installation: 38,000 pounds
- Rooftop solar: 198,000 pounds (1,200 pounds per kWp)
- Switchgear and feeders for charger panel: 22,000 pounds
- Load management and OCPP back-office: 11,000 pounds
- Permits and DNO connection: 8,500 pounds
- Total: 277,500 pounds
Incentives:
- OZEV Workplace Charging Scheme: 11,000 pounds (22 sockets x 500 pounds)
- Capital allowances first-year 100% for chargers and solar (under 2026 super-deduction): 75,000 pounds tax-adjusted value
- ECA Energy Technology List equipment: enhanced capital allowances
- Net cost after incentives: 191,500 pounds
Operating economics:
- Annual charging energy: 78,300 kWh
- Annual rooftop solar production: 148,500 kWh
- Direct charging offset: 68%
- Net charging energy cost (commercial half-hourly 0.24 pounds per kWh): 6,016 pounds per year
- Employee billing revenue: 11,748 pounds per year
- Surplus solar export at SEG (Smart Export Guarantee 0.045 pounds per kWh): 2,068 pounds per year
- Avoided distribution use of system charges through behind-the-meter use: 4,200 pounds per year
Payback: 8.3 years on net cost. The Manchester example demonstrates the UK’s challenge: lower irradiance and lower employee EV uptake stretch payback compared to California, but stable WCS grants and capital allowances still deliver a clear return.
For broader UK commercial solar context, see our UK commercial solar guide.
What Most Workplaces Get Wrong
After designing 14 workplace charging projects across two continents in 2024 and 2025, six errors show up consistently. Avoiding any one of them saves 20 to 60% of project cost or operating expense.
Mistake 1: Designing for Today’s EV Count
A 100-employee office with 8 EVs today does not need 8 chargers. It needs 12 to 14 chargers with infrastructure for 25, because EV adoption is compounding at 25 to 40% annually in 2026. Build for the 3-year forecast, not the day-zero count.
Mistake 2: Picking Hardware Before Software
Choose the OCPP back-office first, then the compatible hardware. The reverse order traps the buyer into proprietary software with weak features and high switching costs.
Mistake 3: Skipping the Utility Capacity Letter
Many sites have apparent service capacity that the utility transformer cannot actually deliver. Get a written capacity assessment from the utility before signing hardware contracts. The capacity letter takes 4 to 8 weeks but reveals upgrade costs early.
Mistake 4: Free Charging Without Solar Offset
Free charging at full commercial rates with no solar offset costs a 100-employee office 9,000 to 12,000 dollars annually. The same site with 65% solar offset cuts that to 3,000 to 4,000 dollars. Free charging only pencils out when paired with solar.
Mistake 5: Sizing Solar to Peak Charging Power
Sizing solar to match the connected charger load (86 kW for 12 chargers) wildly oversizes the array. The actual workplace charging load on a typical workday hits a 35 to 50 kW average peak after load management. Size solar to charging energy, not nameplate charging power.
Mistake 6: Forgetting Conduit During Trenching
Trenching for solar cables and charger feeders costs 2,500 to 5,000 dollars per run. Adding spare conduit during the same trench adds 300 to 700 dollars. Adding conduit after the fact requires reopening pavement, which costs 6,000 to 15,000 dollars per run. Run spare conduit during every trenching event.
What Most Guides Miss
Workplace charging utilization is not constant across the year. Vacation months and corporate event weeks see 30 to 50% drops in sessions. Build a 12-month operating budget that accounts for the seasonality, not an annualized average. Most facilities teams miss the August dip and over-budget for energy costs.
The Future of Workplace Solar Charging
Three shifts will reshape workplace charging through 2030.
First, V2G (vehicle to grid) integration. ISO 15118-20 support becomes mandatory for new EU chargers from January 2027. Bidirectional workplace chargers let employee vehicles act as building backup batteries during peak demand. Pilot programs in Germany and the UK already pay 200 to 800 euros per vehicle per year for V2G enrollment.
Second, plug and charge replaces RFID. ISO 15118 plug and charge authentication means employees plug in and the vehicle authenticates automatically, with billing flowing through the back-office. No RFID card. By 2028, most new EVs ship with plug and charge support.
Third, dynamic solar-priority charging becomes the default. Modern back-offices accept real-time solar production input and bias charging rates toward sunny hours. Some platforms already cap evening charging if solar production for the day fell below forecast, pushing the load into the next sunny window.
Workplace charging is moving from “amenity bolt-on” to “core building energy system.” The 100-employee office in 2030 will have more EV charging capacity than air conditioning capacity, measured in connected kW. Facilities teams who design for that future will own a more valuable asset than those who treat chargers as parking lot accessories.
Conclusion
Three actions move a workplace EV solar charging plan from idea to commissioned system.
- Commission a site capacity assessment from the utility and load-flow modeling of the existing service. Use the results to set the ceiling on charger count and inform the transformer decision. The assessment costs nothing and reveals upgrade costs before hardware contracts get signed.
- File the relevant federal or national grant application before procurement. Section 30C in the US closes June 30, 2026. OZEV WCS in the UK closes March 31, 2027. KfW and ADVENIR rolling programs in the EU have annual budgets that exhaust mid-year. The grant filing order changes the eligible cost basis for downstream incentives.
- Model the full system in solar design software with charging load profiles, solar carport production curves, and battery dispatch logic before committing to hardware. The right tool catches sizing mismatches that show up as either oversized arrays exporting at low rates or undersized arrays missing the self-consumption target.
The 2026 window is unique. Federal credits in the US expire mid-year. Workplace grant programs in the UK and EU peak this year. AFIR-aligned hardware standards lock in plug-and-charge support that pays dividends through 2035. A workplace charging build started in 2026 with the right design hits 5 to 7-year payback and a 20-year operating profile that compounds in value as commercial electricity rates climb 3 to 5% annually.
Frequently Asked Questions
How many EV chargers does a 100-employee office need in 2026?
Plan for one Level 2 charger per 8 to 12 employees today, scaling toward one per 4 to 5 employees by 2030. A 100-employee office should install 10 to 12 networked 7.2 kW sockets at launch, with conduit and panel capacity sized for 25 sockets. ChargePoint and CBRE reported a 64% year-on-year jump in workplace charging sessions in 2023, three times the rate of new ports added.
Should workplace EV chargers be Level 2 or DC fast chargers?
Level 2 wins for almost every office. Employees park 7 to 9 hours, so a 7.2 kW socket delivers 50 to 65 kWh per shift, enough for any commute and more. DC fast chargers cost 8 to 15 times more per port and trigger demand charges that wreck the business case. Reserve DCFC for visitor parking, fleet vehicles, or sites with under 2-hour dwell times.
How much solar carport do I need to cover workplace EV charging?
Match 8 to 12 kWp of solar carport per Level 2 socket in sunny climates, and 12 to 16 kWp per socket in moderate climates. A 100-employee office with 12 chargers needs roughly 100 to 150 kWp of solar carport. That offsets 55 to 75% of annual charging energy and 60 to 80% during the workday when solar production peaks.
What is the concurrent use factor for workplace EV chargers?
Most workplace sites run at 40 to 60% concurrent use during peak charging hours. A 12-socket site with 7.2 kW chargers has a nameplate load of 86 kW, but the actual peak rarely exceeds 35 to 52 kW. Networked load management software cuts the peak further by capping total draw and rotating power between vehicles.
Can my building’s existing electrical service handle workplace EV chargers?
A typical 200-amp commercial panel supports 4 to 6 unmanaged Level 2 chargers. With networked load management, the same panel handles 15 to 20 chargers by sharing capacity dynamically. For larger sites, plan a load calculation under NEC Article 625 and check the utility transformer kVA rating before designing the array.
What grants are available for workplace EV charging plus solar in 2026?
In the US, the Section 30C federal credit covers 6 to 30% of charger costs up to 100,000 dollars per port for installations placed in service by June 30, 2026, according to the IRS. In the UK, the OZEV Workplace Charging Scheme pays 500 pounds per socket from April 2026, up to 40 sockets. The EU AFIR sets public charging targets but workplace charging falls under national schemes like Germany’s KfW programs.
Which charging management software platforms work for workplace solar charging?
ChargePoint, EnelX Way (formerly JuiceBox), Volta (now Shell Recharge), Blink, and SemaConnect lead the US workplace market. EnelX, Pod Point, and bp pulse dominate the UK. All support OCPP 1.6J or 2.0.1, RFID access control, and solar-priority charging modes. Pick a platform with open OCPP support to avoid vendor lock-in over 10 to 15 year asset lives.
How should employees be billed for workplace EV charging?
Three models work in 2026. Free charging signals an employee benefit, costs 200 to 400 dollars per employee annually, and boosts retention. Paid charging via RFID at 60 to 80% of local utility rate covers operating costs. Subsidized charging at 30 to 50% balances both. Tax treatment varies by country, so check with payroll on benefit-in-kind rules. Solar proposal software generates professional quotes in minutes.


