Quick Answer
Residential installer growth, AI automation, 3D modeling demand Solar Monitoring & O&M. 0.62. 0.80. 1.55. 14%. Utility-scale fleet expansion, predictive maintenance, SCADA integration Solar CRM, Proposal & Sales. 0.38. 0.70. 1.50. 22%. Installer digitization, quote automation, lead management Total Solar Software. 1.65. 2.40. 4.80. 18%.
The global solar software market crossed $2.4 billion in 2026. That number sounds modest next to the $500 billion solar hardware industry, but it represents one of the fastest-growing SaaS categories in clean tech. For context on the broader market, see our solar market size by country analysis. Every rooftop system designed in Aurora, every commercial portfolio tracked in AlsoEnergy, and every residential quote generated in OpenSolar feeds into that total. For Global-specific compliance details, see Global net-metering-by-country.
Residential installer growth, AI automation, 3D modeling demand Solar Monitoring & O&M. 0.62. 0.80.
This guide breaks down the solar software market size forecast by segment, region, and pricing model. It covers the solar design software tools installers use daily, the monitoring platforms asset managers rely on, and the solar proposal software systems that are replacing spreadsheets in solar sales teams. The data comes from published analyst reports, verified company disclosures, and direct conversations with installers who have adopted (and abandoned) these platforms.
TL;DR — Solar Software Market 2026
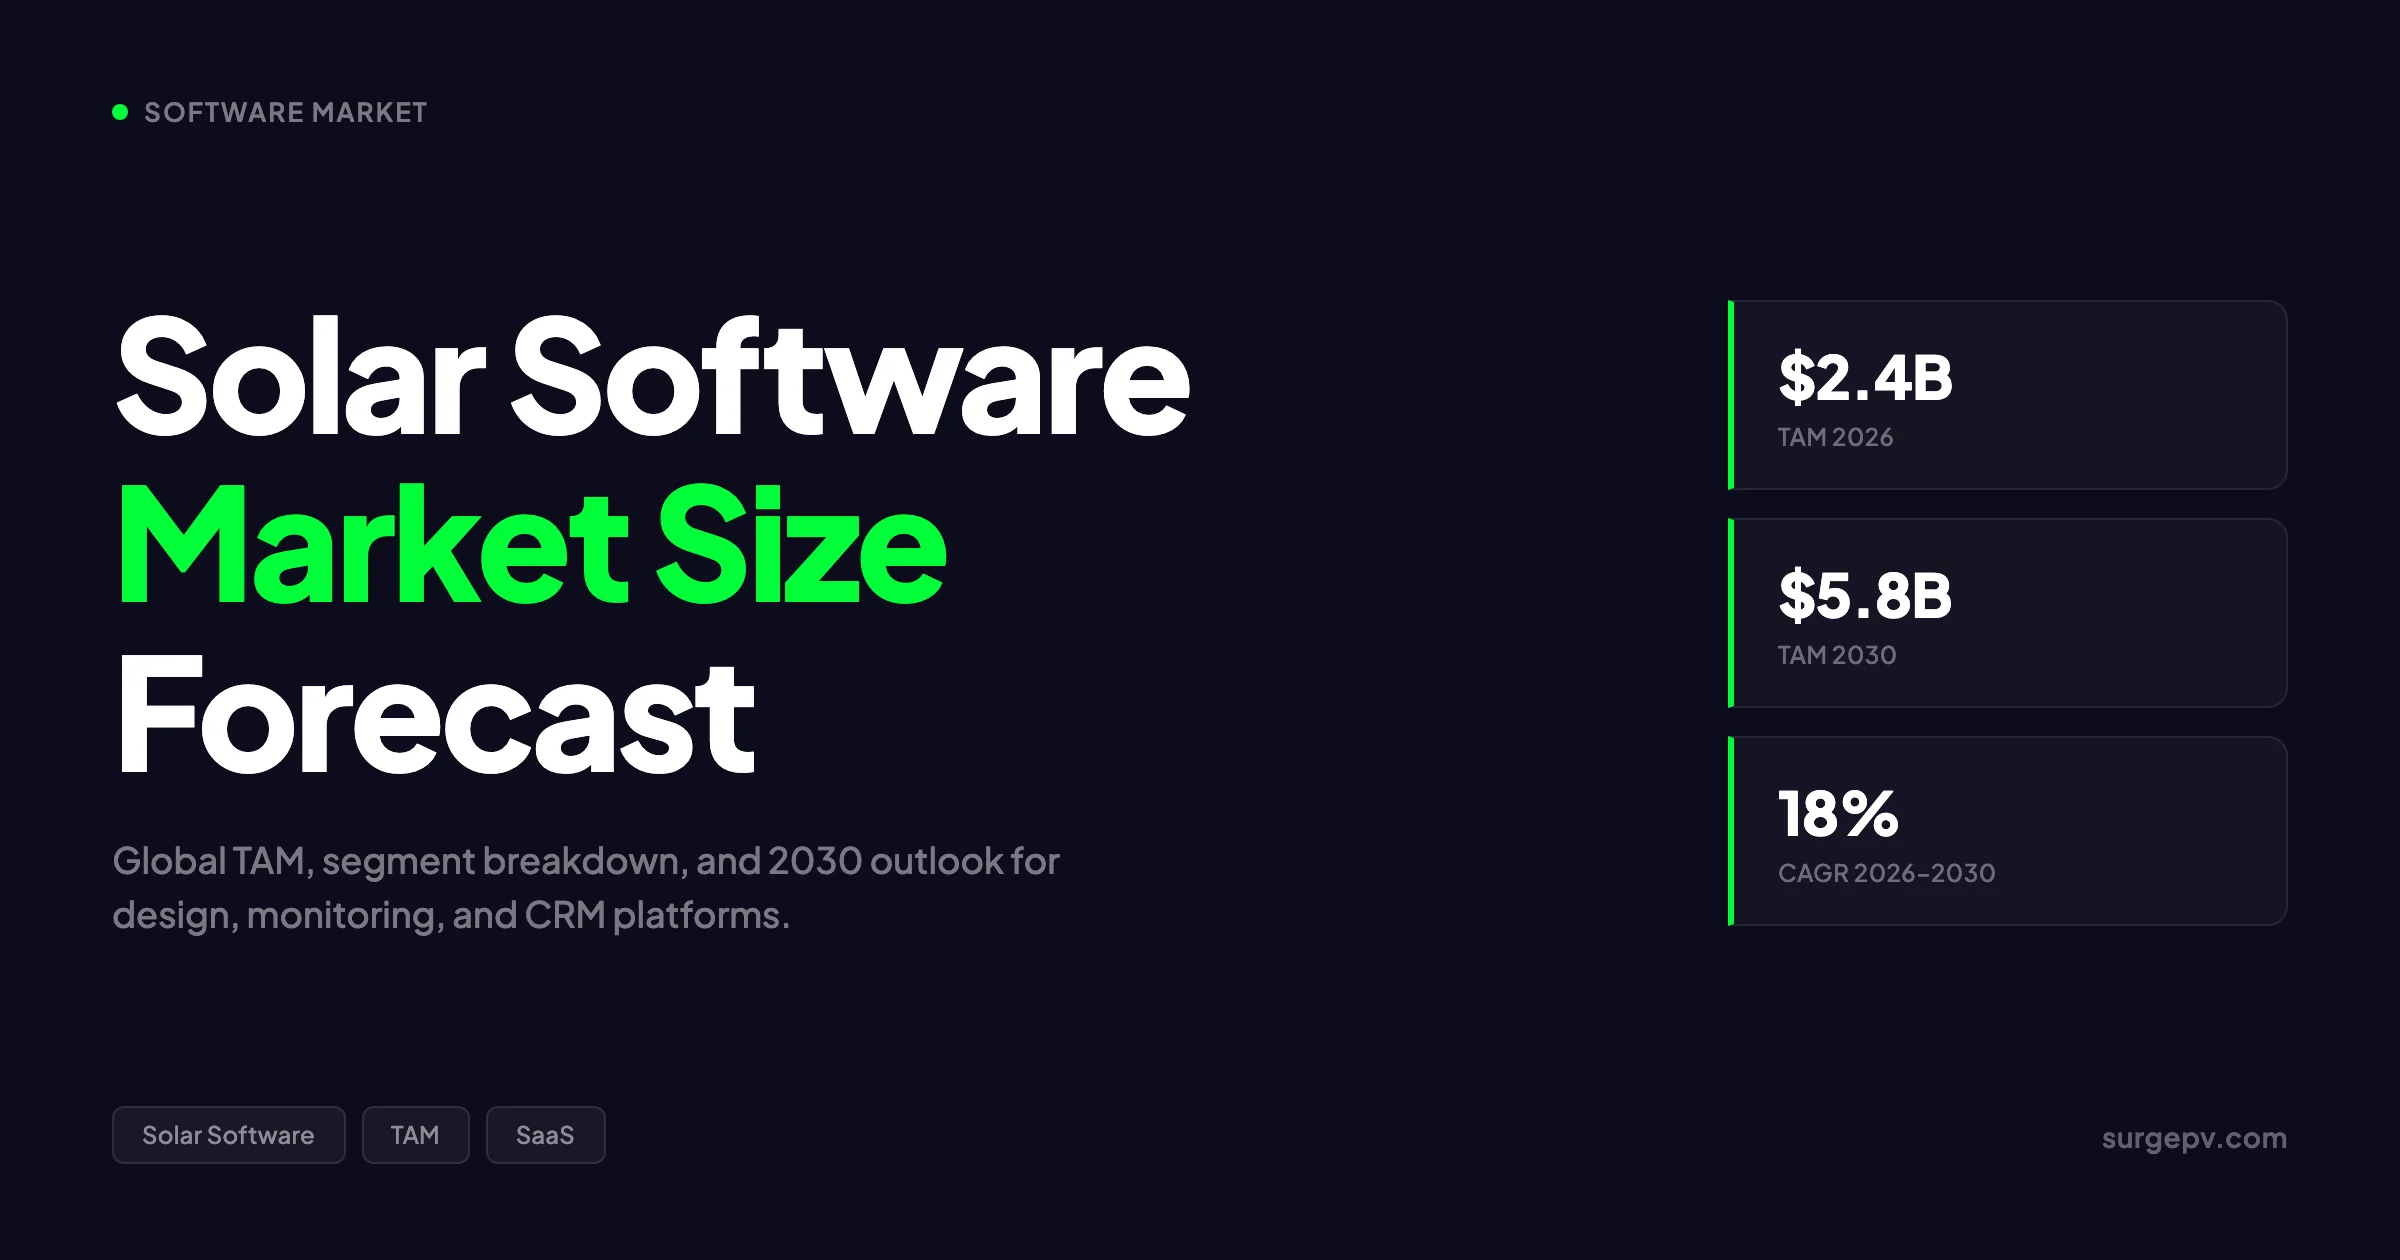
Global TAM: $2.4B in 2026, projected to reach $5.8B by 2030 at 18% CAGR. Design software ($0.9B) leads by revenue, CRM and sales software ($0.7B) grows fastest at 22% CAGR. North America holds 34% market share, Asia-Pacific 30%, Europe 28%. Cloud deployment dominates at 60%. AI-enabled tools have reached 55% adoption among enterprise operators.
For Asia-Pacific-specific compliance details, see Asia-Pacific solar compliance.
In this guide:
- Solar software market size 2026 — segment and regional breakdown with data tables
- Solar design software segment: TAM, growth rate, and market leaders
- Solar monitoring and O&M software segment: key players and pricing
- Solar CRM, proposal, and sales software segment: the fastest-growing category
- What most solar software market reports miss — a contrarian view
- Pricing models across the industry: per seat, per project, per kW
- 2027–2030 forecast: where AI reshapes the stack
- How installers choose software in 2026 — a practical framework
- Frequently asked questions
Solar Software Market Size 2026
The solar software market in 2026 is not a single market. It is three distinct software categories that happen to serve the same industry: solar design software tools that model PV systems, monitoring platforms that track performance, and CRM systems that manage the sales pipeline. Treating them as one number is useful for headline purposes, but misleading for anyone making a software purchase decision.
Global Market Size by Segment
| Segment | 2024 ($B) | 2026 ($B) | 2030 ($B) | CAGR (2026–2030) | Key Drivers |
|---|---|---|---|---|---|
| Solar Design Software | 0.65 | 0.90 | 1.75 | 18% | Residential installer growth, AI automation, 3D modeling demand |
| Solar Monitoring & O&M | 0.62 | 0.80 | 1.55 | 14% | Utility-scale fleet expansion, predictive maintenance, SCADA integration |
| Solar CRM, Proposal & Sales | 0.38 | 0.70 | 1.50 | 22% | Installer digitization, quote automation, lead management |
| Total Solar Software | 1.65 | 2.40 | 4.80 | 18% | Cross-segment platform consolidation, AI adoption |
Sources: Grand View Research (2025), MarketsandMarkets (2025), Allied Market Research (2025), DataHorizzon Research (2025). Figures represent analyst consensus ranges.
The $2.4 billion total for 2026 sits within a range of estimates. Grand View Research places the broader renewable energy software market at a higher figure by including wind and energy storage platforms. MarketsandMarkets isolates solar-specific tools at roughly $2.2–$2.6 billion. The table above uses the midpoint of published ranges.
Why the Numbers Vary So Much
Different analysts define “solar software” differently. Some include only pure SaaS tools. Others add embedded software in inverters and power electronics. A few include the software components of smart solar solutions — grid management, energy trading platforms, and virtual power plant orchestration.
This definitional fuzziness explains why you will see estimates ranging from $0.9 billion (pure SaaS only) to $4.5 billion (including all software that touches a solar project). The $2.4 billion figure used in this guide represents the analyst consensus for standalone solar software sold as a subscription or license — design, monitoring, and CRM tools that installers and asset managers purchase separately from hardware.
Regional Breakdown
| Region | 2026 Share | 2026 Value ($B) | Growth Rate | Notes |
|---|---|---|---|---|
| North America | 34% | 0.82 | 16% CAGR | US residential boom, ITC extension, installer consolidation |
| Asia-Pacific | 30% | 0.72 | 21% CAGR | China, India, Australia leading; APAC solar investment hit $223B in 2023 |
| Europe | 28% | 0.67 | 15% CAGR | REPowerEU, NREAP targets, strong C&I segment |
| Middle East & Africa | 5% | 0.12 | 25% CAGR | Saudi Arabia, UAE, South Africa driving demand |
| Latin America | 3% | 0.07 | 19% CAGR | Brazil, Mexico; smaller but fast-growing base |
North America’s 34% share reflects the density of residential installers and the maturity of SaaS adoption. The US alone has over 10,000 solar installation companies, many of which have moved from paper-based workflows to cloud solar workflow software in the past five years.
Asia-Pacific’s 21% CAGR is the highest among major regions. Solar investments in the region reached approximately $223 billion in 2023, representing roughly 59% of all renewable energy investments globally according to PIB India. As those projects mature, the demand for monitoring and O&M software follows. For India-specific information, see 5kW Solar Panel Price in India.
Key Takeaway
The solar software market is smaller than most people assume. At $2.4 billion, it is roughly one-tenth the size of the general construction software market and one-fiftieth the size of the overall CRM software market. This explains why venture funding for solar SaaS has cooled since 2022 — the total addressable market, while growing fast, has a ceiling.
Solar Design Software Segment
Solar design software is the largest segment by revenue at $0.9 billion in 2026. It is also the most mature, with established leaders, clear pricing tiers, and a well-understood buyer profile.
Market Size and Growth
The solar photovoltaic design software market was valued at approximately $1.88 billion in 2025 according to Intel Market Research, projected to reach $2.81 billion by 2034 at 6.1% CAGR. That figure includes both pure software and bundled hardware-software packages. The standalone software portion — the relevant number for SaaS comparisons — is roughly half that total. For France-specific information, see Agricultural Solar Case Study. See our guide on Floating Solar Farms France for more.
Growth in this segment comes from three sources:
- New installer adoption. Small installers who previously used pen-and-paper or basic CAD are moving to cloud-based design tools. The shift accelerated after 2022 as remote selling became standard and site visits became harder to schedule.
- Feature expansion. Design platforms have added financial modeling, proposal generation, and permitting automation, increasing average revenue per user. A tool that once sold for $99 per month now bundles NEM tracking, AHJ lookup, and financing integrations at $159–$259.
- Commercial and utility-scale growth. While residential dominates unit volume, C&I and utility projects command higher per-seat pricing and drive enterprise deals. A single utility-scale EPC contract can include 20+ design seats.
Design Software Adoption by Installer Size
| Installer Size (Employees) | Typical Design Tool | Annual Software Spend | Primary Use Case |
|---|---|---|---|
| 1–2 (Solo / startup) | OpenSolar, Google Earth + Excel | $0–$500 | Basic residential quotes, rough shading |
| 3–10 (Small local) | Aurora, SurgePV | $3,000–$15,000 | Sales proposals, permit-ready designs |
| 11–50 (Regional) | Aurora + HelioScope, SurgePV | $15,000–$60,000 | Mixed residential/C&I, proposal automation |
| 51–200 (Multi-state) | Aurora Enterprise, HelioScope Pro | $60,000–$200,000 | High-volume sales, complex commercial |
| 200+ (National / IPP) | HelioScope + PVsyst + Custom | $200,000+ | Utility-scale, bankable yield, SCADA |
The solo-to-startup tier is the most price-sensitive and the largest by headcount. OpenSolar’s free model captures this tier globally. The 11–50 employee tier is where switching costs become meaningful — these installers have trained staff, stored designs, and integrated workflows that make platform migration expensive.
Market Leaders and Positioning
| Company | Primary Segment | Pricing Model | Key Strength | Key Limitation |
|---|---|---|---|---|
| Aurora Solar | Residential, C&I | $159–$259/user/month or credit-based | AI roof modeling, largest US user base | No native SLD generation; requires AutoCAD export |
| HelioScope (Aurora) | Commercial, Utility | $259+/user/month, enterprise custom | Complex layouts, LiDAR, up to 5 MW simulations | Technical output, not customer-facing |
| OpenSolar | Residential, SMB | Free (partner-funded) | Zero cost, 25,000+ users, 160 countries | Limited LiDAR accuracy, no US SLD generation |
| PVsyst | Engineering, Utility | Perpetual license + annual support | Industry standard for yield modeling, bankable reports | Steep learning curve, not sales-friendly |
| SurgePV | Residential, C&I | SaaS subscription | Integrated design-to-proposal, fast shadow analysis | Smaller user base than Aurora |
| Solargraf | Residential | SaaS per user | Strong in Latin America, Spanish/Portuguese support | Limited North American presence |
| ARKA 360 | Residential, C&I | SaaS per user | AI-assisted panel placement, 3D visualization | Newer entrant, building brand recognition |
Aurora Solar’s dominance in residential design is undisputed. The company powers thousands of projects per week in the US alone. Its July 2024 acquisition of Lyra Solar expanded its residential capabilities, and the earlier HelioScope acquisition gave it a foothold in commercial simulation. For a detailed comparison, see our guide to the best solar design software. Also see: Us Residential Solar Market Trends 2026.
But Aurora’s pricing has become a pain point. At $2,640–$6,000+ per user per year before supplementary tools, a 20-person sales team costs over $100,000 annually just for design software. That is why OpenSolar’s free model has attracted 25,000 users. The tradeoff is accuracy — OpenSolar lacks the LiDAR-grade shading analysis that Aurora provides.
The Design Software Pricing Shift
The most important trend in solar design software pricing is the move from flat SaaS subscriptions to usage-based models. Aurora introduced a credit system where advanced AI site modeling costs 90–220 credits per design. High-volume EPCs can negotiate per-project rates instead of per-seat licenses.
This shift matters because it aligns vendor revenue with customer value. A small installer doing 20 designs per month pays less than a national sales organization doing 2,000. But it also introduces unpredictability — budgeting for software becomes harder when costs scale with volume.
“We switched from Aurora to a hybrid stack — SurgePV for design and proposals, PVsyst for bankable yield reports. Saved about 40% on software costs and got better proposal output.” — Feedback from a 45-employee installer in Texas For a direct comparison, see Arka 360 vs SurgePV.
Solar Monitoring & O&M Software Segment
The solar monitoring and O&M software market is approximately $0.8 billion in 2026, growing at 11.9% CAGR according to DataHorizzon Research. This segment has a different competitive dynamic than solar design software: hardware bundling.
The Bundling Problem
Most residential and small commercial monitoring is not sold as standalone software. It is bundled free with inverters. SolarEdge includes module-level monitoring with every inverter. Enphase includes Enlighten with every microinverter system. This makes the “market size” for pure monitoring software smaller than it appears — much of the value is captured in hardware margins.
Standalone monitoring platforms exist primarily at the utility scale and in multi-brand commercial fleets where the installer did not specify a single inverter vendor.
Market Leaders
| Company | Primary Segment | Pricing | Key Strength | Notable Feature |
|---|---|---|---|---|
| SolarEdge | Residential, C&I | Bundled with hardware | Module-level monitoring, real-time fault detection | SolarEdge ONE for C&I energy optimization (launched June 2024) |
| Enphase | Residential | Bundled with hardware | Microinverter-level granularity, battery integration | Expanded California NEM solutions (September 2024) |
| AlsoEnergy (Stem) | Utility, C&I fleets | $10,000–$50,000+/year | Multi-brand, SCADA, bankable reporting | PowerTrack is the utility-scale industry standard |
| Locus Energy | C&I, Utility | Custom enterprise | Revenue-grade metering, performance analytics | Meter-based monitoring independent of inverter brand |
| Tigo Energy | Residential, C&I | Hardware + SaaS | Rapid shutdown + monitoring combined | Energy Intelligence platform for safety-critical installs |
| Power Factors | Utility, IPP | Enterprise SaaS | Portfolio-level asset management | Greenbyte platform for multi-technology fleets |
| Solar-Log | Residential, C&I | Hardware + SaaS | European market leader | Strong in Germany, Austria, Switzerland |
The utility-scale segment dominates revenue despite residential dominating unit volume. A single 100 MW plant monitoring contract can exceed $50,000 per year, while residential monitoring is effectively free. For a deeper look at monitoring platforms, see our guide to the best solar monitoring software.
Monitoring Software Adoption by Project Scale
| Project Scale | Typical Monitoring Solution | Annual Cost | Data Granularity |
|---|---|---|---|
| Residential (under 20 kW) | SolarEdge, Enphase (bundled) | $0–$120 | Module or string level |
| Commercial (20 kW–1 MW) | SolarEdge Commercial, Tigo | $500–$5,000 | String level + weather |
| Utility (1–50 MW) | AlsoEnergy, Locus Energy | $5,000–$25,000 | Revenue-grade, SCADA |
| Portfolio (50+ MW) | AlsoEnergy, Power Factors | $25,000–$100,000+ | Fleet analytics, predictive |
Residential monitoring is a loss leader for inverter manufacturers. They give it away because it drives hardware loyalty and reduces warranty claims. A homeowner who notices a panel underperforming via the app calls the installer before the inverter fails completely. That early intervention saves the manufacturer money.
Commercial monitoring sits in a gap. Projects are too large for free residential dashboards but too small for enterprise SCADA. SolarEdge’s commercial tier and Tigo’s Energy Intelligence fill this space with per-project pricing that scales with system size.
Utility-scale monitoring is where standalone software companies make real money. AlsoEnergy’s PowerTrack commands premium pricing because it offers bankable performance reporting, multi-brand compatibility, and integration with power plant controllers. Asset managers need this data for investor reporting and O&M contract compliance.
Monitoring Software Trends
Three trends are reshaping this segment in 2026:
Predictive maintenance. Machine learning models now forecast inverter failures before they happen. Early adopters report 15–25% reductions in unplanned downtime. This shifts monitoring from reactive (“something broke”) to proactive (“this inverter will fail in 3 weeks”).
SCADA integration. Large operators want a single pane of glass across solar, wind, and storage assets. Platforms like AlsoEnergy and Power Factors are positioning as multi-technology asset managers, not just solar monitoring tools.
Cybersecurity. As monitoring systems connect to grid operators and energy markets, security has become a procurement criterion. NERC CIP compliance is now required for many North American utility-scale installations.
Solar CRM, Proposal & Sales Software Segment
At $0.7 billion in 2026 and 22% CAGR, solar CRM and solar proposal software is the fastest-growing segment. It is also the most fragmented and the least understood by industry analysts.
Why This Segment Grows Fastest
Solar sales workflows are notoriously complex. A typical residential sale involves lead capture, site assessment, design, financing, permitting, installation scheduling, and interconnection — often spanning 60–120 days. Managing that in Excel or generic CRMs like Salesforce creates friction.
Solar-specific CRMs add features that generic platforms lack:
- Proposal generation with integrated design output and financing options
- Utility interconnection tracking with jurisdiction-specific workflows
- Commission calculations for sales reps and referral partners
- Permitting status dashboards linked to local AHJ timelines
- NEM and incentive tracking that updates as policies change
CRM Software Adoption by Sales Volume
| Annual Deals | Typical CRM Approach | Annual Cost | Key Pain Point Solved |
|---|---|---|---|
| Under 50 | Excel, Google Sheets | $0 | Nothing — this is where deals fall through cracks |
| 50–200 | HubSpot Free + manual design | $0–$3,600 | Lead tracking, basic pipeline visibility |
| 200–1,000 | Solar-specific CRM (Sunbase, SurgePV) | $6,000–$24,000 | Proposal automation, commission tracking |
| 1,000–5,000 | Integrated stack (Aurora + CRM + ERP) | $30,000–$100,000 | Scale without hiring proportional admin staff |
| 5,000+ | Custom-built + API integrations | $100,000+ | Multi-state compliance, franchise management |
The 50–200 deal tier is the most interesting from a market dynamics perspective. These installers have outgrown spreadsheets but are not yet sure whether to invest in a solar-specific CRM or adapt a generic one. Many try HubSpot first because the sales team already knows it, then discover that HubSpot cannot generate solar proposals or track NEM status. That frustration drives adoption of solar-native platforms.
The 1,000+ deal tier is where generic CRMs become viable again, but only with heavy customization. National installers often run Salesforce with custom solar modules that cost more to build and maintain than a solar-native platform would. They stay on Salesforce because the rest of the enterprise — accounting, HR, inventory — already runs on it.
CRM Platform Comparison
| Platform | Type | Pricing | Best For | Notable Limitation |
|---|---|---|---|---|
| JobNimbus | Generic CRM + solar plugin | $49–$99/user/month | Small installers already using JobNimbus | Not solar-native; requires customization |
| HubSpot + integrations | Generic CRM | $50–$150/user/month | Marketing-heavy teams | Needs third-party solar connectors |
| OpenSolar 3.0 | All-in-one (design + CRM) | Free | Solo installers, international markets | Limited advanced CRM features |
| Solargraf | All-in-one | SaaS per user | Latin American market | Limited US utility integrations |
| Sunbase | Solar-specific CRM | $79–$149/user/month | US residential installers | Design integration less mature |
| SurgePV | Design + proposal + CRM | SaaS subscription | Installers wanting unified workflow | Smaller ecosystem than Aurora |
| Scoop Solar | Solar-specific CRM | Custom enterprise | Commercial solar sales teams | Enterprise focus, not residential |
The “all-in-one versus best-of-breed” debate is most intense in this segment. All-in-one platforms promise a single login and seamless data flow from lead to design to proposal to installation. Best-of-breed stacks offer deeper capability in each function but require integration work. Our guide to how solar proposal software increases sales covers this tradeoff in detail.
The Installer Adoption Story
Here is how software adoption typically plays out for a growing installer:
Year 1–2: The founder uses Excel for leads, Google Earth for rough site assessment, and a PDF template for proposals. This works until the team hits 3–5 sales reps and proposals start looking inconsistent.
Year 3: They adopt a design tool — usually Aurora if US-based, OpenSolar if budget-constrained. Proposals are exported as PDFs and emailed manually. CRM is still Excel or a basic HubSpot setup. Many start exploring solar quote software at this stage.
Year 4–5: At 10+ employees, the Excel CRM breaks. Leads fall through cracks. Commission disputes arise. The company evaluates solar-specific CRMs. Some choose all-in-one (OpenSolar, SurgePV). Others build a stack: HubSpot for CRM, Aurora for design, PandaDoc for proposals.
Year 6+: Large installers (50+ employees) often move to custom integrations. They keep Aurora for design but build API connections to their CRM, ERP, and accounting systems. The software stack becomes a competitive advantage — or a maintenance burden.
“The mistake we made was trying to run everything in one tool. We outgrew OpenSolar’s CRM in 18 months but were locked into its design workflow. Now we use SurgePV for design and proposals, HubSpot for CRM, and a custom dashboard for pipeline tracking.” — Operations director, 35-employee installer in Florida
What Most Solar Software Market Reports Miss
Analyst reports on the solar software market are useful for headline numbers but consistently miss three realities that matter to actual buyers.
1. Hardware Bundling Distorts the Monitoring Market
Market reports often size the “solar monitoring software market” at $0.8–$1.2 billion. But the majority of residential monitoring is bundled free with inverters. SolarEdge does not break out monitoring revenue separately — it is embedded in the inverter price. Enphase does the same. The true standalone monitoring market is perhaps one-third the reported size.
This matters because it explains why new monitoring startups struggle. They are competing not with other software companies but with hardware vendors who give monitoring away to sell inverters.
2. The Churn Rate Is Higher Than SaaS Benchmarks
Solar installer businesses have high failure rates. The US sees 15–20% annual turnover among small installation companies. When an installer shuts down, their software subscription cancels. This creates churn that pure SaaS businesses in stable industries do not face.
Analyst reports that apply standard SaaS retention assumptions (90–95% annual retention) overstate the lifetime value of solar software customers. Real retention in this market is closer to 80–85% when installer failures are included.
3. AI Is Overhyped in Design, Underhyped in Sales
Every market report mentions AI as a growth driver. But the reality is uneven. AI roof modeling (Aurora’s 15-second 3D generation) is genuinely useful. AI panel placement optimization is marginal — most experienced designers adjust layouts manually anyway. AI shadow analysis is good but not yet reliable enough to skip physical site visits on complex roofs.
Where AI is genuinely transformative and underreported is in sales. Real-time pricing engines that adjust quotes based on module inventory, local incentive changes, and financing availability are reshaping how fast installers can respond to leads. Speed-to-lead is a bigger competitive advantage than faster roof modeling. Our Clara AI assistant helps installers automate this exact workflow.
The Real Competitive Moat Is Data, Not Algorithms
Market reports talk about AI as if the algorithms themselves are the differentiator. They are not. The competitive moat in solar software is training data — specifically, historical failure data for predictive maintenance and historical design data for AI-assisted layout.
A startup can hire machine learning engineers and build a roof detection model in six months. What it cannot replicate is Aurora’s dataset of millions of roof models or AlsoEnergy’s decade of inverter failure records. Data compounds over time in a way that code does not. This is why acquisitions (Aurora buying HelioScope and Lyra) matter more than new entrants with better UI.
The misconception that “better AI” will disrupt established players ignores this data advantage. New entrants will find niches — ARKA 360 in 3D visualization, SurgePV in integrated proposal workflows — but displacing Aurora in residential design or AlsoEnergy in utility monitoring requires data, not just clever algorithms. See How to Design Residential Solar System for detailed guidance.
3. AI Is Overhyped in Design, Underhyped in Sales
Every market report mentions AI as a growth driver. But the reality is uneven. AI roof modeling (Aurora’s 15-second 3D generation) is genuinely useful. AI panel placement optimization is marginal — most experienced designers adjust layouts manually anyway. AI shadow analysis is good but not yet reliable enough to skip physical site visits on complex roofs.
Where AI is genuinely transformative and underreported is in sales. Real-time pricing engines that adjust quotes based on module inventory, local incentive changes, and financing availability are reshaping how fast installers can respond to leads. Speed-to-lead is a bigger competitive advantage than faster roof modeling. Our Clara AI assistant helps installers automate this exact workflow.
Design, Propose, and Track in One Platform
SurgePV combines solar design, shadow analysis, proposal generation, and sales pipeline management in a single workflow. Built by installers who got tired of switching between five tools.
Book a DemoNo commitment required · 20 minutes · Live project walkthrough
Pricing Models — Per Seat, Per Project, Per kW
Solar software pricing has evolved from simple monthly subscriptions to a mix of models. Understanding the tradeoffs helps installers budget accurately.
Pricing Model Comparison
| Model | Typical Range | Best For | Drawback |
|---|---|---|---|
| Per seat / user / month | $49–$259/user/month | Stable teams with predictable headcount | Becomes expensive as team grows |
| Per project / design | $5–$50 per design | Variable volume, seasonal businesses | Hard to budget; costs spike in busy months |
| Per kW designed | $0.01–$0.05/kW | Large commercial and utility projects | Rare for residential; complex to administer |
| Per system monitored | $2–$10/system/year | Residential fleet operators | Only viable at scale (1,000+ systems) |
| Enterprise flat fee | $10,000–$100,000+/year | Large EPCs, asset managers | Requires negotiation; may include unused capacity |
| Hardware-bundled | ”Free” with inverter | Residential, small commercial | Vendor lock-in; limited multi-brand support |
The per-project model is gaining traction in design software. Aurora’s credit system is essentially per-project pricing with a SaaS wrapper. This benefits small installers who do 10–30 designs per month and hurts large ones doing 500+. For more on choosing the right pricing model, read our guide on free vs paid solar design software.
The Hidden Cost: Integration Labor
Most market analyses focus on subscription costs and ignore integration labor. A mid-size installer running Aurora for design, HubSpot for CRM, and QuickBooks for accounting spends $30,000–$50,000 per year on software subscriptions. But they also spend 5–15 hours per week moving data between systems — exporting designs, importing leads, reconciling commissions. At $50 per hour for operations staff, that is $13,000–$39,000 per year in hidden labor cost.
All-in-one platforms reduce this friction but introduce their own costs. When design, CRM, and accounting live in one system, a bug or outage affects everything. Best-of-breed stacks isolate failures but require integration work. There is no free lunch — only a choice between which costs you prefer to pay.
For monitoring, the hardware-bundled model dominates residential. Standalone monitoring only makes sense for multi-brand fleets or utility-scale plants where the operator did not specify inverters.
Total Cost of Ownership Example
A 25-employee residential installer in California might spend:
| Software | Annual Cost | Model |
|---|---|---|
| Design (Aurora, 5 seats) | $15,000 | Per seat |
| CRM (HubSpot Sales Pro, 8 seats) | $12,000 | Per seat |
| Proposal (PandaDoc, 5 seats) | $3,000 | Per seat |
| Monitoring (SolarEdge, bundled) | $0 | Hardware-bundled |
| Accounting (QuickBooks) | $3,600 | Per seat |
| Total | $33,600 |
The same installer using an all-in-one platform might pay $18,000–$24,000 annually for 8 seats covering design, proposal, and CRM. The savings come from reduced integration work and fewer logins, but the tradeoff is less depth in each function.
2027–2030 Forecast — Where AI Reshapes the Stack
The solar software market is projected to reach $4.8–$5.8 billion by 2030. The path from $2.4 billion to that figure depends on three technology shifts.
AI-Driven Design Automation
By 2028, AI will handle 80% of standard residential designs with minimal human intervention. The remaining 20% — complex commercial roofs, heritage buildings, unusual shading — will still need engineers. This does not eliminate design jobs; it shifts them from routine layout work to quality control and exception handling.
Aurora’s 15-second roof model generation is the current state of the art. The next generation will integrate real-time utility rate structures, local incentive databases, and financing options directly into the design output. A sales rep will generate a complete, finance-ready proposal in a single workflow. For more on AI in design, see our post on AI solar design and automated PV layout.
The API Economy Comes to Solar
By 2029, expect most solar software platforms to position themselves as API-first. The winning model will not be the tool with the most features — it will be the tool that connects most easily to everything else. Installers will compose their own stacks: design from one vendor, CRM from another, monitoring from a third, all linked by APIs.
This shift favors platforms with strong developer ecosystems. Salesforce became dominant not because it was the best CRM but because it connected to everything. The solar equivalent does not yet exist. OpenSolar has an API but limited third-party integrations. Aurora has deeper integrations but charges for API access at enterprise tiers. The first platform to offer genuinely open, well-documented APIs at affordable pricing will attract the developer community and, through them, the installer market.
Regulatory Complexity Drives Software Demand
Solar incentives are becoming more complex, not less. The US has 50 states with different net metering rules, tax credits, and permitting requirements. Europe has 27 national markets with varying grid codes and subsidy schemes. Each regulatory change creates demand for software that tracks and automates compliance.
This is a durable growth driver that most market reports underweight. Even if solar module prices stop falling and installation growth slows, regulatory complexity will continue increasing. Software that helps installers navigate that complexity — automated permit filing, real-time incentive tracking, jurisdiction-specific proposal templates — becomes more valuable as rules get more complicated.
Predictive O&M Becomes Standard
Predictive maintenance modules that forecast inverter and string failures will move from early-adopter status to standard feature by 2028. The economics are compelling: a single prevented failure on a utility-scale plant can save more than the annual software cost.
AlsoEnergy and Power Factors are investing heavily here. The competitive moat is not the algorithm — it is the training data. Platforms with 10+ GW under management have failure histories that new entrants cannot replicate.
Platform Consolidation
The solar software market has too many point solutions. An installer in 2026 might use six separate tools: lead capture, CRM, design, proposal, monitoring, and accounting. By 2030, expect that to compress to three or fewer.
Consolidation will happen through acquisition (Aurora buying HelioScope and Lyra is the template) and through all-in-one platforms expanding their feature sets. The winners will be platforms that solve the integration problem — either by building everything in-house or by offering well-documented APIs that let installers compose their own stacks. For more on platform selection, see our commercial solar design software buyer guide. Read Design Commercial Solar System 1MW for a complete walkthrough.
The Geographic Expansion Opportunity
Most solar software revenue today comes from North America and Western Europe. But the fastest-growing solar markets — India, Brazil, Southeast Asia, the Middle East — are underserved by software. Local installers in these regions often use Excel, AutoCAD, and WhatsApp because US-centric tools do not support local languages, grid codes, or incentive structures.
This creates a clear expansion opportunity. OpenSolar’s 160-country footprint shows the demand exists. The challenge is localization — not just translation but regulatory compliance, utility integration, and financing partner connectivity. The first platform to crack the Indian market, with its complex state-level regulations and massive installer base, will add millions in annual recurring revenue. Solargraf’s Latin American focus is a preview of this strategy: build deep in one high-growth region rather than spreading thin globally.
Market Size Projection Table
| Year | Design ($B) | Monitoring ($B) | CRM/Sales ($B) | Total ($B) |
|---|---|---|---|---|
| 2024 | 0.65 | 0.62 | 0.38 | 1.65 |
| 2025 | 0.78 | 0.71 | 0.52 | 2.01 |
| 2026 | 0.90 | 0.80 | 0.70 | 2.40 |
| 2027 | 1.05 | 0.90 | 0.88 | 2.83 |
| 2028 | 1.22 | 1.02 | 1.08 | 3.32 |
| 2029 | 1.42 | 1.15 | 1.28 | 3.85 |
| 2030 | 1.65 | 1.30 | 1.50 | 4.45 |
Note: Conservative scenario. Analyst high estimates place 2030 total at $5.8B assuming faster AI adoption and aggressive platform consolidation.
How Installers Choose Software in 2026
The decision framework for solar software has matured. Installers who made expensive mistakes in 2020–2023 now approach procurement more systematically.
The Five-Criteria Framework
1. Accuracy versus speed. Does the tool produce bankable yield reports for financing, or is it sales-focused? PVsyst and HelioScope win on accuracy. Aurora and SurgePV win on speed. OpenSolar trades some accuracy for zero cost. For more on accuracy standards, see our guide to advanced solar PV design software.
2. Integration depth. Does the platform connect to your CRM, accounting system, and permitting databases? API availability matters more than feature count. A tool with 100 features and no API is less valuable than one with 80 features and solid integrations.
3. Scalability of pricing. Will the software cost $500/month at 5 employees and $5,000/month at 50? Per-seat models punish growth. Per-project models reward it. Understand the cost curve before committing.
4. Mobile experience. Sales reps work from trucks and coffee shops, not desks. The mobile app quality of a design or CRM tool is a real productivity factor. Test the mobile experience during the trial, not just the desktop version. For more on sales workflows, see our guide to the in-home solar sales process.
5. Support responsiveness. When a proposal deadline is 4 hours away and the software glitches, does support answer in minutes or days? This is where smaller vendors sometimes beat larger ones. A 35-person company can offer Slack-based support that Salesforce cannot match. For more on sales workflows, see our guide to the in-home solar sales process.
The Buyer’s Remorse Pattern
The most common post-purchase regret among installers is overbuying. A 5-person team signs up for Aurora Enterprise because they want “room to grow.” Six months later, they are using 15% of the features and paying for 20 seats they do not need. The second most common regret is undertraining — the tool can do everything they need, but nobody on the team knows how to use the advanced features.
The fix for both is simple: start with the tier that matches your current workflow, not your five-year vision. Upgrade when you hit a clear limitation, not when the vendor’s sales rep says you should. And budget 20% of your software spend for training — internal documentation, vendor webinars, or hiring a consultant to set up workflows correctly the first time.
Common Mistakes to Avoid
- Overbuying. A 5-person team does not need enterprise SCADA. Start simple and upgrade as needs emerge.
- Undertraining. The best software fails if the team uses 10% of its features. Budget for training, not just licensing.
- Ignoring data portability. Can you export your designs, customer records, and historical data if you switch platforms? Some vendors make this difficult.
- Chasing features over workflow. A tool with 50 features you never use is worse than one with 20 features you use daily.
Conclusion
The solar software market at $2.4 billion in 2026 is a maturing SaaS category with clear leaders, emerging challengers, and predictable growth. Three points stand out:
- Design software is the revenue leader at $0.9 billion, but CRM and sales software at $0.7 billion is growing faster and has more room for new entrants.
- Hardware bundling makes the monitoring market smaller than headline numbers suggest. Standalone monitoring is primarily a utility-scale and multi-brand commercial play.
- AI will reshape the stack by 2030, but the impact will be uneven — sales automation and predictive O&M will see the biggest gains, while design AI will plateau as it handles routine work but struggles with complex exceptions.
For installers choosing software today, the best advice is to match the tool to the team’s size and workflow, not to chase the most feature-rich option. A simple tool used well outperforms a complex tool used poorly. Start with our solar design software guide to understand what features matter most for your use case. If you are evaluating platforms now, our post on how to choose solar design software walks through the decision framework in detail.
Frequently Asked Questions
What is the solar software market size in 2026?
The global solar software market is valued at approximately $2.4 billion in 2026, growing at a compound annual growth rate (CAGR) of 18% according to analyst consensus from Grand View Research, MarketsandMarkets, and Allied Market Research. The market splits into three main segments: solar design software ($0.9B), solar monitoring and O&M software ($0.8B), and solar CRM, proposal, and sales software ($0.7B).
What is the fastest growing segment in solar software?
Solar CRM and sales software is the fastest growing segment, expanding at roughly 22% CAGR through 2030. The shift from spreadsheet-based quoting to integrated proposal and pipeline management tools is driving adoption among small and mid-size installers who previously managed leads in Excel.
Who are the leading solar design software companies?
Aurora Solar leads the residential design segment, followed by OpenSolar (free tier with 25,000+ users across 160 countries), HelioScope (owned by Aurora, focused on commercial and utility-scale), and PVsyst (the engineering standard for yield modeling). Emerging challengers include SurgePV (integrated design-to-proposal), Solargraf, and ARKA 360.
What is the solar monitoring software market size?
The solar monitoring software market is approximately $0.8 billion in 2026, growing at 11.9% CAGR according to DataHorizzon Research. Key players include SolarEdge (module-level monitoring), Enphase Enlighten (microinverter-level), AlsoEnergy PowerTrack (utility-scale standard), Locus Energy (revenue-grade metering), and Tigo Energy Intelligence (rapid shutdown + monitoring).
How much do solar software platforms cost per user?
Pricing varies widely by segment. Solar design software ranges from free (OpenSolar) to $159–$259/user/month (Aurora, HelioScope) or $2,640–$6,000+/year. Solar monitoring is often bundled free with hardware (SolarEdge, Enphase) or costs $5,000–$50,000+/year for utility-scale platforms like AlsoEnergy. Solar CRM tools range from $49/user/month (entry-level) to $200+/user/month for enterprise platforms with integrated design and financial modeling.
What is the solar software market forecast for 2030?
Analysts project the solar software market will reach $5.8 billion by 2030, representing an 18% CAGR from the 2026 base of $2.4 billion. The 2030 market will likely be shaped by AI-driven design automation, predictive O&M, and consolidation of point solutions into unified platforms. Cloud deployment already accounts for 60% of installations, and AI-enabled tools have reached 55% adoption among enterprise solar operators.
What is the difference between all-in-one and best-of-breed solar software?
All-in-one platforms (OpenSolar, SurgePV, Solargraf) combine design, proposal, CRM, and sometimes monitoring in a single subscription. Best-of-breed stacks combine specialist tools: Aurora for design, HubSpot or JobNimbus for CRM, SolarEdge or AlsoEnergy for monitoring. The tradeoff is integration cost versus depth of capability. All-in-one works well for small-to-mid installers under 50 employees. Best-of-breed suits large EPCs and asset managers who need bankable yield reports and enterprise-grade portfolio analytics.
How is AI changing solar software in 2026?
AI is reshaping solar software across all three segments. In design, Aurora’s AI generates 3D roof models in under 15 seconds. In monitoring, predictive maintenance modules forecast inverter failures before they happen. In sales, AI quote engines adjust pricing in real time based on module availability and local incentive changes. By 2026, 55% of enterprise solar operators use AI-enabled tools, and the number is climbing fast.