

Installation revenue is lumpy. One strong quarter masks a weak pipeline. One policy change — like the expiration of the 30% U.S. residential Investment Tax Credit at the end of 2025 — can shrink new bookings overnight. The solar companies that survive these cycles are the ones that build predictable revenue streams alongside project sales. The solar O&M business model is the clearest example.
Every system you install becomes a long-term asset that needs service. Panels degrade. Inverters fail. Connectors loosen. Vegetation grows. Monitoring alerts go ignored. The owner of that system will pay someone to keep it running. That someone can be you, a third party, or a mix of both. The choice is a business-model decision, not a service detail. At SurgePV, we see installers and EPCs use this shift to reduce revenue volatility and raise company valuations.
This guide treats solar O&M as a strategic business model. It compares the three delivery models: in-house, outsourced, and hybrid. It maps the business model canvas, breaks down revenue streams, shows the margin math, and gives you a staged rollout plan. For broader growth context, see our guide to solar business growth strategies.
Quick Answer
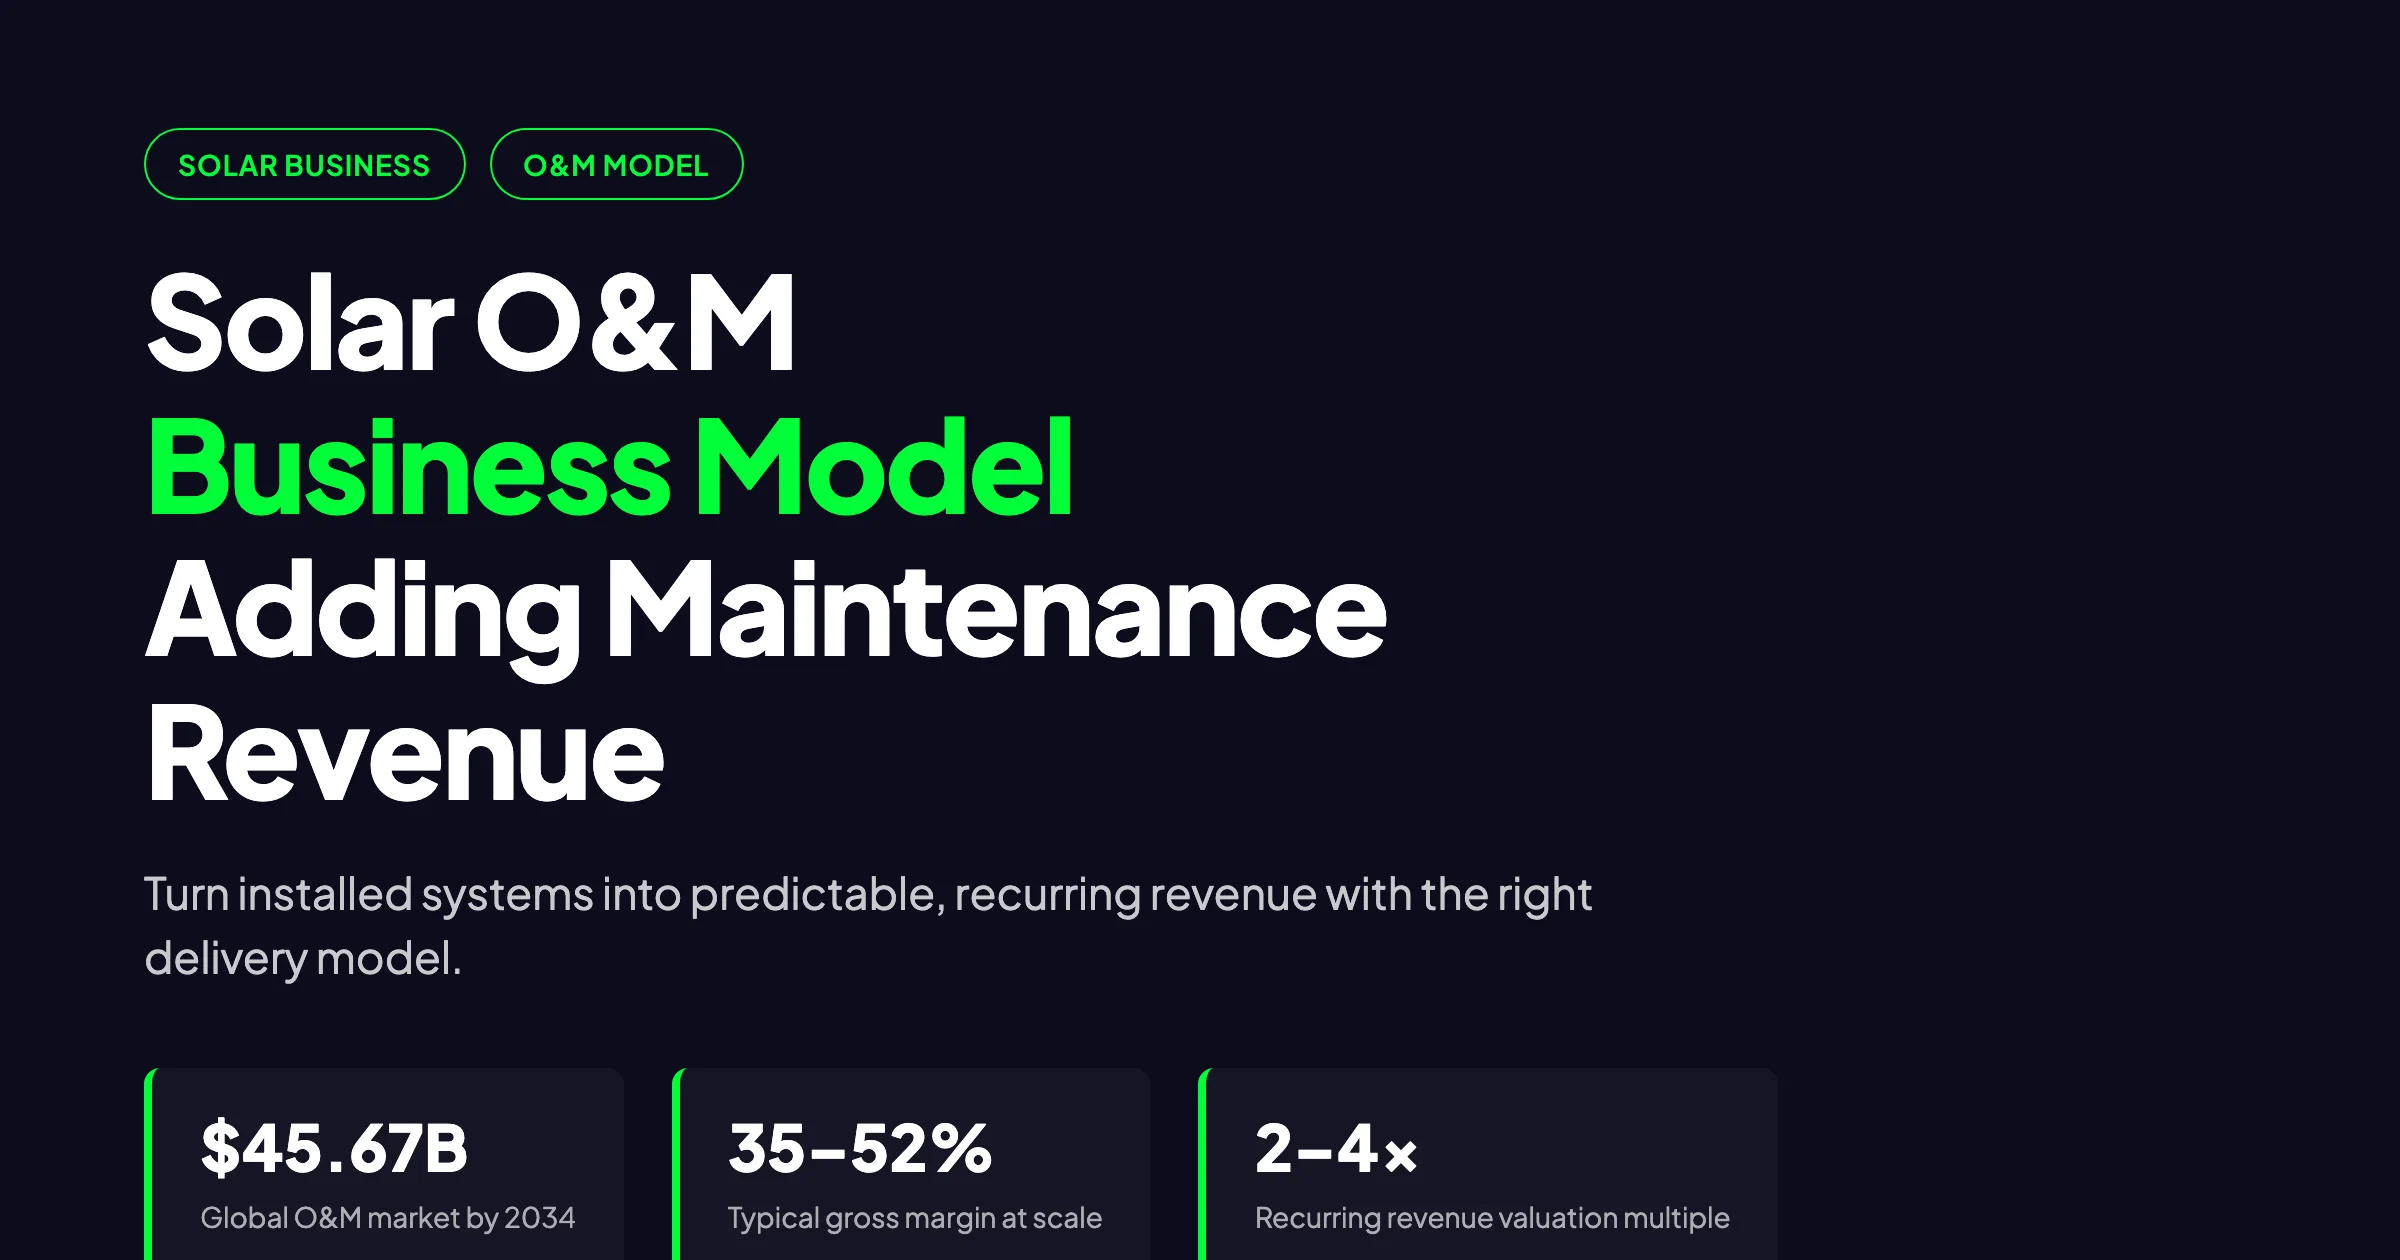
A solar O&M business model turns installed systems into recurring revenue through monitoring, preventive maintenance, corrective service, and asset management. The global solar O&M market is projected to reach $45.67 billion by 2034. Installers can choose in-house, outsourced, or hybrid delivery models, with gross margins typically ranging from 35% to 52% once routes and monitoring are optimized.
In this guide you will learn:
- Why O&M is a business model decision, not just an add-on service
- How the 2026 solar O&M market is shaped by aging systems and policy shifts
- The three delivery models: in-house, outsourced, and hybrid
- A business model canvas mapped specifically for solar O&M
- Revenue streams beyond the standard annual maintenance contract
- Pricing architecture and margin math for residential, commercial, and utility-scale contracts
- Operational setup at three stages of growth
- The strategic tradeoffs most installers overlook
- How to sell O&M as a business model to residential and commercial customers
- Software that makes the model scalable
- Common mistakes that break O&M profitability
Why Solar O&M Is a Business Model, Not Just a Service Line
Most solar companies start O&M for defensive reasons. Customers call with a fault. The installer fixes it to protect the brand. Over time, someone suggests selling annual maintenance plans. The idea feels like a service upsell.
That framing is too narrow. A service upsell optimizes a single transaction. A business model creates a separate revenue engine with its own cost structure, customer relationship, and valuation profile.
The difference matters. When O&M is a service upsell, it is priced low to close the installation deal. Margins disappear. Technicians are pulled from install crews without a schedule. Contracts are verbal. Monitoring is optional. The result is a money-losing distraction.
When O&M is a business model, it has its own profit-and-loss statement. Pricing is based on delivery cost. Contracts define scope. Monitoring is the foundation. Route density drives margin. Renewal rates determine valuation. It becomes a durable asset on your balance sheet.
The financial argument is stark. Installation revenue in solar M&A typically trades at 0.3–0.5x revenue. Recurring O&M revenue with multi-year contracts and high renewal rates trades at 2–4x revenue. A $100,000 O&M book adds $200,000–$400,000 to enterprise value. The same $100,000 in installation revenue adds $30,000–$50,000. The business model choice changes what your company is worth.
The Solar O&M Market in 2026
Three market forces are making O&M the most attractive business-model pivot for solar companies in 2026.
The installed base is aging. The United States alone has more than 5 million residential solar systems operating. Systems installed between 2016 and 2020 are now 6–10 years old. String inverters installed during the 2012–2016 boom are entering replacement territory. Many of the original installers have closed, merged, or stopped offering service. That creates a large population of orphaned systems with owners who need help.
New-install demand is compressing in key markets. The U.S. residential ITC expired at the end of 2025. Install volumes are expected to contract as a direct result. Installers who relied on tax-credit-driven demand must replace that revenue. O&M is the most direct source because the customer base already exists.
The O&M market is growing faster than installation employment. Solar O&M employment in the United States nearly doubled between 2019 and 2024, reaching 21,833 dedicated workers according to the U.S. Department of Energy. This signals a professionalizing industry with labor supply building behind it.
Globally, the solar O&M market is projected to grow from $17.28 billion in 2025 to $45.67 billion by 2034, a compound annual growth rate of 11.4%, according to TrendX Insights. Technical O&M — inspections, cleaning, repairs, and inverter service — accounts for roughly 52% of the market. Asset management — monitoring, reporting, warranty administration, and financial tracking — accounts for around 31%. Specialized services such as drone inspection, thermal imaging, and robotic cleaning make up the rest.
Key Takeaway
The O&M market is large, growing, and structurally underserved. Solar installers have a built-in advantage: customer relationships, system documentation, and technical knowledge that new entrants cannot easily replicate.
Three Solar O&M Business Models
Every solar company must choose how to deliver O&M. The three options are not right or wrong. They fit different portfolios, capabilities, and capital positions.
In-House or Self-Perform Model
In the in-house model, your company owns the entire O&M value chain. Your employees monitor systems, dispatch technicians, manage warranties, and invoice customers.
Best fit: Companies with dense local install bases, strong technical teams, and enough capital to hire dedicated staff. This model works best above 200 systems or 10–15 commercial sites in a compact geography.
Advantages: Full control over service quality, direct customer relationships, highest potential margins at scale, and full access to corrective and upgrade revenue.
Disadvantages: High fixed costs before scale, need for specialized expertise in diagnostics and warranty administration, and geographic constraints. A technician driving 50 miles between residential visits burns margin fast.
Outsourced or Third-Party Model
In the outsourced model, your company sells the O&M contract to the customer but delegates delivery to a specialized O&M provider. You keep the customer relationship and a margin on the contract.
Best fit: Companies with scattered portfolios, limited technical staff, or a strategy focused on sales and asset management rather than field service.
Advantages: Lower capital requirements, access to specialized tools and expertise, geographic flexibility, and the ability to scale without hiring technicians.
Disadvantages: Lower gross margins, less control over service quality, and risk of the provider building a direct relationship with your customer.
Hybrid Model
The hybrid model keeps strategic and customer-facing functions in-house while outsourcing specialized, remote, or geographically distant work. For example, you might perform monitoring and customer reporting internally but outsource thermal inspections, inverter replacements in remote markets, or drone surveys.
Best fit: Most mid-size installers. The hybrid model lets you capture the customer relationship and core service revenue while avoiding the fixed costs of full vertical integration.
Advantages: Flexibility, lower fixed cost than pure in-house, better control than pure outsourced, and ability to adjust the mix as the portfolio grows.
Disadvantages: Requires strong vendor management and clear service-level agreements. Poor partner coordination creates gaps that hurt customer retention.
Decision Matrix
| Factor | In-House | Outsourced | Hybrid |
|---|---|---|---|
| Upfront capital | High | Low | Medium |
| Gross margin at scale | 40–55% | 15–25% | 30–45% |
| Geographic flexibility | Low | High | Medium–High |
| Control over quality | High | Low–Medium | Medium–High |
| Best portfolio size | 200+ systems | Any | 50–500 systems |
| Need for vendor management | Low | High | Medium |
| Customer retention leverage | High | Medium | High |
The matrix shows a clear pattern. In-house wins on margin and control but loses on flexibility. Outsourced wins on flexibility and low capital but sacrifices margin. Hybrid sits in the middle and is the right starting point for most installers moving into O&M.
Pro Tip
Start hybrid. Keep customer contracts, monitoring, and billing internal. Outsource only the field work you cannot cover efficiently. As route density improves, bring more services in-house.
Mapping the Solar O&M Business Model Canvas
A useful way to design an O&M business line is to map it on a business model canvas. This forces you to define each component before hiring or selling.
Customer segments. Residential homeowners, commercial and industrial building owners, property managers, schools, utilities, and independent power producers. Each segment needs a different contract structure and service level.
Value proposition. Keep the system producing at design output. Reduce unexpected repair costs. Protect warranty coverage. Provide transparent performance reporting.
Channels. Direct sales at project handover, email campaigns to existing install base, monitoring-alert follow-up calls, website self-service portals, and referral programs.
Customer relationships. Long-term service contracts, automated monthly reports, dedicated account managers for commercial clients, and technician-led homeowner education.
Revenue streams. Annual maintenance contracts, monitoring subscriptions, corrective repair labor, inverter and module replacements, battery retrofits, warranty administration fees, performance guarantees, and asset management retainers.
Key resources. Technicians, monitoring platform, service vehicles, as-built documentation, field service software, and spare parts inventory.
Key activities. Monitoring review, route scheduling, preventive visits, corrective dispatch, customer reporting, contract renewals, and warranty claims.
Key partnerships. Inverter and module manufacturers for warranty support, specialized contractors for drone or thermal work, monitoring hardware vendors, and software providers.
Cost structure. Technician labor, vehicle and fuel, monitoring platform subscriptions, insurance, admin and scheduling overhead, spare parts, and software licenses.
Mapping these blocks reveals where your company is already strong and where you need partners. An installer with strong project documentation and customer relationships is well positioned. An installer without monitoring infrastructure is not.
| Canvas Block | Solar O&M Definition |
|---|---|
| Customer segments | Homeowners, C&I owners, property managers, utilities, IPPs |
| Value proposition | Sustained output, lower repair risk, warranty protection, transparency |
| Channels | Handover sales, email campaigns, alert follow-ups, referrals, web portal |
| Customer relationships | Service contracts, monthly reports, account managers, technician visits |
| Revenue streams | AMCs, monitoring, corrective labor, replacements, retrofits, asset management |
| Key resources | Technicians, vehicles, monitoring platform, documentation, spare parts |
| Key activities | Monitoring review, scheduling, inspections, dispatch, reporting, renewals |
| Key partnerships | OEMs, specialist contractors, monitoring vendors, software providers |
| Cost structure | Labor, fuel, subscriptions, insurance, admin, parts, software |
Revenue Streams Beyond the Annual Maintenance Contract
The annual maintenance contract is the core revenue stream, but it is not the only one. A healthy O&M business model stacks multiple revenue sources on top of the base contract.
Monitoring subscriptions. Even customers who decline a full maintenance plan often pay for active monitoring and basic reporting. This is a low-friction entry point.
Corrective repair labor. Faults happen outside the scope of preventive maintenance. Charging for corrective work at a discounted rate for contract customers and full rate for non-customers protects margin and creates a clear upsell incentive.
Inverter replacement. String inverters typically carry 10–12 year warranties. Systems installed during the early solar boom are now hitting replacement age. A residential inverter replacement runs $1,500–$3,500 installed. Your annual diagnostic puts you first in line for that job.
Module replacement. Physical damage, manufacturing defects, and severe degradation create module replacement opportunities. These are often warranty claims, but the labor and logistics are billable.
Battery and storage retrofits. As battery prices fall and grid reliability concerns rise, existing solar customers become candidates for storage additions. An O&M relationship gives you trusted access to that decision.
Warranty administration. Many customers do not know how to file inverter or module warranty claims. Managing that process is high perceived value and low delivery cost.
Performance guarantees. Commercial customers may pay a premium for a contract that includes a production guarantee. This transfers risk to you, so price it carefully and only offer it where you have strong monitoring data.
Asset management retainers. Large commercial portfolios and utilities pay for financial reporting, PPA compliance, insurance coordination, and investor reporting. This is less labor-intensive than technical O&M but requires strong software and reporting discipline. See our solar asset management guide for a deeper look at this segment.
A residential customer on a $250 annual Standard plan might generate another $300–$800 in corrective and upgrade revenue over five years. A commercial customer on a $2,000 annual contract might generate $5,000–$15,000 in additional inverter, monitoring upgrade, and asset management work.
Pricing Architecture and Margin Math
Pricing must be based on delivery cost, not on what competitors charge. Underpricing is the fastest way to turn O&M into a loss-making service line.
Residential Pricing
Residential contracts are usually sold as tiered annual plans.
Basic plan — $99–$150 per year. Includes remote monitoring, an annual performance report, and one remote diagnostic review. This tier gets your technician on the property when a fault occurs and builds the relationship.
Standard plan — $200–$300 per year. Adds one annual visual inspection, panel cleaning, connection checks, and inverter diagnostics. This is the most common tier for homeowners who understand the financial risk of underperformance.
Premium plan — $400–$700 per year. Adds priority response, additional cleanings in dusty climates, warranty administration, and performance benchmarking.
A technician on an efficient route can complete 6–8 residential inspection and cleaning visits per day. The cost per visit breaks down roughly as follows:
| Cost Item | Estimate |
|---|---|
| Technician labor | $40–$52 per job |
| Vehicle and fuel | $12–$18 per job |
| Materials | $20–$40 per visit |
| Admin and scheduling overhead | $15–$20 per job |
| Total cost per inspection + cleaning visit | $87–$130 |
At $110 average delivery cost and a $250 Standard plan, a single visit produces $140 gross profit before monitoring. After monitoring costs of $60–$96 per year, net margin on the Standard contract is typically 20–35%.
With 200 residential Standard customers, annual recurring revenue is $50,000. Delivery costs run roughly $22,000–$26,000. Monitoring costs run $12,000–$19,200. Gross profit is $4,800–$16,000 at one visit per year. Margin expands sharply when you add a second annual cleaning or batch more customers into dense routes.
Commercial Pricing
Commercial contracts are priced per kilowatt per year.
- Small commercial (under 100 kW): $20–$30 per kW per year
- Mid-size commercial (100 kW–1 MW): $15–$25 per kW per year
- Large commercial and industrial (over 1 MW): $10–$18 per kW per year
A 100 kW rooftop system at $18 per kW per year generates $1,800 annually. A typical commercial visit takes 4–6 hours and requires two technicians.
| Cost Item | Estimate |
|---|---|
| Two technician days | $560–$720 |
| Materials | $80–$120 |
| Admin and performance reporting | $100–$150 |
| Monitoring platform | $120–$180 |
| Total annual cost | $860–$1,170 |
| Annual revenue | $1,800 |
| Gross margin | 35–52% |
Commercial O&M is more profitable per customer but requires professional reporting, formal proposals, and relationship management with facilities teams.
Utility-Scale Pricing
Utility-scale O&M contracts start around $8 per kW per year for large portfolios. Median O&M costs for U.S. utility-scale solar have declined from about $40 per kW-year in 2012 to about $11 per kW-year in 2024, according to Lawrence Berkeley National Laboratory. These contracts are long-term, performance-driven, and highly competitive. They are typically served by specialized O&M providers rather than small installers.
Key Takeaway
Residential O&M builds volume. Commercial O&M builds margin. Utility-scale O&M builds scale. Most installers should start with residential and small commercial, then move upmarket as their systems and documentation mature.
Financial Modeling: Three O&M Business Scenarios
The financial impact of an O&M business line becomes clear when you model realistic scenarios. Here are three common paths for an installer building from its existing customer base.
Scenario 1: Residential-Only, 100 Customers
Assume 100 residential customers on a Standard tier at $230 per year.
| Metric | Value |
|---|---|
| Customers | 100 |
| Average contract value | $230/year |
| Annual recurring revenue | $23,000 |
| Monitoring platform costs | $7,200 |
| On-site visit delivery costs | $6,500–$8,000 |
| Gross profit | $7,800–$9,300 |
| Gross margin | 34–40% |
| Technician days required | 13–17/year |
At 200 customers, annual recurring revenue doubles to $46,000. Delivery costs do not double because route density improves. This is the math that makes residential O&M attractive.
Scenario 2: Commercial-Focused, 20 Customers
Assume an average system size of 150 kW per customer at $18 per kW per year.
| Metric | Value |
|---|---|
| Customers | 20 |
| Average system size | 150 kW |
| Contract value per customer | $2,700/year |
| Annual recurring revenue | $54,000 |
| Cost of delivery | $26,000–$32,000 |
| Gross profit | $22,000–$28,000 |
| Gross margin | 41–52% |
| Technician days required | 55–70/year |
Twenty commercial customers at this size require roughly one technician working on O&M two days per week. The margin is higher, but so is the sales and reporting effort.
Scenario 3: Mixed Portfolio, 150 Customers
| Segment | Count | Average Contract | ARR |
|---|---|---|---|
| Residential Basic | 40 | $120/year | $4,800 |
| Residential Standard | 70 | $230/year | $16,100 |
| Commercial (50–200 kW average) | 40 | $2,400/year | $96,000 |
| Total | 150 | — | $116,900 |
At a blended gross margin of 40–45%, this portfolio generates $46,760–$52,605 in gross profit. That is enough to cover a full-time O&M technician and a part-time coordinator, with contribution left for overhead.
What Recurring Revenue Does to Valuation
This is the argument that matters most to owners thinking about exit or capital. Installation revenue is valued at 0.3–0.5x revenue in M&A. Recurring service revenue with multi-year terms and documented renewal history is valued at 2–4x revenue.
A $200,000 O&M annual recurring revenue book is worth $400,000–$800,000 in a business sale. The same $200,000 in one-time installation revenue contributes $60,000–$100,000 to valuation. The multiple difference is why O&M deserves its own business unit, brand, and reporting.
Operational Setup at Three Stages of Scale
The operational infrastructure for O&M grows with the customer base. Trying to run a 500-system portfolio on spreadsheets is a common failure pattern.
Stage 1: 0–50 Customers
At this stage, O&M is an overlay on your existing installation team. No dedicated hire is needed.
What you need:
- A monitoring platform account
- A simple scheduling spreadsheet or CRM calendar
- A one-page service report template
- A written scope-of-services contract
Staffing: One technician, one to two days per month.
Target: Convert 30–50% of new installs to a Basic or Standard plan.
Stage 2: 50–200 Customers
At this scale, O&M needs coordination. One technician can handle up to 150 residential customers or 15–20 commercial customers if routes are efficient.
What you need:
- Field service management software for scheduling and route optimization
- Automated monthly customer reports
- A CRM with service history tracking
- A dedicated O&M section on your website
Staffing: One full-time O&M technician and a part-time coordinator.
Target: 40–60% O&M attachment rate on new installs; outreach campaign to existing customers.
Stage 3: 200+ Customers
At this scale, O&M should be a distinct business unit with its own P&L.
What you need:
- Dedicated O&M manager
- Two to three technicians or a regional subcontractor network
- Automated reporting through monitoring platform APIs
- Fleet management tools
- Separate recurring billing and renewal tracking
Target: $200,000–$500,000 in annual recurring revenue, typically representing 15–25% of total company revenue.
The transition from Stage 2 to Stage 3 is where most O&M programs succeed or fail. Without a dedicated manager, the operation stays reactive. Without automated reporting, customer communication becomes a bottleneck. Without renewal tracking, churn rises.
The Strategic Tradeoffs No One Talks About
Several tradeoffs shape the O&M business model. Ignoring them leads to bad decisions.
Volume versus margin. Residential O&M produces lower per-customer revenue but can scale through route density. Commercial O&M produces higher margins but requires sales cycles, formal proposals, and relationship management. A portfolio heavy on residential needs efficient operations. A portfolio heavy on commercial needs strong sales discipline.
Control versus capital. In-house delivery gives you control but ties up capital in vehicles, tools, payroll, and training. Outsourced delivery preserves capital but makes you dependent on partner quality. The right balance changes as your portfolio grows.
Reactive versus predictive. Reactive O&M waits for faults and dispatches technicians. Predictive O&M uses monitoring trends to catch issues early. Predictive models require better software and analytical skills but produce higher customer retention and lower emergency labor costs.
Customer retention versus customer ownership. In a hybrid or outsourced model, the field provider has direct contact with your customer. If that relationship becomes stronger than yours, renewal risk rises. The contract owner must stay visible through reporting, billing, and quarterly business reviews.
One-time upgrades versus recurring service. Inverter replacements and battery retrofits are lucrative. They can also distract the team from recurring contract renewals. A healthy O&M business protects the recurring base first and captures upgrades second.
Pro Tip
The most defensible O&M business is not the one with the lowest price. It is the one the customer cannot easily replace because you own the monitoring data, the as-built documentation, and the service history.
Selling O&M as a Business Model to Your Customers
The sales pitch for O&M is not about maintenance. It is about protecting an income stream.
A 10 kW residential system generating $1,800 per year in electricity value loses $180–$450 annually from undetected faults, according to NREL O&M cost modeling. A $250 Standard plan pays for itself if it catches and fixes one performance issue.
The same logic applies to commercial customers. A 100 kW system generating $20,000–$30,000 in annual electricity value loses $2,000–$7,500 per year from soiling, inverter clipping, or shading. A $1,800 O&M contract is a small premium to protect a large revenue stream.
O&M sales benefits from the same discipline as installation sales. Our guide to marketing for solar business covers the channels that feed the top of the funnel. For O&M specifically, activate these five sales channels:
Five sales channels to activate:
-
At project handover. Include the O&M offer in the commissioning package. Customers who sign at handover have the highest retention.
-
Annual performance report email. Send every customer a year-end summary with one clear call to action: book the inspection to protect next year’s production.
-
Fault alert follow-up calls. When monitoring flags an issue, call the customer before dispatching. Use the moment to explain the value of a service plan.
-
Five-year service reminder campaign. Systems at five years are entering their first real service cycle. A direct offer to this segment converts well.
-
Referrals from existing O&M customers. Satisfied customers are the best source of new O&M leads, especially for orphaned systems in their neighborhood.
What not to do. Do not pitch O&M as a fee for monitoring. Customers resist paying for something passive. Pitch it as protection: “We tell you when something is wrong before it becomes expensive.” Do not send generic quotes. Personalize every pitch with the customer’s system size and a calculation of what a 10–15% performance drop costs them.
For commercial customers, solar proposal software helps present O&M contracts with professional formatting, financial models, and clear scope tables. This matters because C&I buyers often need formal documentation before signing.
Using Software to Make the Model Scalable
Software is what separates a profitable O&M business from a busy one. Manual tracking across more than 50 customers creates errors, missed visits, and slow response times.
Monitoring platform. Every system under contract needs active production monitoring with custom alert thresholds. The goal is to call the customer about a problem before the customer calls you.
Solar design software with portfolio visibility. Centralized design records give technicians instant access to string configurations, inverter specs, and expected output. This cuts diagnostic time on corrective calls. SurgePV’s solar design software stores this documentation so the technician arrives knowing what to look at.
Generation and financial modeling. Tracking expected versus actual yield across multiple sites reveals systemic underperformance patterns. The generation and financial tool makes it straightforward to spot issues like recurring clipping or orientation faults across a batch of installs.
CRM and scheduling. Use your CRM to schedule recurring visits automatically, tag customers by tier, and trigger renewal tasks 90 days before contract expiration. For Indian EPCs managing high lead volumes alongside O&M, a purpose-built solar CRM with WhatsApp follow-up and subsidy automation can keep sales and service workflows in one place.
Field service management. Dispatch, route optimization, technician checklists, and parts inventory become essential above 100 customers.
Automated reporting. Monthly performance reports sent automatically reduce admin time while increasing perceived value. A one-page report showing generation, savings, avoided emissions, and alerts is often the difference between a renewal and a churn.
When these tools connect, the workflow becomes predictable. Monitoring alerts become work orders. Work orders become service reports. Service reports become renewal conversations. That is the operating system of a scalable O&M business model.
Predictive Maintenance as a Model Differentiator
Most O&M businesses start reactive. A customer calls. A technician is dispatched. The problem is fixed. This works, but it is the lowest-margin version of O&M because it relies on failure events.
Predictive maintenance shifts the model from reactive to proactive. It uses monitoring data trends to identify issues before they cause significant output loss or customer complaints. The techniques are accessible to mid-size installers without enterprise software budgets.
String-level performance analysis. Flag any string producing more than 5% below its designed output over a rolling 30-day period. The cause is usually soiling, new shading, or a loose connection. Catching it at 5% underperformance is a cleaning visit. Missing it until it becomes 20% underperformance is often an inverter replacement.
Inverter clipping pattern analysis. Repeated clipping events on a correctly designed system indicate module degradation or heavy soiling. This pattern is visible in inverter data 6–12 months before it appears on an electricity bill.
Performance ratio trending. Calculate the performance ratio monthly and track it over time. A ratio that falls from 82% in year one to 74% in year four is not normal degradation. It signals a serviceability issue.
Thermal inspection every 3–5 years. Thermal cameras identify hotspots, delamination, and bypass diode failures that visual inspection misses. This is a high-value upsell for premium commercial contracts.
Predictive maintenance improves retention. Customers see value when you call them about a problem they did not know existed. It also improves margin because scheduled preventive work is cheaper than emergency corrective work.
Building O&M Revenue From Systems You Did Not Install
Your own install base is the easiest source of O&M customers, but it is not the only one. A large portion of the addressable market consists of orphaned systems. The original installer has closed, merged, moved out of the service area, or never offered maintenance. The owner still needs service.
This third-party O&M market is structurally attractive. The customer acquisition cost is higher than selling to your own install base, but the competition is often weaker. Many orphaned system owners have no current service relationship and receive no monitoring alerts. They only notice a problem when their electricity bill rises or the inverter stops working.
The entry strategy is straightforward:
-
Identify geographic clusters where your technicians already operate. Route density matters even more for third-party systems because you do not have the install relationship to fall back on.
-
Target orphaned systems. Look for systems with no active monitoring account, no service provider on file, or original installers that are no longer active. Public interconnection databases, utility net metering lists, and local permit records can help build a target list.
-
Offer a free initial inspection and performance audit. The audit delivers immediate value. Most owners learn something they did not know: a soiling issue, an offline string, outdated inverter firmware, or a monitoring communication failure.
-
Propose a Standard or Premium contract based on audit findings. The free inspection converts well because it creates trust and surfaces problems the owner was not aware of.
Commercial property managers are an especially strong target. A manager with three to five rooftop systems across a portfolio will pay a premium for consolidated billing and a single reporting dashboard. Competing installers who only do single-site contracts cannot offer this.
Third-party O&M also opens new geographic markets. If you want to build revenue in a city where you cannot yet justify a full install team, O&M lets you establish a service presence with lower capital than an installation operation.
Common Mistakes That Break the O&M Business Model
Most O&M programs fail for operational reasons, not market reasons. The opportunity is real. The execution is hard.
Underpricing the contract. Many installers set O&M prices based on what they think customers will accept. A $99 annual plan that requires three hours of technician time plus monitoring is a loss leader, not a product.
No written contract. Verbal agreements lead to disputes. “I thought panel replacement was included” is an expensive conversation.
Skipping monitoring setup at commissioning. An O&M program without monitoring is purely reactive. You are waiting for customer complaints instead of catching faults early.
Bundling unlimited corrective labor. Until you know your corrective call frequency, charge corrective work separately. Flat-fee unlimited labor destroys margin the first time an inverter fails.
Ignoring warranty administration. Customers who own systems under warranty but do not know how to file claims are the easiest Premium-tier upsells.
No commissioning handoff process. If the install crew does not document monitoring credentials, string maps, and inverter settings, the O&M team wastes hours reconstructing that information. For complex commercial projects, solar design and engineering consultancy partners can deliver PE-stamped as-builts and permit packages that form the documentation backbone of long-term O&M.
Mixing O&M and install P&Ls. O&M has different margin profiles, renewal cycles, and valuation multiples. Track it separately.
Three concrete actions to take this quarter:
- Build a two-page O&M contract template with Basic, Standard, and Premium tiers priced from your actual delivery costs.
- Set up active monitoring on every new install and retroactively offer monitoring-only plans to recent customers.
- Run a 90-day pilot with 20 existing customers, track cost per visit and renewal rate, then refine pricing before broader rollout.
Contract Structure and Scope Boundaries
A clear contract is the operating system of a profitable O&M business model. Ambiguity is expensive. Every O&M agreement should define these elements in plain language.
Scope of services. List exactly what is included: monitoring, inspections, cleaning, firmware updates, connection checks, vegetation management, and report frequency. Specify what is not included: corrective repairs, module replacement, inverter replacement, roof work, and electrical upgrades.
Service levels and response times. Define response times by severity. A complete inverter failure might require a 24-hour response. A minor monitoring communication issue might require a 72-hour response. Be specific.
Pricing and payment terms. State the annual fee, payment schedule, renewal date, and escalation clause. Clarify whether corrective labor is discounted or billed separately.
Performance guarantees. Only offer production guarantees where you have strong historical monitoring data. Define the baseline, measurement method, and remedy. A poorly written guarantee transfers downside risk to you without adequate price compensation.
Warranty administration. State whether the O&M provider will file warranty claims on behalf of the customer. Define who pays for shipping, labor, and diagnostic time if the claim is denied.
Liability and insurance. Confirm insurance coverage limits, hold-harmless clauses, and responsibility for roof penetrations or weather damage.
Termination and data ownership. Define notice periods, renewal terms, and who owns monitoring data and service records after termination. Losing the data history makes it harder to win the customer back.
A two-page contract is enough for residential plans. Commercial contracts often need 4–6 pages and legal review. The time spent on scope clarity pays for itself in the first avoided dispute.
Frequently Asked Questions
What is a solar O&M business model?
A solar O&M business model generates recurring revenue by providing operations and maintenance services for existing photovoltaic systems. It includes monitoring, preventive maintenance, corrective repairs, inverter replacement, warranty administration, and asset management. Companies can deliver these services through in-house teams, outsourced providers, or hybrid arrangements.
How profitable is a solar O&M business?
Solar O&M is typically profitable once route density and monitoring are established. Residential service plans often produce 35–50% gross margins. Commercial contracts at $15–$25 per kW per year can reach 35–52% gross margins. Recurring revenue also commands a 2–4x valuation multiple in M&A, compared with 0.3–0.5x for one-time installation revenue.
What are the main solar O&M business models?
The three main models are in-house or self-perform, outsourced to a third-party O&M provider, and hybrid. In-house gives full control but requires capital and scale. Outsourced reduces fixed costs and adds expertise. Hybrid keeps strategic functions internal while outsourcing specialized or geographically distant work. The right choice depends on portfolio size, geographic spread, and internal capabilities.
What services should a solar O&M contract include?
A complete O&M contract covers remote production monitoring, periodic visual inspections, panel cleaning, inverter health checks and firmware updates, electrical connection inspections, vegetation management, and corrective repair dispatch. Premium tiers add thermal imaging, performance guarantees, warranty claim management, and priority response.
How much should a solar O&M contract cost?
Residential O&M contracts typically range from $99 to $300 per year for basic monitoring and inspection tiers. Commercial contracts are usually priced at $15–$25 per kW per year. Utility-scale contracts often start near $8 per kW per year for large portfolios. Pricing should be based on actual delivery cost plus target margin, not on competitor pricing alone.
How do I start a solar O&M business line?
Start with your existing install base. Offer a monitoring-only plan, then add inspection and cleaning tiers. Create a written scope-of-services agreement, train one technician on O&M protocols, and set up a CRM or field service schedule. Most installers can launch a basic O&M program within 30 days and refine pricing after the first 50 customers.
What is the biggest mistake solar companies make with O&M?
The biggest mistake is treating O&M as a low-price add-on rather than a standalone business line. Underpricing, skipping written contracts, neglecting monitoring setup at commissioning, and bundling unlimited corrective labor into flat fees all erode margins. O&M should have its own P&L, pricing based on cost, and clear scope boundaries.
How does software help scale a solar O&M business?
Software connects monitoring alerts to work orders, automates customer reporting, stores as-built designs and string maps, and tracks contract renewals. Solar design software, generation and financial tools, CRMs, and field service platforms reduce manual work and allow a small team to manage hundreds of systems.
Where this fits
This article is part of SurgePV's Solar Business & Operations hub, which works through the topic from first principles to the decisions a project team actually has to make.

