In March 2025, SunPath Installers of Phoenix, Arizona walked into a $340,000 problem. They had built it themselves over 18 months. The 45-person residential and light-commercial EPC had accumulated 2,800 panels in a rented warehouse. The stock covered three module models from two manufacturers. Prices ranged from $0.18 per watt to $0.31 per watt across four distributor contracts.
Two models had been superseded by newer series. One manufacturer had tightened warranty terms for non-current stock. The warehouse lease cost $4,200 per month. Insurance ran $680 per month. The oldest pallet — 400 modules from June 2024 — showed early oxidation on the anodized aluminum frames from Phoenix summer heat.
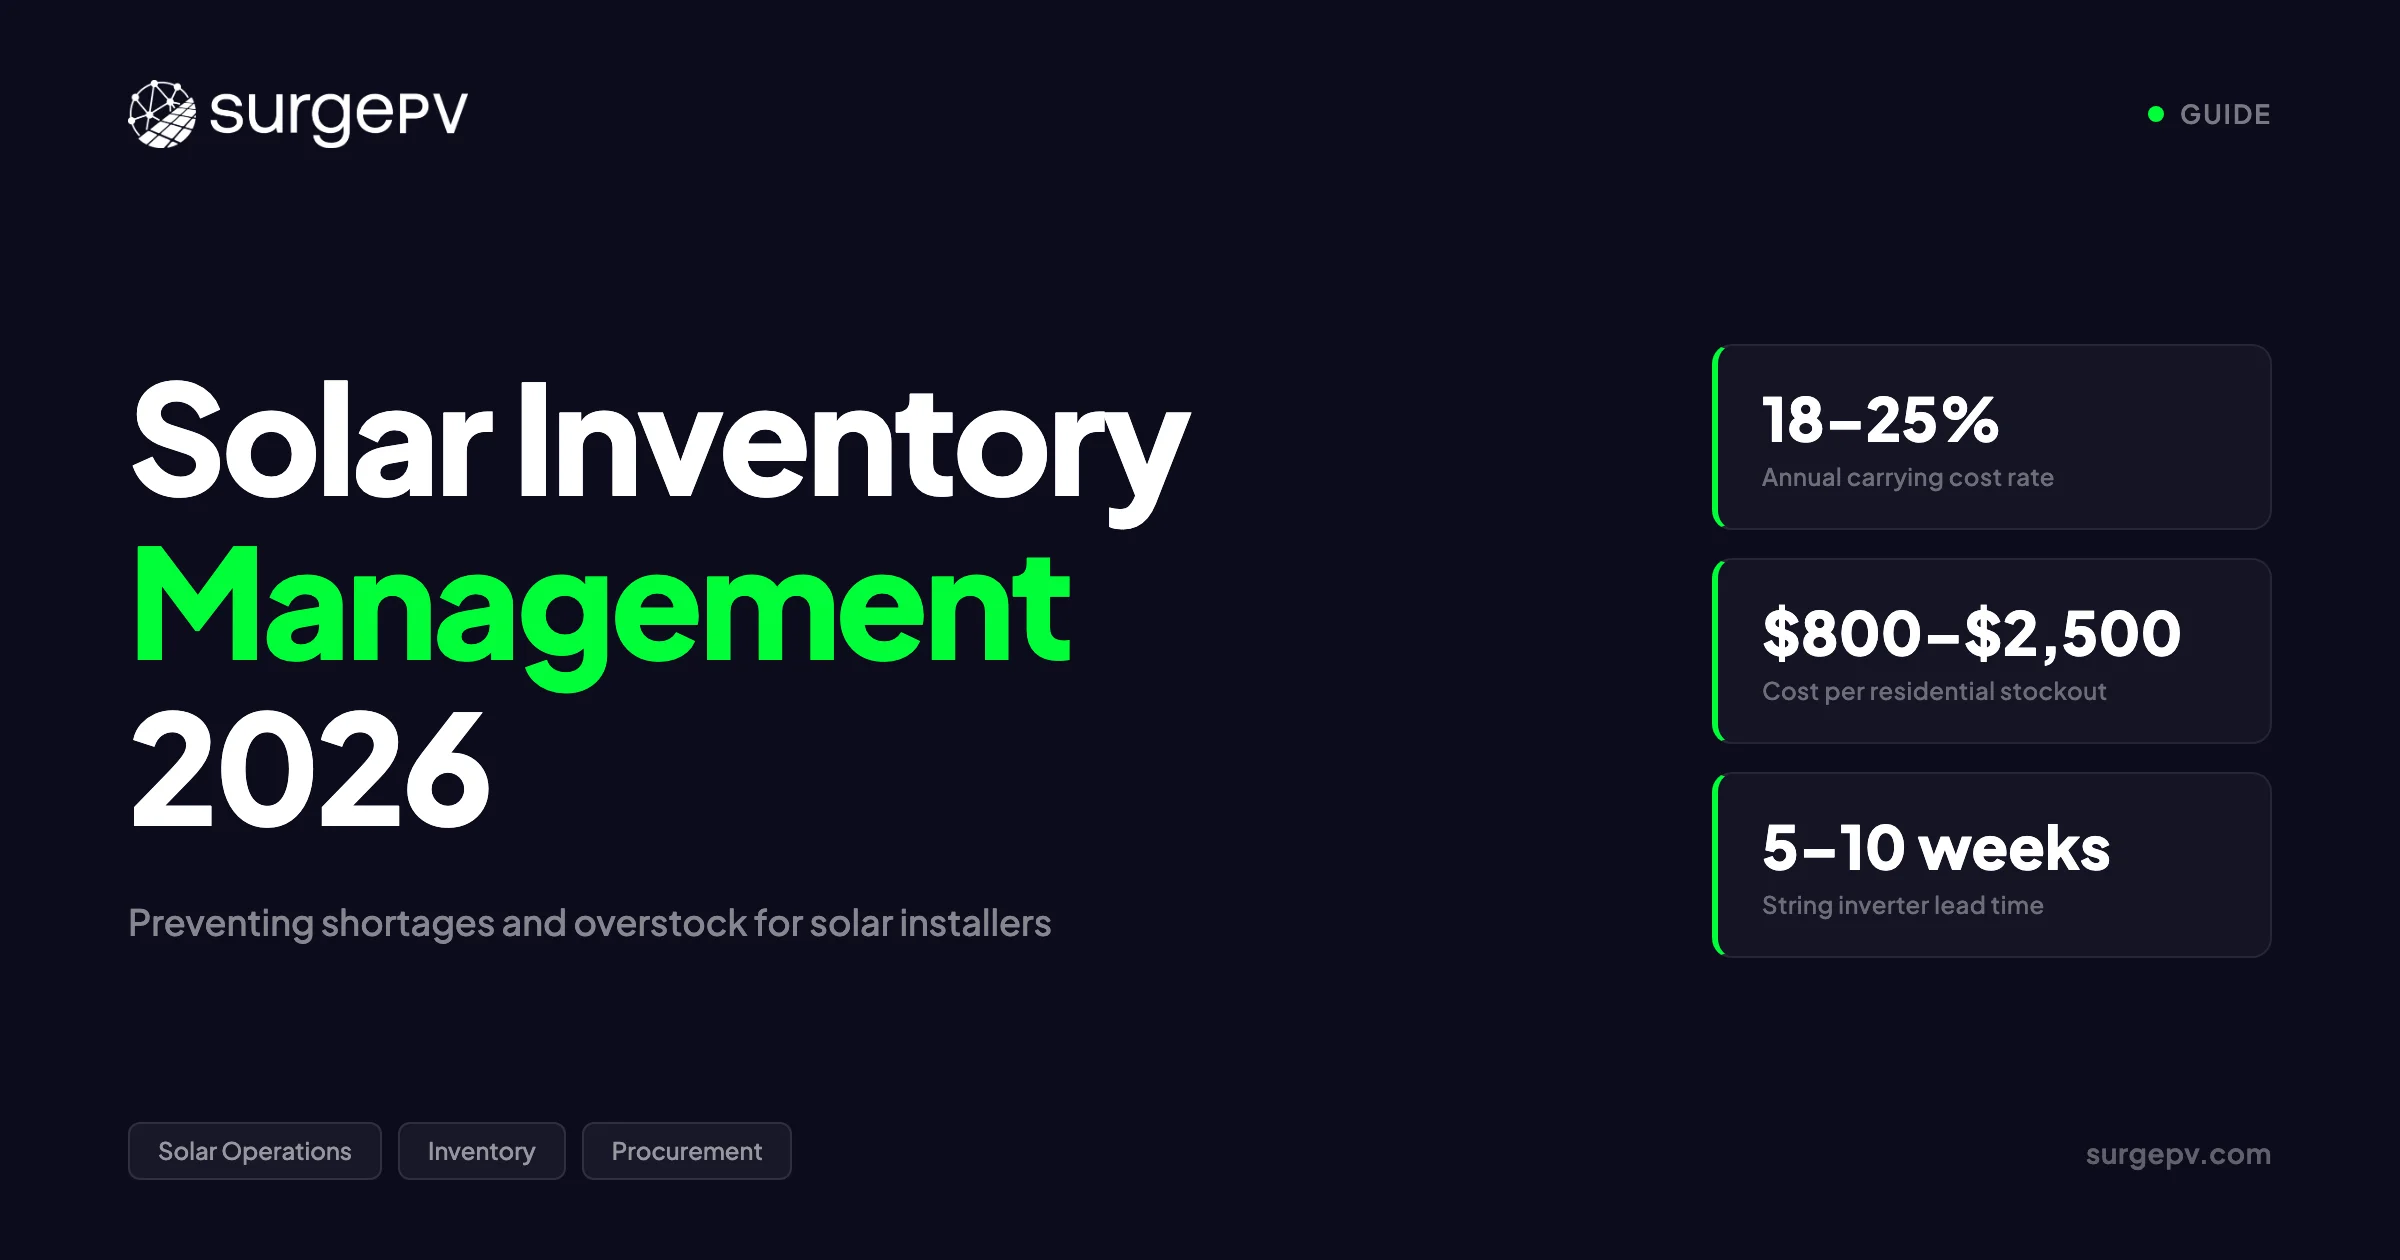
CFO Derek Okonkwo ran the numbers. At 22 percent annual carrying cost, the $340,000 stock cost $74,800 per year. Not a single panel had gone on a roof. Three projects had delayed in Q4 2024. The warehouse team could not locate the right inverter model in the pile. Two crews went home early when a BOM mismatch left the racking shipment short by 18 mid-clamps. The spreadsheet that “tracked” everything had not been updated since November. Read Solar Racking Design Guide for a complete walkthrough.
Okonkwo’s conclusion became a line I have heard from three other CFOs since: “We were running a solar installation business that had accidentally become a warehouse operation.”
This guide is for owners who recognize that story. Solar inventory management is not a procurement problem. It is a cash-flow, design-accuracy, and operational-discipline problem. In 2026, module prices have stabilized after a 40 percent decline. Inverter lead times still stretch to 10 weeks for some brands. Installer margins face pressure from $0.84 per watt customer acquisition costs. Getting inventory right is not optional. It is a survival skill.
Quick Answer
Keep 2 to 4 weeks of safety stock for items on over 60 percent of your BOMs. Order project-specific gear only after permit approval. Connect your design software BOM output directly to procurement. Target under 18 percent annual carrying cost and zero stockouts on committed install dates.
In this guide:
- Why solar inventory management differs from general construction procurement
- The true cost of carrying stock: a worked financial model
- The five inventory mistakes that cost installers real money
- Safety stock vs. just-in-time: how to choose by component
- Lead time reality for modules, inverters, racking, and BOS in 2026
- How accurate BOM generation from solar design software prevents over-ordering
- Inventory financing: supplier credit, distributor terms, and working capital
- A 90-day inventory cleanup plan for installers with warehouse bloat
- What the data says about industry inventory practices in 2026
- 9 frequently asked questions
Why Solar Inventory Management Is Different
Solar installation is not like general construction. In construction, you order concrete and steel to a fixed spec for a fixed site. In solar, you design a custom system for every roof. You generate a unique BOM for every project. Then you hope your warehouse has the right mix of 15 to 40 SKUs when the crew shows up.
The variability is the problem.
A typical residential solar BOM contains 25 to 40 line items. A commercial project can run to 80 or more. Every panel model, inverter size, racking configuration, and conduit gauge is a separate SKU. A plumber stocks three pipe sizes and two fitting types. A solar installer faces 8 module wattages, 6 inverter capacities, 4 racking systems, and a dozen electrical configurations. All of them change based on roof type, local code, and customer preference.
The Solar BOM Complexity Problem
The root of inventory chaos is the gap between design and procurement. A designer specifies 22x JA Solar 445W mono PERC panels. They add a Fronius Symo 8.2 kW inverter. They select IronRidge XR10 racking with FlashFoot2 attachments. They specify 150 feet of 10 AWG PV wire. That specification is precise.
But the procurement team orders from a spreadsheet that rounds quantities. The warehouse team stores panels by pallet rather than by model. The system that arrives on the truck is not the system that was designed.
Here is where the errors compound:
| Error Type | Cause | Typical Cost Impact |
|---|---|---|
| Over-ordering modules | Rounding up “to be safe” | $500–$2,000 per project in excess stock |
| Under-ordering racking | Manual count from PDF drawings | $200–$800 in emergency orders and crew downtime |
| Wrong inverter model | BOM not updated after design revision | $1,500–$4,000 in return freight and delay |
| Obsolete stock | Module model superseded mid-project | 15–30 percent write-down on unsold inventory |
| Phantom stock | Spreadsheet not updated after partial use | Double-orders, stockouts, and $300–$1,000 in rush shipping |
The common thread is manual handoffs. Every time a human re-enters a part number, a quantity, or a specification, the error probability rises. A solar design software that generates an accurate bill of materials and pushes it directly to procurement removes most of these failure points.
What Makes Solar Inventory Especially Hard in 2026
Three market conditions in 2026 make inventory management harder than it was three years ago.
Module oversupply creates decision paralysis. Global capacity sits above 1,100 GW. Prices hover near $0.085 per watt. Installers face a paradox: panels are cheap, but the choice between 15 similar models paralyzes procurement. The result is fragmented purchasing. Small lots from multiple distributors destroy volume discounts and complicate warehouse organization. For Global-specific compliance details, see Global net-metering-by-country. For Global-specific compliance details, see Global solar-permitting-speed-by-country.
Inverter lead times remain uneven. Modules ship in 2 to 5 weeks. String inverters from European brands like Fronius and SMA still run 5 to 10 weeks. Microinverters from Enphase have improved to 3 to 6 weeks but can spike during quarterly demand surges. A project scheduled around module availability can still stall for months waiting on the inverter. Also see: European Solar Incentives.
The residential ITC expiration shifted demand patterns. The Section 25D residential ITC expired December 31, 2025. The 2026 market is smaller and more price-sensitive. Installers who built inventory for a 2025 sales volume now sit on excess stock they cannot move.
Key Takeaway
Solar inventory is harder than general construction inventory because every project has a unique BOM with 25 to 40 SKUs. Component lead times vary by a factor of 5. Market conditions in 2026 punish both overstocking and stockouts. The fix is not better spreadsheets. It is connecting design output to procurement input with zero manual re-entry.
The True Cost of Carrying Inventory: A Worked Model
Most solar installers know their module cost per watt. Few know their inventory carrying cost per dollar of stock. That blind spot is expensive.
Carrying cost is the total annual expense of holding inventory before installation. It includes capital cost, warehouse space, insurance, handling, spoilage, and obsolescence. For a typical installer, carrying cost runs 18 to 25 percent of average inventory value per year.
The Carrying Cost Formula
Annual Carrying Cost = Average Inventory Value x (Cost of Capital % + Storage % + Insurance % + Obsolescence % + Handling %)Here is how the components break down for a mid-size residential installer:
| Cost Component | Rate | Explanation |
|---|---|---|
| Cost of capital | 8–12% | Opportunity cost of cash tied up in stock |
| Warehouse rent | 3–6% | Per-square-foot cost including utilities |
| Insurance | 1–2% | Property and inventory coverage |
| Obsolescence | 4–8% | Write-downs for superseded models and damaged goods |
| Handling and labor | 2–4% | Warehouse staff time, forklift, cycle counting |
| Total carrying cost | 18–32% | Most installers land at 20–25% |
A Real Example: Okonkwo’s Numbers
Let us apply this to SunPath Installers’ $340,000 stockpile:
| Line Item | Calculation | Annual Cost |
|---|---|---|
| Cost of capital (10%) | $340,000 x 0.10 | $34,000 |
| Warehouse rent ($4,200/mo) | $4,200 x 12 | $50,400 |
| Insurance ($680/mo) | $680 x 12 | $8,160 |
| Obsolescence (6%) | $340,000 x 0.06 | $20,400 |
| Handling labor (0.3 FTE at $22/hr) | $22 x 520 hrs | $11,440 |
| Total annual carrying cost | $124,400 |
That is 36.6 percent of inventory value. The benchmark is 18 to 25 percent. The culprit is warehouse rent. SunPath paid commercial-industrial rates in Phoenix for space they did not need. They had never right-sized their stock to their actual project flow.
The Hidden Cost: Stockouts
Carrying cost is visible. Stockout cost is often invisible — until you add it up. When a project delays because the right equipment is not in stock, the costs stack fast.
Crew rescheduling costs $400 to $800 per day for a 3-person crew. Permit extension fees run $150 to $500 depending on jurisdiction. Customer goodwill is hard to quantify but measurable in referral rate decline. Financing carry adds interest accrual during delay. Opportunity cost means the crew could have been on another job.
For a residential installer with a 3-person crew earning $180,000 per year fully loaded, a 3-day delay costs roughly $2,100 in direct labor. Add $400 to $800 in rescheduling overhead. Add financing carry on a $20,000 to $30,000 project. A single stockout per month adds $30,000 to $40,000 in annual cost. That is more than the salary of a procurement coordinator who could have prevented it.
Pro Tip
Calculate your true carrying cost once per quarter. Include warehouse rent, insurance, staff time, and a realistic obsolescence rate. If the total exceeds 25 percent of average inventory value, you have a warehouse problem, not a procurement problem. The fix is reducing SKU count and consolidating suppliers. It is not building a bigger warehouse.
The Five Inventory Mistakes That Cost Installers Money
After reviewing the inventory practices of 30+ solar installers across the US and Europe, five mistakes appear repeatedly. Each one has a specific dollar impact and a specific fix.
Mistake 1: Ordering Modules Before Permit Approval
This is the most expensive mistake in residential solar inventory. A designer sizes a 7.8 kW system with 18x 435W panels. The procurement team orders the panels immediately to “get ahead of lead times.” Two weeks later, the AHJ requires a setback revision. The system drops to 6.5 kW. Now the installer has 3 extra panels. Worse, they must return a partial pallet and pay restocking fees.
The fix: Order modules only after structural and electrical permits are approved. For items with long lead times, use a conditional purchase order with a cancellation clause. Most distributors will hold stock for 7 to 14 days with a small deposit.
Mistake 2: Treating All Components as Equally Available
Modules ship in 2 to 5 weeks. String inverters from Fronius, SMA, and Huawei run 5 to 10 weeks. Custom switchgear can take 12 to 16 weeks. Yet many installers place a single purchase order for the entire BOM. They assume everything arrives together.
The fix: Sequence procurement by lead time. Order long-lead items first. Then mid-lead. Then fast-moving stock. Build a simple lead-time matrix for your top 20 SKUs. Update it quarterly.
Mistake 3: Failing to Track Serial Numbers and Warranty Docs
Every solar panel and inverter has a serial number. Every manufacturer requires proof of purchase and serial number registration for warranty claims. Installers who unpack pallets and store modules loose lose this documentation. When a panel fails in year 8, the warranty claim is denied. The installer cannot prove the module came from an authorized distributor.
The fix: Scan serial numbers at receipt. Store warranty documentation in a cloud folder organized by project. Most distributors provide serial number lists with shipment. Import them directly into your project management system.
Mistake 4: Ignoring Minimum Order Quantities
Distributors impose MOQs — minimum order quantities — that force installers to buy more than a project needs. A 32 kWp residential job needs 72 panels. The distributor’s pallet size is 84. The installer buys 84, uses 72, and stores 12 “for the next job.” The next job uses a different panel model. The 12 spares sit for 18 months and become obsolete.
The fix: Negotiate split-pallet terms with your primary distributor. Many will split a pallet for a small fee ($50 to $150) if you have an ongoing relationship. Alternatively, consolidate orders across multiple projects to hit full-pallet quantities without excess.
Mistake 5: Using Spreadsheets Instead of Connected Systems
Excel is not an inventory system. It does not update in real time. It does not prevent double-entry. It does not alert you when stock drops below a reorder point. It does not connect to your design software. Every BOM becomes a manual typing exercise.
The fix: Move to a cloud inventory system. Even a basic tool like Zoho Inventory or Cin7 that integrates with your design platform works. The ROI is typically under 6 months from reduced over-ordering alone.
What Most Installers Get Wrong
Most installers think inventory management is about buying cheap. It is not. It is about buying the right amount at the right time. A 5 percent module discount on an over-order costs more than paying full price for the exact quantity you need. The math is simple: a $0.02 per watt discount on $50,000 of excess stock saves $1,000. Carrying that stock for 6 months at 20 percent annual cost costs $5,000. The “discount” is a $4,000 loss.
Safety Stock vs. Just-in-Time: Choosing by Component
There is no single right answer for every SKU. The correct strategy depends on demand predictability, lead time, and stockout impact.
The Decision Matrix
| Component | Demand Predictability | Lead Time | Stockout Impact | Recommended Strategy |
|---|---|---|---|---|
| Standard modules (400–450W mono PERC) | High (70%+ of projects) | 2–5 weeks | High | 3–4 weeks safety stock |
| String inverters (5–10 kW) | Medium (40–60% of projects) | 5–10 weeks | High | 2–3 weeks safety stock + forward orders |
| Microinverters | Medium | 3–6 weeks | High | 2 weeks safety stock |
| Racking hardware | High | 1–3 weeks | Medium | 2–3 weeks safety stock |
| DC cable (10 AWG, 12 AWG) | High | 1–2 weeks | Low | 1–2 weeks safety stock |
| Conduit and fittings | High | 1–2 weeks | Low | Just-in-time |
| Custom mounting (tile hooks, standing seam) | Low | 2–4 weeks | Medium | Just-in-time, order after permit |
| Monitoring equipment | Low | 3–6 weeks | Low | Just-in-time |
| Batteries | Low (growing but not universal) | 4–8 weeks | Medium | Just-in-time, order after contract |
| Transformers (commercial) | Very low | 12–16 weeks | Very high | Forward contract at project award |
The 60 Percent Rule
A simple heuristic: if a component appears on more than 60 percent of your projects, it belongs in safety stock. If it appears on fewer than 60 percent, order it just-in-time after contract signing or permit approval.
This rule works because high-frequency items have predictable consumption. You can calculate a reorder point with confidence. Low-frequency items are project-specific by nature. Holding them “just in case” is speculation, not inventory management.
Calculating Reorder Points
For safety stock items, the reorder point formula is:
Reorder Point = (Average Daily Usage x Lead Time in Days) + Safety Stock
``` Also see: [Us Residential Solar Market Trends 2026](/blog/us-residential-solar-market-trends-2026).

Example: Your installer uses an average of 12 Fronius 8.2 kW inverters per month. That is 0.4 per day. Lead time is 45 days. You want 14 days of safety stock.
Reorder Point = (0.4 x 45) + (0.4 x 14) = 18 + 5.6 = 23.6
When inverter stock drops below 24 units, place a replenishment order.

This calculation assumes steady demand. If your demand is seasonal — higher in spring, lower in winter — adjust the average daily usage to a rolling 90-day average. Do not use an annual average for seasonal businesses.

---

## Lead Time Reality: What to Expect in 2026

Inventory planning is only as good as your lead time assumptions. Here is the current state for major component categories as of Q2 2026.

### Solar Modules

Global module manufacturing capacity sits above 1,100 GW against roughly 650 GW of demand. The result is a buyer's market for standard specifications.

| Module Type | Standard Lead Time | Ex-Warehouse Availability | Notes |
|---|---|---|---|
| Tier-1 Chinese mono PERC (400–450W) | 2–4 weeks | Widely available | Spot prices $0.08–$0.11/W |
| Tier-1 Chinese TOPCon bifacial (410–460W) | 2–5 weeks | Good | Slight premium over PERC |
| EU-manufactured (Meyer Burger, REC) | 4–8 weeks | Limited | 40–60% price premium |
| HJT heterojunction | 3–6 weeks | Moderate | Niche applications |
| US-assembled (First Solar, Qcells) | 4–10 weeks | Moderate | Tariff-protected pricing |

The key insight: modules are not your constraint. Do not build large safety stocks of modules because you fear scarcity. Build safety stocks because you want to avoid the administrative cost of ordering modules for every project.

### Inverters

Inverters are the real bottleneck in 2026. Semiconductor supply chains have recovered from the 2021–2022 crisis. But certain brands and models remain constrained.

| Inverter Category | Standard Lead Time | Notes |
|---|---|---|
| String inverters — European brands (Fronius, SMA) | 5–10 weeks | Most constrained category |
| String inverters — Asian brands (Huawei, Sungrow) | 3–6 weeks | Better availability, lower cost |
| Microinverters (Enphase, APsystems) | 3–6 weeks | Improved from 2024 |
| Hybrid inverters (battery-ready) | 4–8 weeks | Growing demand, variable supply |
| Commercial central inverters (100 kW+) | 6–12 weeks | Project-specific, plan ahead |

<div class="callout callout-note">
<p class="callout-title">Key Takeaway — Inverter-First Procurement</p>
<p>Sequence every procurement plan around inverter lead times, not module lead times. A project with modules in stock and no inverter is a stalled project. A project with an inverter on order and no modules is a project that can be completed in 2 weeks. The sequencing matters more than the absolute lead time.</p>
</div>

### Racking and BOS

Racking and balance-of-system components have the shortest lead times. They also have the highest SKU variability. The challenge is not availability. It is accuracy.

| Component | Lead Time | Key Variable |
|---|---|---|
| Aluminum rail systems (IronRidge, Unirac) | 1–3 weeks | Length and color options |
| Roof attachments (flashings, tile hooks) | 1–4 weeks | Roof-type specificity |
| Ballasted systems (flat roof) | 2–5 weeks | Custom engineering for wind load |
| DC cable (10 AWG PV wire) | 1–2 weeks | Widely available |
| AC cable and conduit | 1–2 weeks | Electrical supply houses stock standard sizes |
| Disconnects and breakers | 2–4 weeks | Brand and amperage specific |
| Monitoring systems | 3–6 weeks | Often bundled with inverter |

---

## How Design Software Prevents Over-Ordering

The most powerful inventory improvement available to most installers is not a new warehouse. It is not a new procurement process. It is accurate BOM generation from design software.

### The Manual BOM Problem

A designer completes a system layout in a design tool. Then they export a PDF. A procurement coordinator opens the PDF. They count panels by hand. They measure wire runs with a ruler on the screen. They look up racking quantities from manufacturer tables. They type everything into a spreadsheet. This process takes 30 to 60 minutes per project. It produces errors on 15 to 25 percent of BOMs, according to installer surveys.

Common manual BOM errors:

- Panel count off by 1 to 3 units (roof edge adjustments missed)
- Wire length underestimated by 20 to 40 percent (routing not measured)
- Racking hardware undercounted by 10 to 15 percent (mid-clamp spacing miscalculated)
- Inverter size mismatched to final panel count (design revised, BOM not updated)
- Conduit gauge wrong for local code (default used instead of AHJ-specific)

Each error has a cost. An undercount means a rush order and crew downtime. An overcount means excess stock that sits in the warehouse. A mismatch means a return and re-order.

### Auto-BOM: From Design to Purchase Order

Auto-generated BOMs extract component quantities directly from the design file. When the designer places a panel, the software counts it. When the designer draws a wire run, the software measures it. When the designer selects a [racking system](/glossary/racking-system), the software calculates clamps, rails, and attachments from the manufacturer's engineering data.

The result is a BOM that is accurate to the component level. It generates in minutes rather than hours. It updates automatically when the design changes.

SurgePV's [auto-BOM generation](/glossary/auto-bom-generation) feature produces a complete component list from the design file. Change the panel model from JA Solar 435W to Trina 440W. Every dependent quantity updates: string sizing, inverter match, racking clamp count, and wire gauge. The procurement team receives a revised BOM without manual re-entry. Read [String Sizing Solar PV System](/blog/string-sizing-solar-pv-system) for a complete walkthrough. For a direct comparison, see [Arka 360 vs SurgePV](/compare/arka360-vs-surgepv).

### The ROI of Design-Driven Procurement

For an installer doing 100 residential projects per year:

| Metric | Manual BOM | Auto-BOM | Annual Savings |
|---|---|---|---|
| Time per BOM | 45 minutes | 5 minutes | 66 hours |
| Error rate | 20% | under 5% | 15 fewer errors per year |
| Average error cost | $400 | $50 | $5,250 |
| Designer hourly cost | $45 | $45 | $2,970 |
| **Total annual savings** | | | **$8,220** |

That is a conservative estimate. The real savings come from avoided stockouts, reduced excess inventory, and faster project turnaround. All of these compound over time.

<div class="callout callout-tip">
<p class="callout-title">Pro Tip</p>
<p>If your design software exports a CSV or Excel BOM, import it directly into your inventory system rather than retyping. Even a simple copy-paste workflow cuts error rates by 60 to 70 percent compared to manual entry from a PDF. The goal is zero re-entry between design and procurement.</p>
</div>

---

## Inventory Financing: Managing Working Capital

Inventory ties up cash. For a growing installer, the working capital in stock can be the difference between taking on a new project and turning it down.

### Supplier Credit and Distributor Terms

Most solar distributors offer payment terms from net-15 to net-60. The best terms go to installers with established credit history and consistent order volume.

| Distributor Type | Typical Terms | Requirements |
|---|---|---|
| National distributor (CED Greentech, Rexel) | Net-30 to Net-45 | Credit application, trade references |
| Regional distributor | Net-15 to Net-30 | Often more flexible for local installers |
| Manufacturer direct (large volume) | Net-60 to Net-90 | $500K+ annual volume, letter of credit |
| Online / spot market | Prepay or credit card | No credit check, immediate payment |

The goal is to match payment terms to project cash flow. If your customer pays a 30 percent deposit at contract signing and 70 percent at commissioning, and your distributor offers net-30 terms, you can theoretically fund inventory from customer deposits. You would not need your own working capital.

In practice, the timing rarely lines up perfectly. Permits take 2 to 8 weeks. Equipment lead times add 2 to 10 weeks. The deposit may sit in your account for a month before you place the order. The key is to negotiate terms that cover the gap between deposit receipt and customer final payment.

### Inventory Finance Facilities

For installers with $500,000+ in annual equipment purchases, an inventory finance facility from a specialty lender can extend payment terms to 90 to 120 days. The lender pays the distributor at invoice date. The installer repays the lender after project completion.

Typical terms:

- Interest rate: 8 to 14 percent annualized
- Facility size: $100,000 to $2,000,000
- Advance rate: 70 to 85 percent of inventory value
- Repayment: Linked to project milestones or customer payments

The math works when the cost of finance is less than the margin gained from faster project turnover. At 12 percent annual interest on a 60-day facility, the cost is 2 percent of inventory value. If that inventory turns into a completed project with 25 percent gross margin in 60 days instead of 90 days, the 2 percent finance cost is covered by the faster cash conversion.

### The Cash Conversion Cycle

The cash conversion cycle (CCC) measures how long it takes to turn cash into inventory, inventory into a completed project, and a completed project back into cash.
CCC = Days Inventory Outstanding + Days Sales Outstanding - Days Payable Outstanding
For a typical residential installer:

- Days Inventory Outstanding: 14 to 35 days (time from order to install)
- Days Sales Outstanding: 7 to 21 days (time from install to customer payment)
- Days Payable Outstanding: 15 to 45 days (time from invoice to distributor payment)

A negative CCC — where you collect from customers before you pay suppliers — is the gold standard. It means your customers fund your inventory. Achieving this requires tight coordination between sales, design, procurement, and project scheduling.

<div class="inline-cta">
<h3>Cut Design Time from Hours to Minutes</h3>
<p>SurgePV generates accurate BOMs automatically from your system design. No more manual counting. No more spreadsheet errors. Just precise component lists pushed straight to procurement.</p>
<a href="/demo" class="cta-btn">Book a Demo <svg class="cta-arrow" width="16" height="16" viewBox="0 0 24 24" fill="none" stroke="currentColor" stroke-width="1.5" stroke-linecap="round" stroke-linejoin="round"><circle cx="12" cy="12" r="10"/><path d="M8 12h8"/><path d="M12 8l4 4-4 4"/></svg></a>
<p class="cta-sub">No commitment required · 20 minutes · Live project walkthrough</p>
</div>

---

## The Tradeoff: Bulk Discounts vs. Carrying Cost

Every distributor offers volume discounts. Buy a full pallet — usually 30 to 36 panels — and save 3 to 8 percent per watt. Buy a full container — 500 to 700 panels — and save 10 to 15 percent. The discount is real. But so is the cost of holding that inventory.

### When Bulk Buying Pays Off

Bulk buying makes sense when three conditions are met:

1. **Predictable consumption:** You know you will use the stock within 60 to 90 days
2. **Stable pricing:** The component price is not falling faster than your carrying cost
3. **Adequate storage:** You have space that does not require additional rent

Example: An installer doing 20 residential projects per month uses an average of 400 panels. A full pallet of 36 panels lasts 2.5 days. Buying a 20-pallet container (720 panels) provides 36 days of stock. At a 12 percent discount on $0.10 per watt panels, the savings on $72,000 of panels is $8,640. Carrying cost at 20 percent annualized for 36 days is $1,440. Net savings: $7,200. The bulk buy pays off.

### When Bulk Buying Loses Money

Bulk buying loses money when consumption is uncertain, prices are falling, or storage is expensive.

Example: An installer doing 5 projects per month buys a 20-pallet container to get the discount. Consumption is 100 panels per month. The container lasts 7 months. During those 7 months, module prices fall another 8 percent. The "discount" is erased by price decline. Carrying cost for 7 months at 20 percent annualized is $8,400. The installer loses money on a deal that looked good on paper.

### The Contrarian View: Small Can Be Better

Most industry advice pushes installers to consolidate purchasing for volume discounts. That advice assumes stable demand and stable prices. In 2026, neither assumption holds. Demand is contracting in residential solar. Prices have been volatile for three years. The installer who buys exactly what they need, exactly when they need it, often outperforms the installer who chases bulk discounts.

The math is straightforward. A 5 percent volume discount on $100,000 of inventory saves $5,000. Carrying that inventory for 6 months at 22 percent carrying cost costs $11,000. The "savvy" bulk buyer loses $6,000.

For [commercial solar](/commercial-solar) EPCs with multi-month project pipelines and predictable BOMs, bulk buying still works. For residential installers in a contracting market, just-in-time procurement with minimal safety stock is often the higher-ROI strategy.

---

## A 90-Day Inventory Cleanup Plan

If your warehouse looks like SunPath's did — excess stock, mixed models, outdated tracking — here is a 90-day plan to fix it.

### Days 1–30: Audit and Classify

1. **Physical count:** Count every item in the warehouse. Compare to your spreadsheet or system. Mark discrepancies.
2. **ABC classification:** Sort every SKU by annual dollar usage.
   - A items: Top 20% of SKUs by value (typically 70–80% of total inventory value)
   - B items: Next 30% of SKUs (15–20% of value)
   - C items: Bottom 50% of SKUs (5–10% of value)
3. **Age analysis:** Identify stock older than 90 days. Flag anything older than 180 days for immediate action.
4. **Obsolete identification:** Mark superseded models, damaged goods, and project-specific items from cancelled jobs.

### Days 31–60: Liquidate and Restructure

1. **Sell obsolete stock:** List excess modules on secondary marketplaces or offer them to other installers at cost. A 20 percent loss on obsolete stock is better than a 100 percent write-off.
2. **Return unopened stock:** Many distributors accept returns within 90 days with a restocking fee of 10 to 20 percent. Pay the fee and get the cash back.
3. **Consolidate suppliers:** Reduce your active distributor relationships to 2 to 3 primary partners. Fewer suppliers means better terms, simpler tracking, and fewer MOQ problems.
4. **Right-size safety stock:** Set reorder points for A items only. Move B and C items to just-in-time.

### Days 61–90: Systematize

1. **Implement cycle counting:** Count A items weekly, B items monthly, C items quarterly. Never do a full physical count again.
2. **Connect design to procurement:** Export BOMs directly from [solar design software](/solar-designing) to your inventory system. Eliminate manual re-entry.
3. **Set reorder triggers:** Automated alerts when A-item stock hits reorder point.
4. **Review carrying cost quarterly:** Track the metric. Target under 20 percent.

### Expected Outcomes

| Metric | Before Cleanup | After 90 Days | Improvement |
|---|---|---|---|
| Average inventory value | $340,000 | $120,000 | 65% reduction |
| Annual carrying cost | $74,800 | $26,400 | $48,400 saved |
| Stockout frequency | 2 per month | 0 per month | Eliminated |
| BOM error rate | 20% | under 5% | 75% reduction |
| Warehouse space needed | 3,500 sq ft | 1,200 sq ft | 66% reduction |

---

## What the Data Says: Industry Inventory Practices in 2026

There is no comprehensive survey of solar installer inventory practices. But we can assemble a picture from distributor interviews, installer case studies, and financial filings of public EPCs.

### Inventory Turnover Benchmarks

Inventory turnover measures how many times per year you sell through your entire stock. Higher is better.

| Business Type | Typical Turnover | Target Turnover |
|---|---|---|
| Residential installer (50–150 projects/year) | 6–10x | 12–15x |
| Residential installer (150–500 projects/year) | 8–12x | 15–20x |
| Commercial EPC | 4–8x | 8–12x |
| Utility-scale EPC | 2–4x | 4–6x |

A residential installer with $200,000 average inventory and $2.4M annual equipment cost has a turnover of 12x. That is healthy. The same installer with $400,000 average inventory has a turnover of 6x. That is a warning sign.

### Working Capital Intensity

Working capital intensity measures inventory and receivables as a percentage of revenue. Lower is better.

| Segment | Working Capital / Revenue | Notes |
|---|---|---|
| Top-quartile residential | 8–12% | Fast inventory turns, net-30 customer terms |
| Median residential | 15–22% | Average inventory management, mixed terms |
| Bottom-quartile residential | 25–40% | Excess stock, slow receivables, poor procurement |
| Commercial EPC | 12–20% | Longer project cycles, larger per-project inventory |

The gap between top and bottom quartile is not explained by business size. It is explained by procurement discipline, design-to-procurement integration, and payment term management. Installers who use [solar proposal software](/solar-proposals) to close deals faster also convert inventory to revenue faster. The connection is direct.

---

## The Industry Misconception: "More Stock Means Better Service"

The most persistent myth in solar inventory management is that a full warehouse signals operational health. The opposite is usually true. A full warehouse signals capital misallocation, slow turnover, and hidden obsolescence risk.

Customers do not care what is in your warehouse. Customers care whether their project installs on schedule. On-schedule delivery comes from accurate forecasting, reliable supplier relationships, and tight design-to-procurement workflows. It does not come from hoarding panels.

The installers with the highest customer satisfaction scores in NPS surveys are not the ones with the biggest warehouses. They are the ones with the most predictable delivery timelines. A two-week delivery promise that is met every time beats a "we have everything in stock" claim that turns out to be half true.

This misconception costs the industry millions in wasted carrying cost every year. The installer who believes it is the installer who ends up like SunPath — with $340,000 of stock, $74,800 in annual carrying cost, and a spreadsheet that has not been updated since November.

---

## Frequently Asked Questions

### What is solar inventory management for installers?

Solar inventory management is the process of tracking, ordering, storing, and deploying equipment. It covers modules, inverters, racking, wiring, and BOS components. The goal is simple: every project has what it needs when crews arrive, without tying up excessive capital in warehouse stock.

### How much inventory should a solar installer keep on hand?

A residential installer doing 50 to 150 systems per year should keep 2 to 4 weeks of fast-moving items. Standard modules, common inverter sizes, and universal racking belong in safety stock. Order project-specific items only after contract signing. Commercial EPCs can justify 4 to 8 weeks of safety stock for long-lead items like transformers.

### What are the biggest inventory mistakes solar installers make?

The five most common mistakes are: ordering modules before permit approval; treating all components with the same lead-time assumption; failing to track serial numbers and warranty documentation; ignoring minimum order quantities from distributors; and using spreadsheets instead of connected inventory software.

### How do you calculate inventory carrying cost for a solar business?

Annual carrying cost equals capital cost plus warehouse space, insurance, spoilage, and obsolescence. For most solar installers, carrying cost runs 18 to 25 percent of inventory value per year. On $200,000 of warehouse stock, that is $36,000 to $50,000 in annual cost.

### Should solar installers use just-in-time or keep safety stock?

Most installers need a hybrid approach. Use just-in-time ordering for project-specific items after permits are approved. Keep safety stock for fast-moving, standardized items that appear on most BOMs. The rule is simple: if an item appears on more than 60 percent of your projects, it belongs in safety stock.

### What software do solar installers use for inventory management?

Small installers often start with QuickBooks Commerce or Zoho Inventory. Mid-size firms move to Cin7 or Fishbowl. Enterprise EPCs use SAP or Oracle NetSuite. The critical integration is between your design software and your inventory system.

### How do module price volatility and trade policy affect inventory strategy?

Module prices fell 40 percent between 2023 and 2025, which punished installers who bought forward. In 2026, prices have stabilized near $0.085 per watt ex-China. The safest strategy is to hold 2 to 4 weeks of stock and use forward contracts with price-adjustment clauses.

### What is the financial impact of a stockout on a solar installation project?

A single stockout on a residential project typically costs $800 to $2,500 in direct delay costs. On a commercial project, the cost scales to $5,000 to $15,000 per week of delay. The hidden cost is reputation. Delayed projects kill referral rates.

### How can solar design software improve inventory management?

Accurate design software generates precise BOMs with exact quantities and part numbers. When the design platform connects to inventory software, the BOM becomes the purchase order automatically. This eliminates manual counting errors that cause over-ordering and stockouts.

---

## Conclusion: Three Actions for This Quarter

Solar inventory management is not about buying the cheapest panels. It is not about building the biggest warehouse. It is about matching equipment flow to project flow with minimum capital tied up and zero stockouts on committed dates.

If you take three actions from this guide, make them these:

1. **Calculate your true carrying cost this week.** Add up warehouse rent, insurance, capital cost, and obsolescence. If the total exceeds 25 percent of inventory value, you have a cleanup project. Start the 90-day plan.

2. **Connect your design BOM to procurement.** Whether you use SurgePV's auto-BOM or export a CSV from your current design tool, eliminate the manual re-entry step between design output and purchase order. The error reduction alone pays for the integration effort.

3. **Sequence procurement by lead time, not by BOM order.** Order inverters and long-lead items first. Order modules second. Order racking and BOS last. A project with an inverter on order and no modules is two weeks from completion. A project with modules in stock and no inverter is two months from a frustrated customer.

The installers who survive the 2026 residential contraction are not the ones with the deepest inventory. They are the ones who turn working capital fastest, deliver on schedule every time, and never let a stockout delay a crew. Get the inventory right, and the margin follows.


