Quick Answer
Solar installer salaries by country in 2026: US $40,000–$70,000, Germany €35,000–€55,000, UK £28,000–£45,000, Australia AU$55,000–$85,000, India ₹300,000–₹600,000. NABCEP certification increases US earnings by 15–30%. Solar installer demand is projected to grow 50% globally by 2030.
Solar installer salaries vary by a factor of 15 between the highest and lowest-paying countries. A senior solar PV installer in Germany earns roughly $74,000 per year; in India, an experienced installer earns closer to $6,500. These numbers reflect not just labor market differences but also the maturity of local solar industries, certification requirements, and policy environments that drive installer demand. Also see: Germany solar subsidies. Also see: Best Solar Design Software India.
Solar installer salaries by country in 2026: US $40,000–$70,000, Germany €35,000–€55,000, UK £28,000–£45,000, Australia AU$55,000–$85,000, India ₹300,000–₹600,000. NABCEP certification increases US earnings by 15–30%. Solar installer demand is projected to grow 50% globally by 2030. For the latest details on India, see 5kW Solar Panel Price in India. See our guide on Battery Solar System Design UK for more.
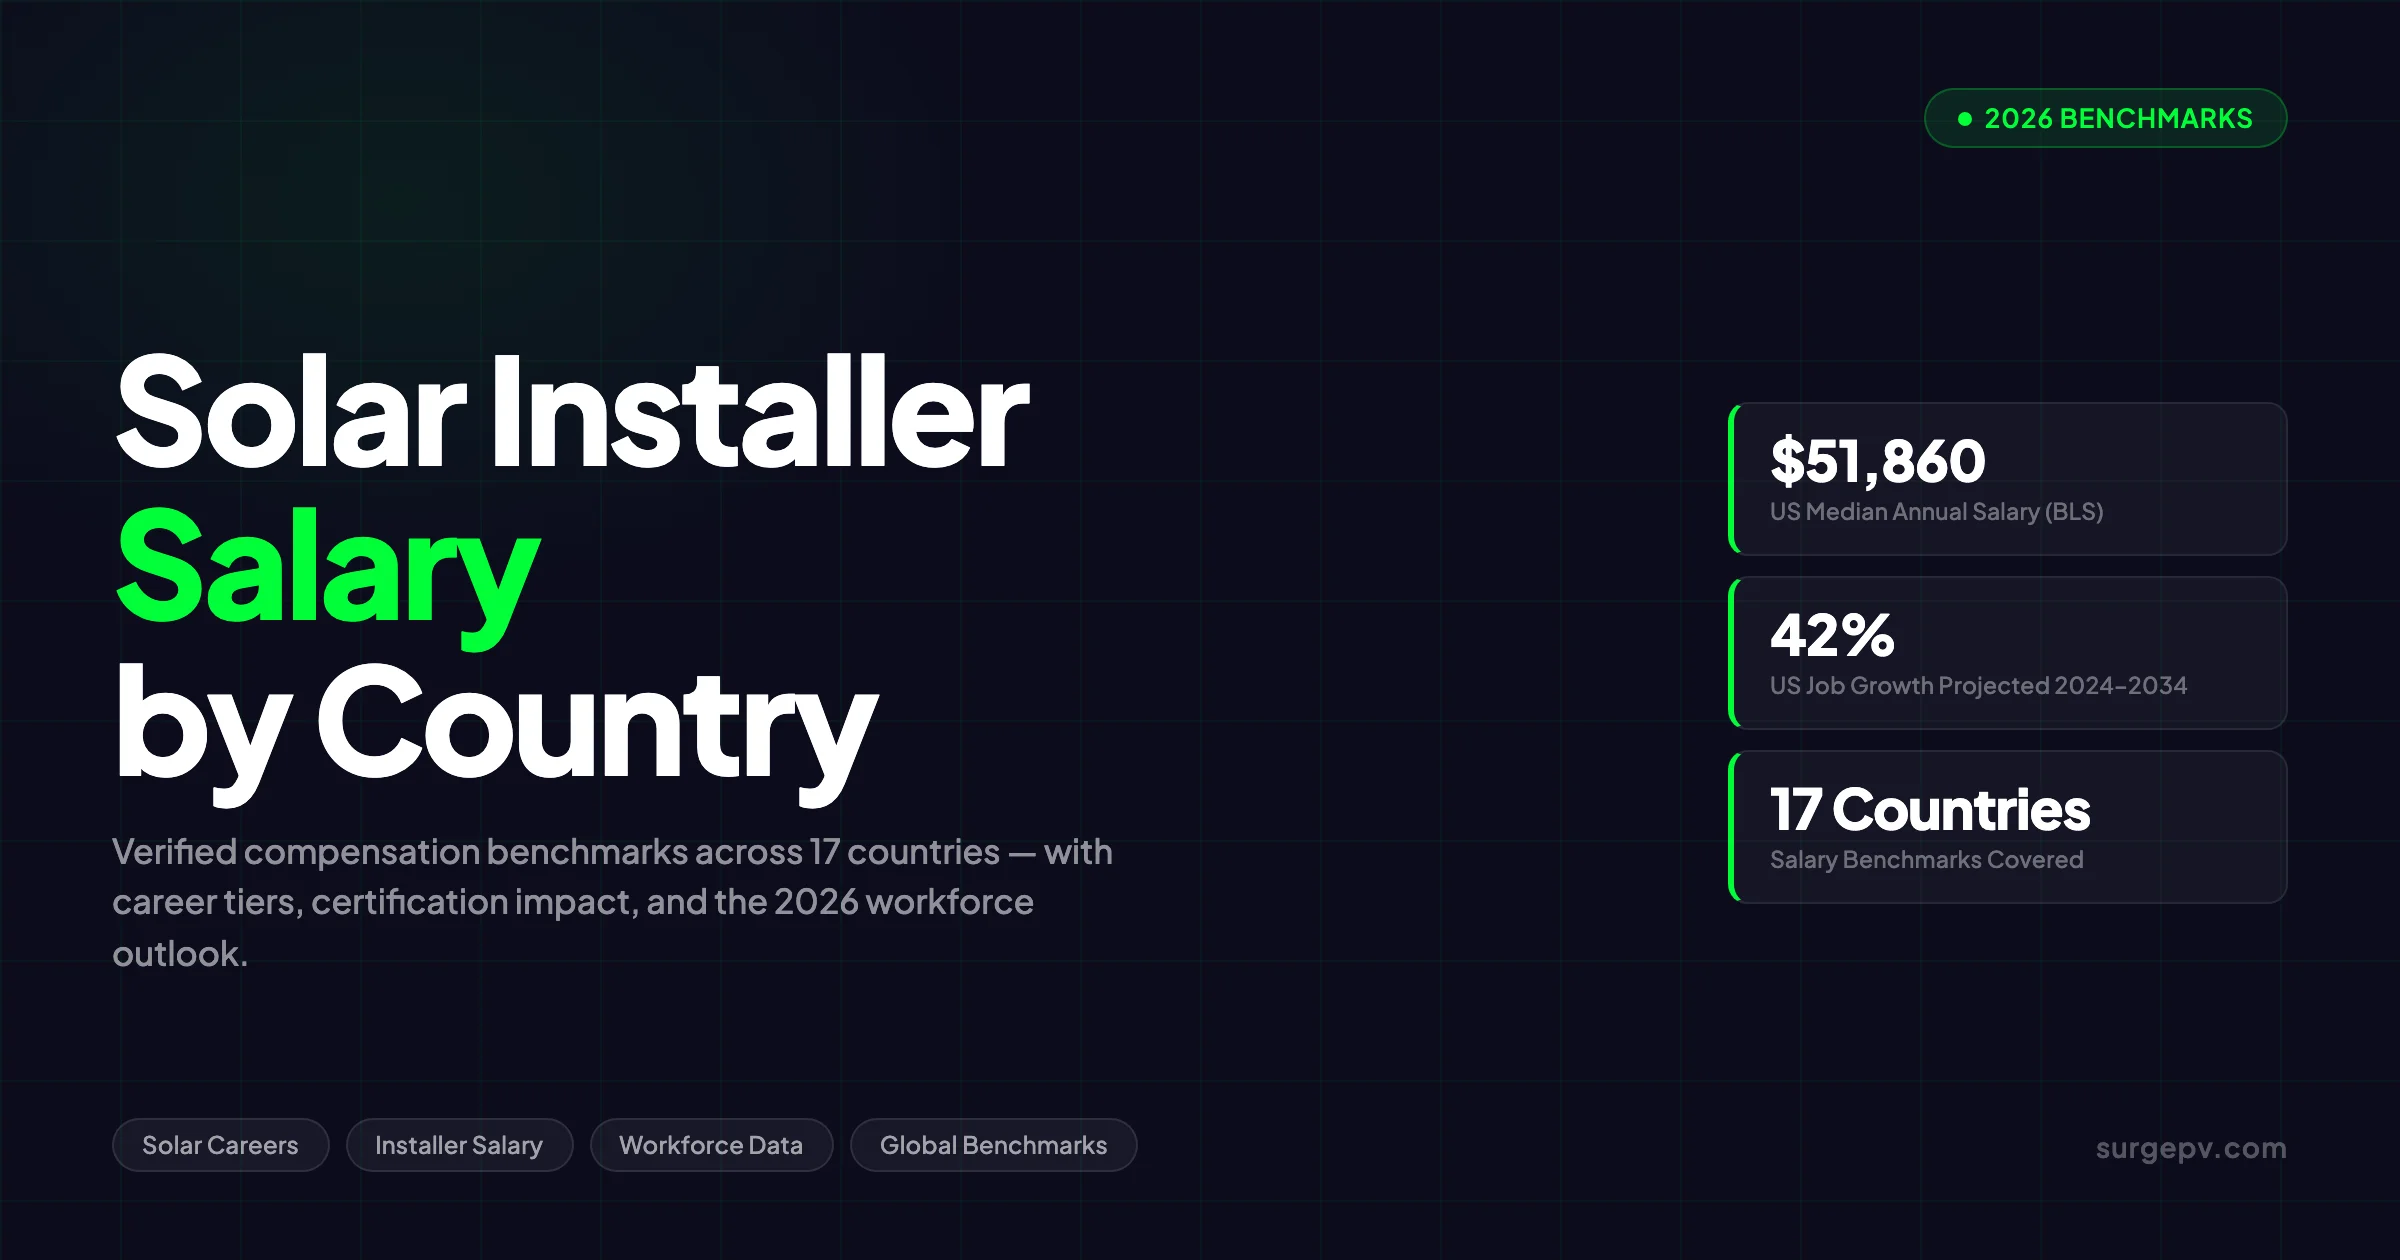
This guide covers verified compensation data across 17 countries, US state-by-state breakdowns, career progression tiers, certification impact, and the 2026 workforce outlook — including the 53,000-worker gap now threatening deployment targets.
TL;DR — Solar Installer Salaries in 2026
US median: $51,860/yr (BLS). Germany: ~$60,500. Australia: ~$55,000–$65,000. UK: ~$49,000–$52,000. India: ~$4,000. NABCEP certification adds $11,000/yr in the US. Solar installation is the fastest-growing occupation in the US economy at 42% projected growth through 2034 — but a 53,000-worker shortage is shaping every salary negotiation in 2026.
Global Solar Installer Salary Snapshot
IRENA’s 2024 Renewable Energy and Jobs report counts 7.1 million solar PV jobs globally — 44% of all renewable energy employment worldwide. That workforce doubled in size between 2019 and 2023, and it is still growing. The countries adding solar capacity fastest are the countries where installer demand — and salaries — are rising most sharply.
The table below shows average annual solar installer compensation in USD terms across the major markets. All figures are converted from local currency at 2025 average exchange rates. Use them for comparison purposes; actual take-home pay depends heavily on local purchasing power. For France-specific information, see Agricultural Solar Case Study.
| Country | Avg Annual (USD) | Entry-Level (USD) | Senior (USD) | Primary Source |
|---|---|---|---|---|
| Germany | $60,500 | $44,000 | $74,000 | SalaryExpert / ERI |
| Australia | $55,000–$65,000 | $35,000 | $70,000+ | Indeed AU / Glassdoor AU |
| USA | $51,860 | $35,000–$42,000 | $65,000–$95,000 | BLS (May 2024) |
| France | $52,800 | $38,000 | $64,000 | ERI |
| Japan | $52,400 | $38,000 | $63,000 | ERI |
| Canada | $47,500 | $38,000 | $64,000 | SalaryExpert |
| UK | $49,000–$52,000 | $23,000 | $63,000 | Indeed UK / Glassdoor UK |
| Italy | $45,100 | $32,000 | $54,000 | ERI |
| UAE | $41,400–$47,700 | $20,000 | $66,000 | ERI / WorldSalaries |
| Netherlands | $37,400 | $21,000 | $42,000 | SalaryExpert |
| South Korea | $36,500 | $26,000 | $44,000 | ERI |
| Czech Republic | $28,600 | $20,800 | $35,100 | SalaryExpert |
| Poland | $25,000 | — | — | SalaryExpert |
| Spain | $24,000–$43,000 | $11,000 | $30,000 | WorldSalaries / SalaryExpert |
| South Africa | $19,500 | $8,000 | $25,000 | SalaryExpert |
| Brazil | $13,600 | $10,000 | $15,600 | SalaryExpert |
| India | $4,000–$4,200 | $2,500 | $6,500 | Indeed India |
The gap between Germany and India reflects the reality that solar installation is a trade, and trade wages track the overall labor market. A solar installer in Germany earns roughly what any skilled tradesperson earns there. The same is true in India. What makes solar interesting as a career choice is the trajectory: in almost every country on this list, solar installer wages have risen faster than inflation over the past three years as new capacity additions outpace trained workforce supply.
United States: Solar Installer Salary by State and Experience Level
The US Bureau of Labor Statistics reports a median annual wage of $51,860 for solar PV installers (May 2024). That figure masks a wide range driven by state-level policy environments, unionization rates, and the mix of residential versus commercial work.
Salary by Experience Tier (US)
| Experience Level | Annual Salary | Hourly Rate |
|---|---|---|
| Helper / Laborer | $30,000–$35,000 | $14–$17 |
| Entry-level (0–2 yrs) | $35,000–$42,000 | $16.89 |
| Early career (2–4 yrs) | $39,145 | $18.82 |
| Mid-career (4–8 yrs) | $48,403 | $22.79 |
| BLS median (all levels) | $51,860 | $24.93 |
| Senior (8+ yrs) | $61,318–$95,000 | $29.48–$45.67 |
| Top 10% | $72,080–$130,000 | $34.65+ |
Salary by US State
State-level variation is significant. Rhode Island pays solar installers nearly double the national median, driven by high union density and a strong residential mandate. Southern states trend toward the lower end.
| State | Annual Salary | Hourly Rate |
|---|---|---|
| Rhode Island | $103,875 | $49.94 |
| Nevada | $66,104 | $31.78 |
| New Jersey | $64,667 | $31.09 |
| Vermont | $64,230 | $30.88 |
| Hawaii | $56,920–$57,930 | $27–$30 |
| California | $55,000–$72,000 | $26–$35 |
| New York | $50,000–$65,000 | $24–$31 |
| Massachusetts | $53,180–$60,800 | $25–$29 |
| Oregon | $58,180 | $27.97 |
| Texas | $46,000–$62,000 | $22–$30 |
| Florida | $46,000–$62,000 | $22–$30 |
| Arizona | $51,840 | $24.92 |
| Tennessee | $31,740 | $15.26 |
California’s range is wide because it spans rural residential work at $55,000 and utility-scale project roles in the Central Valley or Mojave at $72,000+. San Francisco metro commercial roles can push past $80,000 for crew leads.
Salary by Solar Sector (US)
The type of installation matters more than most installers realize when they first enter the trade.
| Sector | Average Annual Salary |
|---|---|
| Residential solar | $52,000 |
| Commercial & industrial | $68,000 |
| Utility-scale / ground-mount | $78,000–$90,000+ |
| Operations & maintenance | $60,000 |
| Solar project management | $75,000–$134,500 |
Moving from residential to commercial work typically adds $15,000–$20,000 per year. Utility-scale roles often include per-diem travel pay on top of salary, which closes the gap with California commercial work for installers willing to move project to project.
Companies that use solar design software for project preparation tend to run tighter project timelines, which increases crew utilization and makes it easier to justify above-median pay packages when competing for experienced installers.
Pro Tip
If you are benchmarking salaries for a new hire, check the BLS Occupational Employment and Wage Statistics (OEWS) data for your specific state before making an offer. State-level data is published annually and is more accurate than job-site aggregators for setting competitive base pay.
Europe: Country-by-Country Breakdown
European solar installer salaries follow a clear north-south gradient: Germany and France pay substantially more than Spain and Italy. The difference is not solar market maturity — Spain and Italy both have large installation volumes — but rather the underlying trade wage structure in each country. Also see: European Solar Incentives.
Germany
Germany’s solar installer market is one of the most institutionalized in Europe. Wages are governed by union tariff agreements under the ZVEH (Central Association of German Electrical and Information Engineering Trades).
| Experience Level | Annual Salary (EUR) | USD Equivalent |
|---|---|---|
| Entry (1–3 yrs) | €39,940 | $43,900 |
| Average | €54,910 | $60,400 |
| Senior (8+ yrs) | €67,368 | $74,100 |
Hourly tariff rates under the 2025 ZVEH agreement range from €15.50/hr for unskilled helpers to €22–€28/hr for qualified solar electricians (Elektrotechniker). The market for qualified solar staff has tightened significantly: average pay rose roughly 9% between 2023 and 2025 as installation volumes outpaced the supply of trained technicians.
Germany currently employs over 65,000 people in solar-specific roles. For the workforce context behind these numbers, see the detailed breakdown in solar installer jobs in Germany.
United Kingdom
The UK solar installer market splits between employed installers (typically working for regional contractors) and self-employed sole traders or limited company directors. The earnings gap between these two groups is material.
| Role / Status | Annual Salary (GBP) | USD Equivalent |
|---|---|---|
| Entry / newly qualified | £18,000–£25,000 | $22,800–$31,700 |
| Mid-career | £25,000–£35,000 | $31,700–$44,300 |
| Experienced installer | £45,000–£58,000 | $57,000–$73,400 |
| Lead solar installer | £33,753 | $42,700 |
| Self-employed sole trader | £56,052 | $70,900 |
| Self-employed limited company | £52,806 | $66,800 |
| Day rate (self-employed) | ~£475/day | $601/day |
MCS (Microgeneration Certification Scheme) accreditation is required to work on grid-tied residential systems in the UK. Accredited installers earn significantly more than unaccredited workers. For the certification pathway and its impact on earnings, see MCS certification for solar installers in the UK.
The self-employed premium is the most striking figure in UK data. A sole trader solar installer earning £56,052 per year takes home roughly 40% more than an employed installer at the same experience level. That gap drives a high proportion of experienced UK installers to go independent once they have their client base established.
France
France pays solar installers near the European average but above the median for EU countries as a whole.
| Experience Level | Annual Salary (EUR) | USD Equivalent |
|---|---|---|
| Entry | ~€34,000 | $37,400 |
| Average (Paris-weighted) | €48,148 | $52,960 |
| Senior | ~€58,000 | $63,800 |
The Paris-centric ERI data likely overstates the national average by 5–10%. Regional France — particularly the south, where solar capacity is highest — tends to pay closer to €38,000–€42,000 for mid-career roles. France added nearly 10 GW of solar capacity in 2024, which has tightened the installer labor market in the Occitanie and Provence-Alpes-Côte d’Azur regions specifically.
Italy
Italy’s solar boom, driven by the Superbonus and subsequent incentive programs, significantly increased demand for installers from 2020 onward. Wages have risen but remain below Germany and France.
| Experience Level | Annual Salary (EUR) | USD Equivalent |
|---|---|---|
| Entry | €29,000 | $31,900 |
| Average | €41,048 | $45,200 |
| Senior | €49,504 | $54,500 |
Italy’s 40,000+ solar jobs are concentrated in the north (Lombardy, Veneto) and the incentive-driven residential retrofit market. For context on Italy’s ongoing incentive environment, the Italy Superbonus solar guide covers how policy changes have reshaped installer workloads and project economics.
Spain
Spain has one of Europe’s largest solar industries by installed capacity, but installer wages remain lower than northern European counterparts. The market is characterized by high installation volume with thinner per-project margins.
| Source | Annual Salary (EUR) | USD Equivalent |
|---|---|---|
| WorldSalaries (median) | €21,020 | $23,100 |
| SalaryExpert (average) | €38,900 | $42,800 |
The wide range between median and average reflects a bifurcated market: a large base of laborers earning close to Spain’s national minimum wage, and a smaller tier of certified solar engineers and project managers pulling up the average. Spain’s 45,000+ solar jobs skew toward the lower end of the EU wage distribution.
Netherlands
The Netherlands consistently ranks among the highest solar density markets in Europe (per capita installed capacity), but installer wages are lower than Germany on a per-hour basis.
| Experience Level | Monthly (EUR) | Annual (EUR) | USD Equivalent |
|---|---|---|---|
| Junior | €1,600–€2,200 | €19,200–€26,400 | $21,100–$29,000 |
| Medior | €2,200–€2,800 | €26,400–€33,600 | $29,000–$36,960 |
| Senior | €2,800–€3,200 | €33,600–€38,400 | $36,960–$42,200 |
| SalaryExpert average | — | €34,226 | $37,600 |
The Netherlands solar installer wage appears modest in absolute terms but looks different relative to local living costs in smaller cities outside Amsterdam and Rotterdam.
Eastern Europe: Poland and Czech Republic
Eastern European solar markets have grown rapidly since 2022, driven by energy security concerns following the Russia-Ukraine conflict. Wages have risen but remain well below Western European levels.
| Country | Average Annual (Local) | USD Equivalent |
|---|---|---|
| Poland | PLN 100,701 (~PLN 8,400/month) | $25,000 |
| Czech Republic | CZK 621,576 | $28,600 |
Poland is adding solar capacity at one of the fastest rates in Europe — nearly 5 GW in 2024 alone. Installer wages are rising accordingly, but the labor market is still catching up to demand. This is discussed further in the solar software Poland market overview.
European Salary Context
European solar installer wages look very different when adjusted for purchasing power. A €41,000 salary in Italy buys more local goods and services than a €41,000 salary in the Netherlands, where housing costs are among the highest on the continent. PPP-adjusted comparisons narrow the apparent north-south gap by 20–30%.
Asia-Pacific: Australia, Japan, South Korea, and India
Australia
Australia has some of the highest solar installer wages in the Asia-Pacific region. The Clean Energy Council (CEC) accreditation requirement — mandatory for all grid-connected installations — acts as a wage floor by restricting supply. For Asia-Pacific-specific compliance details, see Asia-Pacific solar compliance.
| Source | Annual Salary (AUD) | USD Equivalent |
|---|---|---|
| Glassdoor AU | $74,500 | $47,700 |
| Indeed AU (average) | $109,262 | $70,000 |
| ERI | $95,306 | $61,000 |
| Sydney metro (Indeed) | $115,741 | $74,100 |
CEC accreditation is required to design and install grid-connected solar systems in Australia. Installers who hold both an electrical license and CEC accreditation command the highest rates. The Sydney premium (roughly 20% above the national average) reflects both the cost of living and the density of large commercial rooftop projects in New South Wales.
Australia installed a record 7.4 GW of rooftop solar in 2024, sustaining high demand for qualified installers across all states.
Japan
Japan’s solar installer market is mature and pays well, reflecting the country’s high general wage levels and strong union presence in the construction trades.
| Metric | JPY | USD Equivalent |
|---|---|---|
| Average annual salary | ¥7,865,098 | $52,400 |
| Entry-level | ¥5,631,410 | $37,500 |
| Senior | ¥9,477,444 | $63,100 |
| Hourly | ¥3,781 | $25.20 |
Japan’s FIT tariff revisions and move toward corporate PPAs have shifted some installer work toward larger commercial and industrial projects, where wages are higher than residential retrofits.
South Korea
South Korea’s solar industry is growing rapidly, with government targets of 30 GW installed capacity by 2030 driving sustained installer demand.
| Metric | KRW | USD Equivalent |
|---|---|---|
| Average annual salary | ₩50,320,123 | $36,500 |
| Entry-level | ₩36,029,208 | $26,100 |
| Senior | ₩60,635,749 | $44,000 |
India
India presents a different story. With 1 million new solar jobs planned by 2030, the country has the largest growth in absolute installer numbers — but wages remain low relative to global benchmarks.
| Source | Annual (INR) | USD Equivalent |
|---|---|---|
| Indeed India (monthly avg) | ₹27,822/month = ₹3,33,864/yr | ~$4,000 |
| WorldSalaries (median) | ₹2,27,600/yr | ~$2,700 |
The gap between India and Western markets is stark in USD terms. In local context, an experienced solar installer earning ₹400,000–₹500,000 per year is above the Indian national median wage and significantly above construction labor rates. India’s PM Surya Ghar scheme and KUSUM program are creating new installer demand across rural and semi-urban markets, which is gradually pushing wages upward.
Emerging Markets: UAE, South Africa, and Brazil
UAE and Dubai
The UAE solar market is dominated by large government-backed projects (Mohammed bin Rashid Al Maktoum Solar Park, Noor Abu Dhabi) and a smaller but growing commercial rooftop segment.
| Source | Annual (AED) | USD Equivalent |
|---|---|---|
| ERI (Dubai average) | AED 174,934 | $47,700 |
| WorldSalaries (Dubai) | AED 152,300 | $41,500 |
| Entry | AED 125,253 | $34,100 |
| Senior | AED 210,796 | $57,400 |
UAE installer salaries reflect a two-tier labor market: expat engineers and senior technicians earn near or above Western rates, while a larger pool of migrant laborers from South Asia earns significantly less. The ERI figure represents the skilled-installer tier. Wages in the UAE typically increase 7–9% per year for experienced solar technicians, driven by the country’s 2050 clean energy targets.
South Africa
South Africa’s solar market has expanded rapidly since load-shedding crises in 2022–2023 made off-grid and backup solar commercially attractive for businesses and households. For Africa-specific compliance details, see Africa solar compliance.
| Metric | ZAR | USD Equivalent |
|---|---|---|
| Average annual (SalaryExpert) | R363,432 | $19,500 |
| Early career (hourly) | R49.91/hr | $2.69/hr |
| Mid-career (hourly) | R95.00/hr | $5.13/hr |
| Indeed national monthly average | R11,335/month | $7,300/yr |
South African solar wages are rising fast off a low base. The load-shedding-driven installation surge created a genuine skills shortage in 2023–2024, and installer wages in Cape Town and Johannesburg have risen 20–30% in that period.
Brazil
Brazil has added over 35 GW of distributed solar generation since 2012, making it one of the largest solar markets in Latin America. Installer wages remain modest in USD terms but are competitive within the Brazilian labor market.
| Experience Level | Annual (BRL) | USD Equivalent |
|---|---|---|
| Entry (1–3 yrs) | R$55,283 | $10,000 |
| Average | R$75,306 | $13,600 |
| Senior (8+ yrs) | R$85,763 | $15,600 |
For the broader market context, see solar energy in Brazil.
SurgePV Helps Installers Win More Projects
Design, simulate, and propose solar systems in minutes — purpose-built for solar installers who want to close faster and deliver better projects.
Book a DemoNo commitment required · 20 minutes · Live project walkthrough
For a direct comparison, see Arka 360 vs SurgePV.
What Drives Solar Installer Salaries Higher
Six factors consistently separate higher-earning installers from their peers at the same experience level.
1. Certification
Certification is the single most reliable salary lever in markets where it is tracked.
| Country | Certification | Salary Impact |
|---|---|---|
| USA | NABCEP PV Installation Professional | +$11,000/yr average; +15% premium |
| UK | MCS Accreditation | Required for grid-tied work — gate to higher-paying commercial jobs |
| Australia | CEC Accreditation | Required by law — without it, installers cannot connect to the grid |
| Germany | Elektrotechniker + PV qualification | Determines union tariff tier |
| Canada | Provincial electrical license + solar training | Varies by province |
In the US, about 70% of NABCEP holders report a salary increase after certification, and 60% of EPC companies describe it as essential for senior installation roles. The certification pays for itself within the first year for most installers.
2. Sector: Residential vs. Commercial vs. Utility
Moving from residential to commercial work adds $15,000–$20,000 per year in the US. Commercial crews often earn $68,000 versus $52,000 for residential counterparts. Utility-scale work — ground-mount arrays over 1 MW — pays $78,000–$90,000+ in the US, though it typically involves travel and per-diem schedules. For more on this topic, see Design Commercial Solar System 1MW.
The same pattern holds in Germany, Australia, and the UK. Commercial and utility solar projects pay 20–40% more than residential because they require more technical skill (medium-voltage equipment, protection relays, SCADA systems) and carry higher project value.
3. Geography and Local Policy
State-level policy in the US creates wage floors in high-activity markets. Rhode Island’s solar mandate creates year-round installer demand, driving wages to $103,875 — nearly double the national median. California’s community solar programs and ITC bonuses keep the pipeline full, supporting the $55,000–$72,000 range even for mid-career installers. See Community Solar Business Model for detailed guidance.
In Europe, the European solar subsidies tracker shows which countries are adding capacity fastest. Countries currently running large incentive programs (Germany, Italy, Spain, Poland) tend to have higher installer utilization rates — meaning less downtime and effectively higher annual earnings even if the hourly rate is comparable.
4. Self-Employment
Self-employed installers consistently earn more than employees in every market where data is available. The UK is the clearest example: employed installers average £39,000–£41,000 per year, while self-employed sole traders average £56,052. The premium is 36%.
Self-employment introduces revenue risk and business overhead (tools, insurance, marketing), but for experienced installers with a steady referral base, the math typically works in their favor after the first two years. The solar installer profit margins guide covers the business case in detail.
5. Project Management Skills
Installers who move into project management roles see the sharpest salary jump in the career ladder. US solar project managers earn $75,000–$134,500, compared to $61,000–$80,000 for lead installers. The skills that drive this jump — scheduling, subcontractor management, permitting, and client communication — are learnable without a degree but require deliberate effort to develop.
6. Software Proficiency
Installers who can use solar software to design systems, produce proposals, and run performance simulations have become genuinely more valuable to installation companies. Firms that sell higher-value residential and commercial jobs — rather than competing purely on price — tend to pay more because they have higher margins to distribute. Proficiency with design and proposal tools is increasingly listed as a hiring requirement in commercial installation job postings in the US, Germany, and Australia.
Career Progression and the Salary Ladder
The solar installer career path has become more structured as the industry has matured. The ladder below reflects US data most precisely but the shape holds across most markets.
| Role | Typical US Salary | Years to Reach |
|---|---|---|
| Solar helper / laborer | $30,000–$35,000 | Entry |
| Solar installer (level 1) | $35,000–$42,000 | 0–2 yrs |
| Solar installer (level 2 / journeyman) | $48,000–$55,000 | 2–5 yrs |
| Lead installer / crew lead | $55,000–$70,000 | 4–7 yrs |
| Senior installer / master | $65,000–$95,000 | 7+ yrs |
| Solar project manager | $75,000–$134,500 | 6–10 yrs |
| Solar PV engineer / designer | $80,000–$120,000 | 5–8 yrs (with design skills) |
| Sales + technical hybrid | $70,000–$90,000+ OTE | 3–6 yrs |
| Operations & maintenance tech | $60,000–$75,000 | 4–6 yrs |
The fastest path to $70,000+ in the US is the combination of NABCEP certification, commercial-sector experience, and project management responsibility. Installers who add proposal and design software skills — particularly for commercial jobs — can reach crew lead or project manager compensation in 5–6 years rather than 8–10.
For anyone considering the career from scratch, the how to become a solar designer guide explains the certification and training pathways in detail.
Key Takeaway
The gap between a residential installer’s salary and a senior commercial installer’s salary in the US is roughly $28,000 per year. The transition does not require a new credential — it requires experience on larger projects, which can be accelerated by deliberately seeking commercial work assignments early in a career.
Self-Employed vs. Employed: The Real Earnings Gap
Self-employment data is underreported in most salary surveys because it requires separate research into business financials rather than payroll records. Where data exists, the premium is consistent.
| Country | Employed Avg | Self-Employed Avg | Premium |
|---|---|---|---|
| UK | £39,000 | £56,052 | +44% |
| USA | $51,860 | $65,000–$90,000 (solo EPC) | +25–73% |
| Germany | €54,910 (employed) | €60,000–€75,000 (Selbständig) | +10–37% |
| Australia | AUD $75,000 (employed) | AUD $95,000–$130,000 | +27–73% |
The self-employed premium reflects three factors. First, self-employed installers capture margin that would otherwise go to their employer. Second, they control project selection, avoiding low-margin residential work. Third, experienced installers can command higher rates because clients pay for reliability and track record — not just labor hours.
The trade-off is business risk. Self-employed installers manage their own tools, insurance, warranty claims, and lead generation. The hiring solar installers guide covers what employers offer to retain good installers — which indirectly shows what self-employed installers give up (benefits, stable pipeline) and what they gain (margin, autonomy).
Starting your own solar installation business changes the income calculation entirely. The how to start a solar company guide covers the business setup steps for installers considering that path.
Certification’s Impact on Pay: A Country-by-Country View
United States: NABCEP
NABCEP (North American Board of Certified Energy Practitioners) is the gold standard US credential. The salary data is unusually robust for a certification:
- Average pay increase after NABCEP certification: $11,000/year
- Premium over uncertified peers: +15%
- NABCEP holders reporting a pay increase: 70%
- EPCs requiring NABCEP for senior roles: 60%
- Entry range with NABCEP: $50,000–$80,000 (vs. $35,000–$42,000 without)
NABCEP certification takes roughly 6–12 months of study alongside field experience requirements. For most mid-career installers, the ROI is clear within the first year.
UK: MCS
MCS (Microgeneration Certification Scheme) accreditation is mandatory for installers working on grid-connected systems under 50 kW. Without it, an installer cannot legally commission a residential or small commercial solar system — effectively making it a market entry requirement rather than an optional premium.
MCS-accredited installers typically earn £5,000–£12,000 more per year than unaccredited tradespeople with similar hours. More importantly, accreditation opens access to the Boiler Upgrade Scheme and Smart Export Guarantee, which drive residential project volume.
Australia: CEC
The Clean Energy Council accreditation is the Australian equivalent: legally required, not optional. CEC accreditation for grid-connected systems (Design and Install) requires completing an accredited training course plus field experience. Accredited installers earn substantially more than non-accredited construction workers who might otherwise enter the solar trade.
Germany: Tariff Tiers
German installer pay is structured by qualification level under union agreements. A helper (Helfer) earns the minimum tariff of €15.50/hr. A qualified electrician with a PV specialization earns €22–€28/hr under the 2025 ZVEH tariff structure. The difference over a full year is approximately €13,000–€22,000 — a clear financial argument for completing the formal qualification.
Solar Installer Salary vs. Other Trades
Solar installation sits in the middle of the skilled trades wage distribution. It pays less than licensed electricians on average in most markets but more than general construction laborers.
| Trade | US Median Annual | Growth (2024–2034) |
|---|---|---|
| Wind turbine technician | $61,770 | 60% |
| Electrician | $61,590 | 11% |
| HVAC technician | $57,300 | 9% |
| Carpenter | $56,350 | 2% |
| Solar PV installer | $51,860 | 42% |
| Plumber | $61,550 | 7% |
Solar pays less than electricians now, but the growth trajectory means that wage gap is likely to shrink. The BLS projects 42% job growth for solar PV installers from 2024 to 2034 — roughly four times the projected growth for electricians. Supply shortages in a fast-growing occupation push wages up. NABCEP-certified senior solar installers earning $75,000–$95,000 are already above the electrician median.
The comparison shifts further in solar’s favor when you factor in the geographic flexibility of solar work. Residential solar installers can find work in virtually every US state now, while electrician demand is more concentrated in dense urban markets.
2026 Job Market Outlook: A Genuine Skills Shortage
The 2026 solar installer job market is shaped by one dominant fact: the industry is growing faster than it can train qualified workers.
BLS projects 42% job growth for solar PV installers from 2024 to 2034 — making it one of the two fastest-growing occupations in the entire US economy, alongside wind turbine technicians. About 12,000 new annual openings are expected. The industry needs approximately 355,000 workers by late 2026 to meet deployment targets.
The supply is not keeping up. A 53,000-worker gap is currently threatening the July 4, 2026 federal tax credit deadline — the point at which certain IRA incentives require project completion. 86% of solar employers report difficulty hiring. 27% of utility-scale firms describe hiring as “very difficult.” Only 43% of the US workforce has access to the solar skills training required.
This shortage directly affects salaries. When employers struggle to hire, they raise offers. Entry-level solar installer wages rose faster than inflation in 2024 and are continuing to climb in 2025–2026. States with the strongest installation pipelines (California, Texas, Arizona, New Jersey) are seeing the sharpest entry-level wage growth.
Key 2026 workforce statistics:
- 280,119 total solar jobs in the US
- 7.1 million solar PV jobs globally (IRENA 2024)
- 11,177 solar installation businesses in the US (802% increase since 2006)
- 86% of solar employers report hiring difficulty
- 53,000-worker gap threatening 2026 deployment targets
- Solar workforce demographics: 59% age 20–34; 29% women; growing diversity
Globally, the fastest-growing solar workforces are in:
- China (4.6 million solar jobs, but not export-relevant for salary benchmarking)
- India (319,000 solar jobs, targeting 1 million by 2030)
- EU (720,000 solar PV jobs; Germany, Italy, and Poland leading)
- US (280,000+ jobs, fastest per-capita growth outside China)
- Brazil (1.6 million total renewable energy jobs)
- Australia (strong per-capita growth, CEC accreditation creating structured demand)
Pro Tip for Solar Business Owners
In a tight labor market, retaining your best installers is worth more than recruiting new ones. Offering project management pathways, commercial work access, and tools like solar proposal software that reduce administrative burden can increase installer job satisfaction and reduce churn at a lower cost than a salary increase alone.
The solar market size by country data shows which markets are adding the most capacity — and therefore which countries will face the sharpest installer demand over the next three years.
For solar companies using solar design software to run more efficient operations, the productivity case becomes clearer in a tight labor market: each installer’s time is worth more when there are fewer of them, so tools that reduce design and proposal time directly improve per-installer output value.
Salary Benchmarking for Solar Installation Companies
For solar installation businesses, salary data serves two purposes: recruiting competitively and retaining experienced staff.
The hiring solar installers guide covers the full hiring process. For compensation benchmarking specifically:
Step 1: Use BLS state-level data as your floor. The Occupational Employment and Wage Statistics (OEWS) data for your state reflects actual payroll records — more reliable than job-site aggregators for setting base pay.
Step 2: Add a sector premium if you do commercial or utility work. Commercial installers should earn 20–30% more than residential in your comp model. If you don’t offer that premium, experienced installers will find companies that do.
Step 3: Price certifications properly. If you require or prefer NABCEP, factor $11,000 into the comp differential between certified and uncertified hires. Paying a certified installer at uncertified rates is a retention risk.
Step 4: Consider the self-employment threat. Your senior installers are always one referral network away from going independent. Offering project management tracks, profit-sharing, or tool allowances can offset the pull of self-employment for the installers you most want to keep.
For the financial modeling behind installer compensation decisions, the generation and financial tool can help owners understand how project volume and margin targets translate into sustainable comp packages.
For a detailed breakdown of how installation companies structure pricing and margin, the solar installer profit margins guide covers the numbers.
Key Takeaway
In markets with a genuine installer shortage — which includes the US, Germany, Australia, and the UK in 2026 — the real salary benchmark is not what the average competitor pays. It is what a good installer can earn by going independent or moving to a larger contractor. That number, not the BLS median, is your actual retention threshold.
Conclusion
Three things stand out from the data.
- The Germany/India gap ($60,500 vs. $4,000) is not a solar story — it is a trade wage story. Solar installer compensation tracks local skilled trade wages in every country. The solar market gives the job growth; local labor economics set the pay floor.
- Certification is the most reliable individual salary lever. NABCEP in the US, MCS in the UK, CEC in Australia, and union tariff qualifications in Germany all produce measurable salary premiums that typically exceed their cost of attainment within 12–24 months.
- 2026 is a seller’s market for qualified solar installers. The 53,000-worker gap in the US, similar shortage dynamics in Germany and Australia, and 42% projected US job growth through 2034 mean that experienced installers have real negotiating power. If your current compensation is not keeping pace with market rates, this is the moment to benchmark.
Frequently Asked Questions
How much does a solar installer earn in the US?
The US Bureau of Labor Statistics reports a median annual wage of $51,860 for solar PV installers as of May 2024. Entry-level roles start at $35,000–$42,000, while senior installers with 8+ years of experience earn $65,000–$95,000. NABCEP certification adds an average of $11,000 per year on top of that.
What is the highest-paying country for solar installers?
Germany pays the highest average solar installer salary in USD terms among major markets, at roughly $60,500 per year. Australia follows closely in local purchasing power terms, with average wages of AUD $75,000–$95,000. The US ranks third globally but leads in volume of available jobs and salary ceiling for senior roles.
How does NABCEP certification affect salary?
NABCEP certification raises solar installer salaries by an average of $11,000 per year in the United States — roughly a 15% premium over uncertified installers. About 70% of NABCEP holders report a salary increase after certification, and 60% of EPC companies list it as essential for senior roles.
What is the average solar installer salary in the UK?
Solar installers in the UK earn an average of £39,000–£41,000 per year (roughly $49,000–$52,000 USD). Self-employed sole traders command significantly more — around £56,052 per year — and skilled solar electricians with MCS accreditation are among the highest earners in the trade.
Is solar installation a good career in 2026?
Yes. Solar PV installer is the fastest-growing occupation in the US economy, with projected 42% job growth from 2024 to 2034. A 53,000-worker gap is threatening 2026 deployment targets, meaning qualified installers have strong negotiating power. Germany, Australia, and the UK face similar shortage dynamics.
How do solar installer salaries compare to electricians?
Electricians earn slightly more than solar installers on average — $61,590 vs. $51,860 median in the US. However, solar installation has a faster growth rate (42% vs. ~11% for electricians) and NABCEP-certified installers close most of that salary gap. Self-employed solar installers in markets like the UK often out-earn licensed electricians. Solar proposal software generates professional quotes in minutes.