Quick Answer
Solar digital twins create virtual replicas of PV plants for real-time monitoring, fault prediction, and performance optimization. They combine 3D CAD models, IoT sensor data, and weather feeds. Benefits: 5–10% yield improvement, 20% O&M cost reduction, and 30% faster fault resolution. Leading providers: SenseHawk, Above, and RatedPower.
Solar digital twin technology has crossed the line from research project to standard operating practice. Asset managers running plants above 1 MW now expect a live 3D model of every site, fed by inverter telemetry and weather data, that flags underperformance the same minute it begins. The wider digital twin market is on track to hit roughly $48.2 billion by the end of 2026, and solar is one of the fastest-growing slices of that pie. Read Design Commercial Solar System 1MW for a complete walkthrough.
Solar digital twins create virtual replicas of PV plants for real-time monitoring, fault prediction, and performance optimization. They combine 3D CAD models, IoT sensor data, and weather feeds. Benefits: 5–10% yield improvement, 20% O&M cost reduction, and 30% faster fault resolution.
Solar digital twins create virtual replicas of PV plants for real-time monitoring, fault prediction, and performance optimization. They combine 3D CAD models, IoT sensor data, and weather feeds. Benefits: 5–10% yield improvement, 20% O&M cost reduction, and 30% faster fault resolution. Leading providers: SenseHawk, Above, and RatedPower.
This guide explains what a solar digital twin actually is, how the 3D model and the live data layer fit together, which sensors and platforms make it work, and what the ROI looks like at residential, commercial, and utility scale.
TL;DR — Solar Digital Twins in 2026
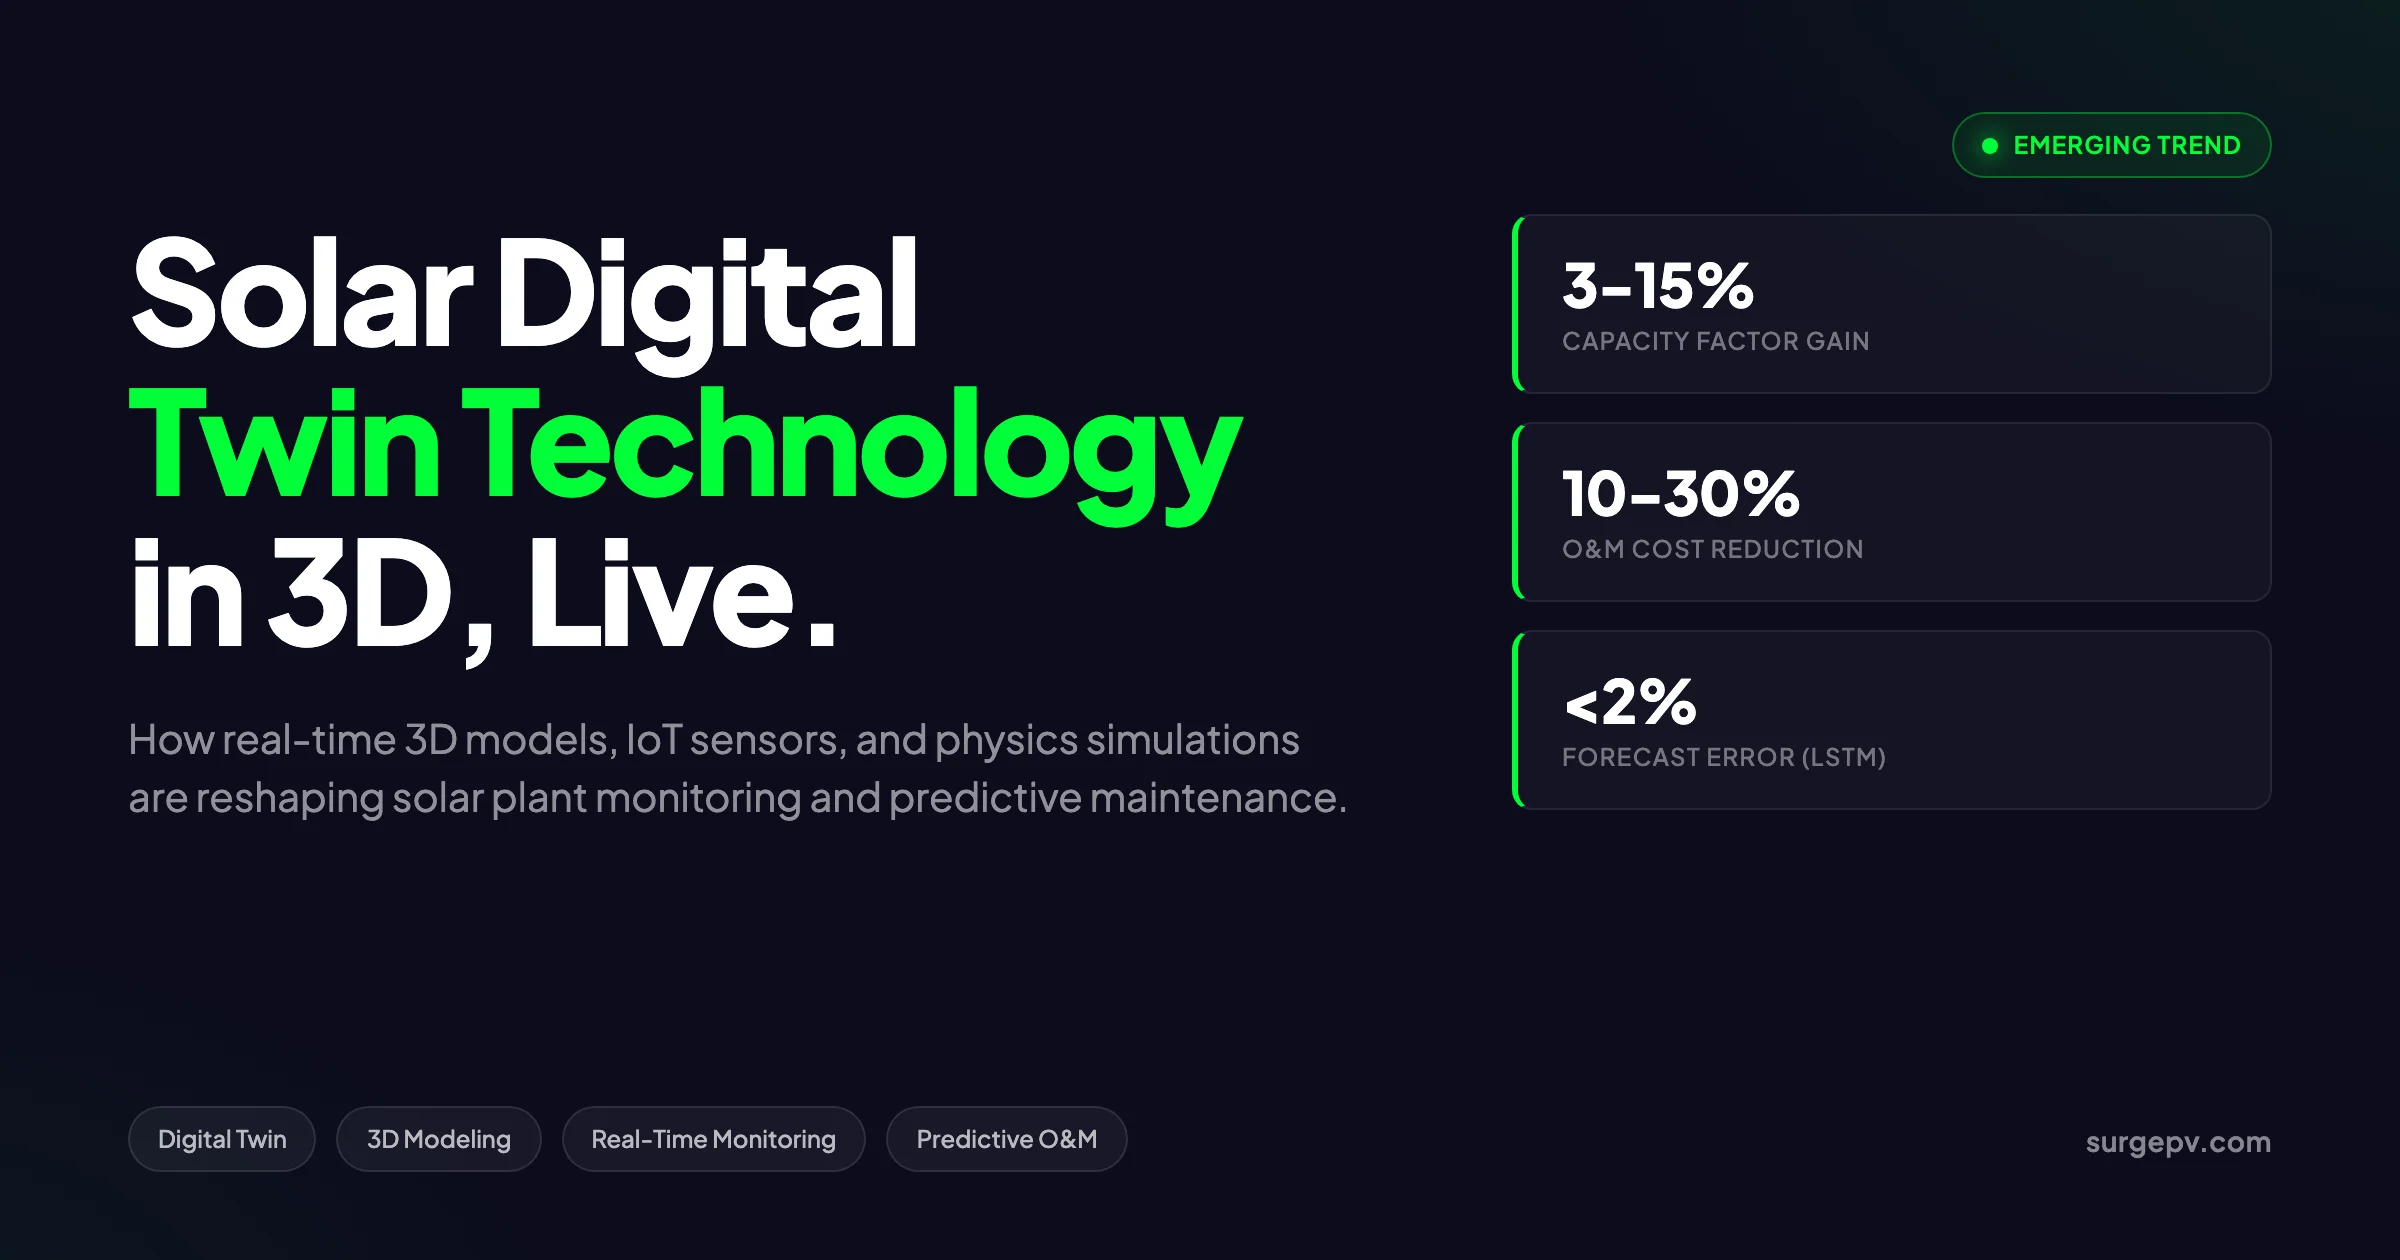
A solar digital twin is a parametric 3D copy of a PV plant fed by real-time IoT data, running a physics simulation in parallel with the physical site. Operators report 3 to 15 percent capacity factor gains and 10 to 30 percent O&M cost cuts. The technology is now standard on utility-scale assets, common on commercial systems above 100 kWp, and starting to appear in residential monitoring tools.
What a Solar Digital Twin Actually Is
A solar digital twin is a live virtual instance of a physical PV system. The word “live” is the part that separates it from a normal design model. A PVsyst report or a SAM simulation describes the plant as it was meant to perform on day one. A twin describes the plant as it is performing right now, this minute, with this irradiance, this module temperature, and this exact pattern of soiling and degradation.
The twin contains four layers stacked on top of each other:
- Geometry — a 3D model of every module, mounting structure, inverter pad, fence line, and shading object built from drone photogrammetry, LiDAR, or as-built CAD files
- Physics — the equations that translate sunlight into DC power and DC into AC, including spectral, thermal, and electrical losses
- Telemetry — the live feed of irradiance, temperature, voltage, current, and inverter status from the SCADA or DAS network
- Analytics — the comparison layer that calculates expected versus actual performance and surfaces deviations For France-specific information, see Agricultural Solar Case Study.
When all four layers run together, the operator sees a coloured 3D site map where every string is green, yellow, or red based on its production gap against the simulation. That visual is the part most engineers describe as the “aha moment” the first time they use the technology.
For a deeper definition of the underlying modelling concept, see our digital twin modeling glossary entry.
Latest Status: Where Solar Digital Twins Stand
The technology has moved through three distinct phases over the past five years. Each phase added capability that the previous one could not deliver.
| Phase | Years | Capability | Typical Adopter |
|---|---|---|---|
| Phase 1: Static models | 2018-2020 | Design simulation, no live data | Engineering firms |
| Phase 2: Connected dashboards | 2020-2023 | Live KPIs, no parallel simulation | Asset managers |
| Phase 3: Full digital twins | 2023-present | 3D + live data + parallel physics | Utility O&M teams |
| Phase 4: AI-assisted twins | 2026 onward | Self-calibrating, predictive, autonomous response | Early adopters and large IPPs |
Most operators today sit between Phase 2 and Phase 3. The jump to Phase 3 requires investing in calibrated weather instruments, string-level monitoring, and a platform that can run physics simulations on the same time scale as the data feed. Vendors that already deliver Phase 3 include Modelon (with ENGIE), PVcase, Raptor Maps, SmartHelio, and Wattch, alongside in-house platforms at large IPPs.
The IEA-PVPS Task 13 working group released its 2026 report on digitalisation and digital twins in PV systems earlier this year. The report confirmed that twin-based monitoring is now the recommended baseline for assets above 5 MW. You can read the full IEA-PVPS Task 13 report directly from the IEA archive.
The 3D Model: How Geometry Drives Everything
The 3D model is not cosmetic. It is the substrate the entire physics layer runs on. If the geometry is wrong, every downstream calculation is wrong.
Building the As-Built Geometry
Most utility-scale twins start with a UAV photogrammetry pass over the completed site. A drone flies a programmed grid pattern, captures 1,500 to 5,000 georeferenced images, and the photogrammetry software produces a textured 3D mesh accurate to roughly 2 to 5 cm horizontally. LiDAR adds vertical accuracy, which matters for tracker geometry and for any site with topography that affects inter-row shading.
The mesh is then cleaned and converted into a parametric model. Each module becomes a discrete object with its own coordinates, tilt, azimuth, manufacturer, and serial number. Inverters, combiner boxes, transformers, and trenches all become typed objects in the same scene.
For commercial rooftop systems, the geometry usually comes from a drone roof scan or a satellite stitching service, not full photogrammetry. The accuracy required is lower because there are fewer modules and the shading objects are smaller. For residential systems, the geometry often reduces to a roof outline and a string layout, with shading objects added from public LiDAR datasets.
Designing the original geometry is where good solar design software earns its keep. The accuracy of the design phase carries through into the twin.
Why Geometry Matters for Performance
Two real examples make the point. A 35 MW tracker plant in Spain saw a 4.2 percent yield shortfall in its first year. The dashboard showed the inverters healthy and the strings within tolerance. The twin’s 3D model, fed by the same data, showed something different: row 18 was throwing a shadow on row 19 every morning between 7:30 and 9:15 because the tracker stow logic had a 12-minute delay. The dashboard could not see this. The twin could see it because it knew the geometry. Also see: Spain net metering.
A 220 kWp commercial rooftop in Germany underperformed by 7 percent. The string-level data was clean. The twin showed that a recently installed HVAC unit was casting a 40-minute morning shadow on string 4 that had not existed when the system was commissioned. Updating the geometry in the twin and re-stringing the affected modules recovered 4.8 percent. Also see: Germany solar subsidies. Read more about Community Solar Projects Germany.
In both cases, the geometry is what made the diagnosis possible. For a deeper look at how shadows propagate through a string, see our guide on how shading affects solar panels and the shadow analysis workflow.
The Physics Layer: From Sunlight to AC Output
The physics layer is the second pillar of the twin. It calculates what the plant should produce given the conditions the sensors are reporting. This calculation runs on the same cadence as the data feed, usually every 1 to 15 seconds for utility-scale plants and every 5 to 15 minutes for commercial systems.
The Calculation Chain
The standard chain has six steps, each adding a layer of physics:
- Plane-of-array irradiance — translate the GHI, DNI, and DHI from the weather station into the irradiance hitting each module given its tilt and azimuth
- Optical losses — apply IAM (incidence angle modifier), soiling, snow, and shading factors derived from the 3D geometry
- Cell temperature — calculate module temperature from POA irradiance, ambient temperature, wind speed, and the mounting type
- DC output — apply the module’s IV curve at the calculated cell temperature and irradiance
- String aggregation — sum the modules in each string accounting for mismatch and clipping
- AC conversion — apply the inverter’s efficiency curve and any DC-to-AC clipping
The output of step 6 is the twin’s predicted AC power. The sensors report the actual AC power. The difference is the deviation, and the twin’s value comes from how fast and how granularly it can attribute that deviation to a specific cause.
Why First-Principles Beats Statistical Comparison
Most legacy monitoring platforms use statistical methods. They compare today’s production against a rolling baseline, or against a fleet-wide median, or against a simple PVsyst expected-yield curve generated once at commissioning. These approaches all share a problem: they do not know why the deviation is happening.
The physics-based approach models actual power generation from first principles, which makes it both more accurate and more useful for issue diagnosis. If the twin says the string is underperforming by 8 percent and the simulation shows the only difference is module temperature, the technician knows to check ventilation, not stringing. If the twin shows the deviation only appears when the sun is at a specific azimuth, the technician knows to look for a new shading object.
For a primer on how performance ratio actually works, see how to calculate solar performance ratio and the related p50/p90 energy yield framework.
The Sensor Stack: What Feeds the Twin
A twin is only as good as its sensors. The data quality at the input determines the diagnostic accuracy at the output. Here is the standard sensor stack at each system size.
Utility-Scale Stack (>5 MW)
| Sensor Type | Quantity | Purpose |
|---|---|---|
| Class A pyranometer | 1 per ~10 MW | Reference GHI |
| Class A POA pyranometer | 1 per inverter pad | POA validation |
| Module back-of-panel temperature | 4 to 8 per array | Thermal model calibration |
| Ambient air temperature | 1 per met station | Standard correction |
| Wind speed and direction | 1 per met station | Convective cooling model |
| String-level monitoring | Every string | Mismatch detection |
| Module-level monitoring (optional) | Every module | High-resolution fault detection |
| Soiling station | 1 per ~10 MW | Cleaning trigger |
| Aerial thermography | Quarterly | Hot spot mapping |
The string-level monitor is the workhorse. Without it, the twin can only diagnose at the inverter level, which means a single bad module hides among 4,000 healthy ones. For more on this, see string monitoring and fault detection in the glossary.
Commercial Stack (100 kWp to 5 MW)
Commercial systems usually drop the dedicated met station in favour of a single POA pyranometer plus a satellite-derived GHI feed. They keep string-level monitoring but typically skip module-level monitoring. Soiling is measured opportunistically through cleaning cycles, not with a dedicated sensor.
Residential Stack (Under 25 kWp)
Residential twins almost never include physical weather sensors. They rely on the inverter’s internal voltage and current readings plus a virtual irradiance feed from a satellite source like NSRDB or Solcast. Module temperature is estimated from inverter telemetry rather than measured directly. The sensor stack is thin, but the geometry can be reconstructed from a single drone flight or even a phone-based 3D scan.
For a side-by-side look at consumer-grade options, see our solar monitoring systems comparison.
Real-Time Data Pipeline: From Inverter to Dashboard
The data pipeline is what makes the twin “real-time” rather than “yesterday-time”. The architecture is consistent across most platforms, with three distinct stages.
Stage 1: Edge Collection
Field devices speak proprietary protocols. Inverters use Modbus TCP, Sunspec, or Profinet. Met stations often use serial protocols translated to Modbus. Trackers speak their own dialects. An edge gateway sits at the site and translates everything into a common format, usually MQTT or OPC UA. The gateway also handles store-and-forward when the WAN link drops, a non-trivial requirement for rural utility plants.
Polling intervals vary by signal type. Inverter AC power and DC voltages typically poll every 1 second. Module temperature polls every 5 seconds. Weather data polls every 1 to 5 seconds. Tracker positions poll every 30 seconds. For more on this topic, see DC Bus Voltage Optimization.
Stage 2: Cloud Transport and Storage
The MQTT or OPC UA stream feeds into a time-series database — InfluxDB, TimescaleDB, or a vendor cloud equivalent. The database is optimised for write speed and time-window queries, both of which matter when the twin needs to compare a 1-second sample against the same 1-second sample 12 months ago.
Compression matters at this scale. A 100 MW plant with full instrumentation produces roughly 8 to 12 GB of raw telemetry per day. Compressed, that drops to 200 to 400 MB. Over a 25-year asset life, the storage decision compounds quickly.
Stage 3: The Twin Engine
The twin engine is where physics meets data. It pulls the latest measurements from the time-series store, runs the simulation chain described earlier, computes the deviations, and pushes the results into the 3D viewer and the alerting system. The cadence is typically 1 minute for utility-scale plants and 15 minutes for commercial.
The 3D viewer itself usually runs on CesiumJS, Three.js, or Unity. The choice matters for performance: CesiumJS handles geographic context well, Three.js gives the most flexibility, and Unity gives the cleanest visuals for marketing and stakeholder demos.
For more on the underlying control system, see the SCADA solar and production monitoring glossary pages.
See your next plant in 3D before you build it
Upload your site, design the array, simulate annual yield, and export an as-built model that becomes the foundation of your operating digital twin.
Book a DemoNo commitment required · 20 minutes · Live project walkthrough
Use Cases That Justify the Investment
Asset managers do not buy twins for the visualisation. They buy them for specific operational outcomes. Five use cases consistently deliver the highest payback.
1. Underperformance Detection at the String Level
The single biggest financial driver. A 100 MW plant with a 1.5 percent unidentified loss leaks roughly $250,000 to $400,000 per year at typical PPA prices. Catching that loss in week 1 instead of month 6 is the entire ROI case for many operators.
Twins detect underperformance by comparing predicted versus actual at every aggregation level — module, string, inverter, plant — every minute. The alert thresholds are set per level. A 3 percent deviation at the plant level is below noise. A 3 percent deviation at the string level for more than 30 minutes is a service ticket.
2. Predictive Maintenance and Failure Forecasting
A twin trained on 18 to 24 months of operating data starts to recognise the signatures of failures before they manifest as production loss. Inverter capacitor degradation, IGBT thermal drift, fuse failure, and bearing wear in trackers all leave telltale patterns in the telemetry that precede the actual fault by days or weeks.
This is the bridge to the broader predictive maintenance practice. The twin becomes the data foundation that the predictive models train on.
3. Soiling and Cleaning Optimisation
Soiling losses range from 2 percent in clean climates to 18 percent in dusty agricultural or desert environments. Clean too often and you spend more on water and labour than the loss costs you. Clean too late and you leave money on the table.
A twin with a soiling sensor and a regional forecast model calculates the daily marginal value of cleaning each block. Operators using twin-driven cleaning schedules report 12 to 22 percent reductions in cleaning cost without yield loss compared to fixed-interval schedules.
4. Warranty Claim Evidence
Module manufacturers often push back on warranty claims when the evidence is a monthly average production gap. A twin produces second-by-second IV curve deviation data that pinpoints the specific underperforming modules and rules out shading, soiling, and inverter issues. Several large IPPs have built warranty teams that work directly off twin output, and recovery rates on filed claims have moved from below 30 percent to above 70 percent.
5. Repowering and Augmentation Decisions
When a plant is 8 to 12 years old, the operator faces a series of capital decisions: replace inverters, replace modules, add tracker retrofits, add storage. The twin runs each scenario as a parallel simulation against actual recent weather data, producing a financial NPV that is far more credible than a fresh PVsyst run. For the financial side of these decisions, our generation and financial tool builds the analysis directly into the design environment.
Twin Implementation: A Practical Roadmap
Implementing a twin on an existing operating plant takes between 8 and 16 weeks. The path below is the one most experienced O&M teams follow.
Week 1-2: Geometry Capture
Schedule the drone flight or LiDAR survey. Process the photogrammetry into a textured mesh. Convert the mesh into a parametric model with each module, inverter, and shading object as a discrete typed entity. Verify against as-built drawings.
Week 3-4: Sensor Audit and Upgrade
Walk the site and inventory every sensor. Calibrate or replace any pyranometer older than 24 months. Verify module temperature sensors are bonded to module backsheets, not zip-tied to junction boxes. Confirm string-level monitoring resolution. Add a soiling station if one does not exist.
Week 5-6: Data Pipeline Build
Stand up the edge gateway, configure protocol translators, point the MQTT stream at the time-series database. Verify polling intervals match the design. Run a 7-day shakedown to confirm no data gaps and acceptable latency.
Week 7-10: Physics Calibration
This is the longest phase. The twin’s physics chain has dozens of parameters — module spectral response, IAM coefficients, mounting thermal model, inverter efficiency curve. Calibrate each against a clean week of data. Tune until the predicted-versus-actual residual is below 2 percent across all conditions.
Week 11-14: Alert Tuning
Out of the box, every twin generates too many alerts. The first two weeks of alerts will be noise — sensor calibration drift, transient cloud edges, communication lapses. Tune thresholds, add hysteresis, and group correlated alerts. The goal is fewer than 10 high-priority alerts per week per 100 MW.
Week 15-16: Integration with Field Operations
Connect the alert stream to the CMMS, the technician dispatch app, and the warranty workflow. Train field crews on the 3D viewer. Run a tabletop exercise on a known historical fault to validate the workflow. The twin is now operational.
Cost Economics: What Twins Actually Cost
Pricing varies by vendor and scale, but the market has converged on three rough tiers.
| Plant Scale | Annual Twin Cost | Typical Inclusions |
|---|---|---|
| Residential (under 25 kWp) | $0 to $60 per system | Bundled with monitoring |
| Commercial (100 kWp to 5 MW) | $3 to $8 per kWp per year | Geometry capture extra |
| Utility-scale (>5 MW) | $1.50 to $4 per kWp per year | Volume discount; geometry usually one-time fee |
| Hyperscale (>500 MW) | Custom | Often built in-house |
The geometry capture itself is a separate one-time cost: $400 to $1,200 per MW for drone photogrammetry, $1,500 to $3,500 per MW for LiDAR. Both costs trend down each year as drone autonomy improves.
Against these costs, the gain is well-documented. Operators report capacity factor improvements of 3 to 15 percent through digital twin-guided operations while reducing operating expenses by 10 to 30 percent. At a 14 percent capacity factor, $0.05/kWh wholesale, and a 100 MW plant, even a 2 percent capacity factor gain delivers about $1.2 million per year against software costs of around $200,000. The payback is measured in weeks, not years.
Vendor Map: Who Builds What
The vendor space is fragmented because no single company yet covers design, twin, and asset management equally well. Most operators stitch two or three tools together.
Pure-Play Twin Platforms
Modelon — physics-first, deep simulation library, used by ENGIE for predictive maintenance across its global solar fleet. Best for engineering-heavy teams. ENGIE’s collaboration with Modelon is one of the more public reference cases; the project writeup covers the architecture in detail. For Global-specific compliance details, see Global net-metering-by-country.
Raptor Maps — strongest in aerial thermography integration. The 3D viewer ties drone IR scans directly to module-level fault data. Best for plants with active aerial inspection programmes.
SmartHelio — analytics-first, with strong fault detection algorithms. Their technical writeup on twin architecture is one of the more accessible explanations of the data flow.
Wattch — focused on US and Canadian commercial markets. Strong reporting suite for asset owners. For Canada-specific compliance details, see Canada comparisons/solar-design-software.
Design-Plus-Twin Platforms
PVcase — design platform that exports an as-built model directly into a twin runtime. Their digital twin whitepaper describes the lifecycle continuity from design to operations.
SurgePV — design, simulation, and proposal in one cloud platform. The same 3D model that runs the design simulation becomes the geometry foundation of the operating twin. See solar designing for the design workflow.
In-House Platforms
The largest IPPs — NextEra, Engie, Iberdrola, EDF Renewables — have built their own twin stacks on top of open-source tools. The build-versus-buy line typically falls around 2 GW of operating fleet. Below that, vendors are cheaper. Above that, in-house starts to win on customisation.
The AI Layer: Where Twins Are Heading Next
Twins today are mostly deterministic. The physics chain runs the same calculation every minute and reports the residual. The next layer of capability is AI augmentation, and three patterns are showing up in 2026 deployments.
LSTM-Based Yield Forecasting
Long Short-Term Memory neural networks are now the most accurate short-term yield forecasters for PV plants. A 2024 IEEE paper documented an LSTM-driven twin reducing day-ahead forecast error to 2.1 percent against a baseline statistical forecast at 4.8 percent. Better forecasts directly translate into better grid bids and lower imbalance penalties in markets with real-time pricing.
For the broader market context, see Digital Twinning and LSTM-based Forecasting Model of Solar PV Power Output in IEEE Xplore.
Self-Calibrating Physics Parameters
Traditional twins require manual recalibration every 6 to 12 months as soiling patterns, degradation, and component aging shift. AI-augmented twins recalibrate continuously, adjusting IAM coefficients, thermal models, and degradation rates in response to observed data. This eliminates the slow drift that erodes twin accuracy over time.
Anomaly Detection Beyond Thresholds
Threshold-based alerting catches obvious faults but misses slow drifts and correlated multi-signal anomalies. Unsupervised models — autoencoders and isolation forests — flag unusual patterns even when no single signal exceeds its threshold. This is how operators are catching tracker bearing wear and inverter capacitor aging months before classical methods would.
For the broader picture of AI in solar design, see AI solar design and automated PV layout. The same modelling lineage feeds Clara AI inside the SurgePV platform.
Floating Solar and Agrivoltaics: Edge Cases That Matter
Two segments deserve their own discussion because their geometry is non-standard.
Floating PV Twins
A floating array moves. Wind, wave, and current cause continuous tilt and azimuth changes that a fixed-tilt twin cannot capture. Modern floating twins layer a real-time motion model on top of the static geometry. Sensor data from accelerometers and tilt meters feed the motion model, which corrects the POA irradiance calculation in real time. Read more about Commercial Rooftop Solar Case Study Italy.
A 2026 ScienceDirect study documented a Unity-based 3D twin of a floating solar system in waves, with a Python ML framework predicting tilt-induced losses. The accuracy improvement over a static-geometry twin was roughly 3.4 percent.
Agrivoltaic Twins
Agrivoltaic systems combine solar with crops, which means the shading objects below the array — the crops themselves — change with the season. A static twin underestimates losses in summer when crops are tall and overestimates them in winter when fields are bare.
Modern agrivoltaic twins use a UAV-based monthly mesh refresh combined with crop height models. The result is a seasonally accurate shading map that feeds the physics chain. For the broader design context of dual-use solar, see agrivoltaics design.
Cybersecurity and Data Governance
A twin doubles the attack surface of a solar plant. The same telemetry stream that powers fault detection is also a direct path to inverter control, tracker positioning, and grid-side breakers. Three security postures separate mature deployments from naive ones.
Network segmentation. The OT (operational technology) network — inverters, trackers, met stations — should never share a flat network with the IT network that hosts the twin viewer. A DMZ with one-way data diodes is the standard pattern for utility-scale plants. Anything less is a finding in a NERC CIP audit in North America or an NIS2 audit in Europe. Also see: European Solar Incentives.
Identity and access control. The twin viewer must enforce role-based access. A field technician sees the alert queue. An asset manager sees the financial overlay. A vendor support engineer sees only the data needed for the open ticket. No shared admin credentials, no exceptions.
Data residency and ownership. Most twin contracts are silent on who owns the historical telemetry. Push for explicit ownership of all data generated by the asset, plus the right to export it in a non-proprietary format if you change vendors.
The IEA-PVPS Task 13 group has published draft guidance on twin cybersecurity that is becoming the de-facto reference. Expect ISO 27001 certification to become a baseline procurement requirement by mid-2027.
Common Implementation Mistakes
After enough deployments, the failure modes are predictable. Five mistakes account for most underperforming twin projects.
Mistake 1: Skipping the sensor calibration step. The most common failure. Teams point a twin at the existing SCADA feed and discover that the pyranometer has drifted 8 percent over four years. The twin’s residuals look meaningless because the input is wrong.
Mistake 2: Using design-time geometry instead of as-built geometry. Designs change during construction. Modules end up in different positions, rows shift, junction boxes move. A twin built on the design model carries those errors forever.
Mistake 3: Setting alert thresholds at the inverter level instead of the string level. A 2 percent inverter-level deviation hides a 30 percent string-level fault on a single string. Alerts must aggregate up, not down.
Mistake 4: Treating the twin as IT instead of operations. The twin lives or dies based on whether technicians use it daily. If it sits in an analyst dashboard that no field crew checks, the value disappears. Integration with the CMMS and the dispatch workflow is non-negotiable.
Mistake 5: Underinvesting in the 3D model refresh. Sites change. New shading objects appear, vegetation grows, modules get replaced. A geometry that was right at commissioning is wrong by year three. A quarterly drone refresh is the minimum sustainable cadence.
Twins in Residential and Behind-the-Meter Markets
Residential twins look very different from utility-scale twins, but the trend line is real. Three developments are pushing twin-style features into the consumer space.
Inverter manufacturer apps — Enphase, SolarEdge, and Tesla now offer per-module visualisation with comparative shading models. The “twin” branding is absent, but the architecture is the same: 3D geometry plus per-device telemetry plus a deviation calculation.
Smart panel integration — Maxeon, SunPower, and others now ship modules with embedded sensors that report module-level voltage, current, and temperature. Combined with a roof scan, this delivers a rooftop twin without any field installation. See smart solar panels for the broader trend.
Third-party platforms — companies like Aurora Solar and Solargraf are extending design tools into the operations phase, where the as-designed model becomes the foundation of an operating twin. For software options, see 7 Best Aurora Solar Alternatives in.
The business case at residential scale is different. The capacity factor gains are smaller in absolute terms, but the value of warranty claim evidence and underperformance documentation is high. A homeowner with a 10 kWp system that is silently leaking 8 percent loses about $200 to $400 per year. A twin that catches the issue in month 2 is worth multiples of its cost over a 25-year life.
What This Means for Solar Designers and EPCs
The shift to twin-based operations changes what gets demanded at the design phase. Three changes show up most often in tender requirements.
As-built deliverable required. Owners increasingly require the EPC to deliver a calibrated 3D as-built model alongside the physical plant. This is replacing or supplementing traditional record drawings.
Sensor specification is part of the design. Specifying string-level monitoring, soiling stations, and Class A pyranometers is now part of the design package, not an O&M afterthought.
Bankability documentation includes twin readiness. Lenders are starting to ask whether the asset will run on a twin platform from day one, because the financial model assumes the lower O&M cost and higher availability that twins enable. For the broader bankability framework, see our bankability glossary entry.
This is where good solar software and good solar proposal software earn their place. The sales-to-design-to-as-built chain has to be unbroken for the twin to start cleanly.
What to Watch Next
Three trends are likely to define the next 18 months in solar digital twins.
Twin-to-twin interoperability. Today’s twins are siloed by vendor. Open data standards — particularly the IEC 61400-25 family being extended to PV — will let operators move between platforms without losing the historical data. Watch for this in 2027 procurements.
Embedded twins in inverters. The next generation of inverters from Huawei, Sungrow, and SMA are shipping with on-device twin engines that run a local physics simulation independently of any cloud platform. This dramatically improves resilience and reduces cloud costs.
Twin-driven storage dispatch. As more solar plants gain co-located storage, the twin becomes the optimisation engine for charge and discharge decisions. The same model that predicts solar output predicts the optimal battery cycle for the next 24 hours.
For a broader take on where solar technology is heading, see our future of solar energy overview and the perovskite solar cells deep-dive.
Conclusion
Solar digital twins have stopped being a research topic and started being an operations standard. Three takeaways for owners and operators:
- If you operate above 5 MW and you are not running a twin, you are leaving 3 to 15 percent of capacity factor on the table — start with sensor calibration and as-built geometry, not vendor selection
- For commercial systems above 100 kWp, the payback case is now real, mostly because twin software costs have dropped 60 percent in three years and design tools now export ready-to-use geometry
- For residential, push your installer to deliver a 3D as-built model with the system; even if you do not run a twin today, the geometry is the irreplaceable input you cannot recreate later
Frequently Asked Questions
What is a solar digital twin?
A solar digital twin is a live virtual replica of a PV plant that combines a 3D model of the modules, racking, terrain, and electrical design with real-time sensor data from inverters, weather stations, and SCADA. The twin continuously compares observed performance against simulated expected performance, flagging deviations the moment they appear instead of weeks later in a monthly report.
How does a solar digital twin work in real time?
The physical plant streams telemetry through IoT gateways into the twin every 1 to 15 seconds. A physics-based simulation engine calculates expected output for the same conditions, an analytics layer compares the two values, and a 3D viewer visualises the delta down to the string or panel level. Operators see anomalies on a colour-coded map within seconds of them occurring.
How much performance gain can a solar digital twin deliver?
Operators typically report capacity factor improvements of 3 to 15 percent and O&M cost reductions of 10 to 30 percent within the first year. The wider range reflects plant age, monitoring maturity, and how much technician travel the twin replaces. New plants with strong monitoring see smaller gains, while older plants with manual workflows see the biggest jump.
What sensors are needed to build a solar digital twin?
At minimum, a twin needs string-level inverter data, a calibrated pyranometer, ambient and module temperature sensors, and wind speed. Higher-fidelity twins add module-level monitors, soiling sensors, IV curve tracers, and aerial thermography. The 3D geometry comes from drone photogrammetry or LiDAR scans of the as-built site.
What is the difference between SCADA and a digital twin?
SCADA collects and displays current values from field devices. A digital twin runs a parallel physics simulation of what should be happening, then compares that against the SCADA feed. SCADA tells you the inverter is producing 480 kW. The twin tells you it should be producing 510 kW given the irradiance, terrain, and shade pattern at this exact moment.
Can residential solar systems use digital twin technology?
Yes, although residential twins are simpler. They typically rely on inverter telemetry plus a virtual irradiance model derived from satellite data, instead of a dedicated weather station. Several monitoring platforms now offer twin-style features for systems as small as 5 kWp by combining manufacturer data sheets with location-based weather feeds.
How accurate are digital twin energy yield predictions?
Well-calibrated twins reach a mean absolute percentage error below 3 percent on 24-hour-ahead forecasts and below 5 percent on month-ahead forecasts. Accuracy improves as the twin learns the site’s specific soiling, degradation, and inverter clipping behaviour. Most platforms reach steady-state accuracy after 6 to 12 months of operating data.
Are solar digital twins worth the cost for a 5 MW plant?
For a 5 MW plant, twin software typically costs $2 to $4 per kWp per year. At a 14 percent capacity factor and $0.05 per kWh wholesale price, even a 2 percent yield gain pays back the software in the first quarter. The ROI case strengthens further when you factor in avoided truck rolls and warranty claim evidence.


