Quick Answer
Agrivoltaics design requires 3–5 meter panel height, 2–3x row spacing versus standard ground-mount, and semi-transparent or elevated panels. Compatible crops include leafy greens, berries, and grazing pasture. GHI reduction under panels is 30–50%, requiring shade-tolerant crops.
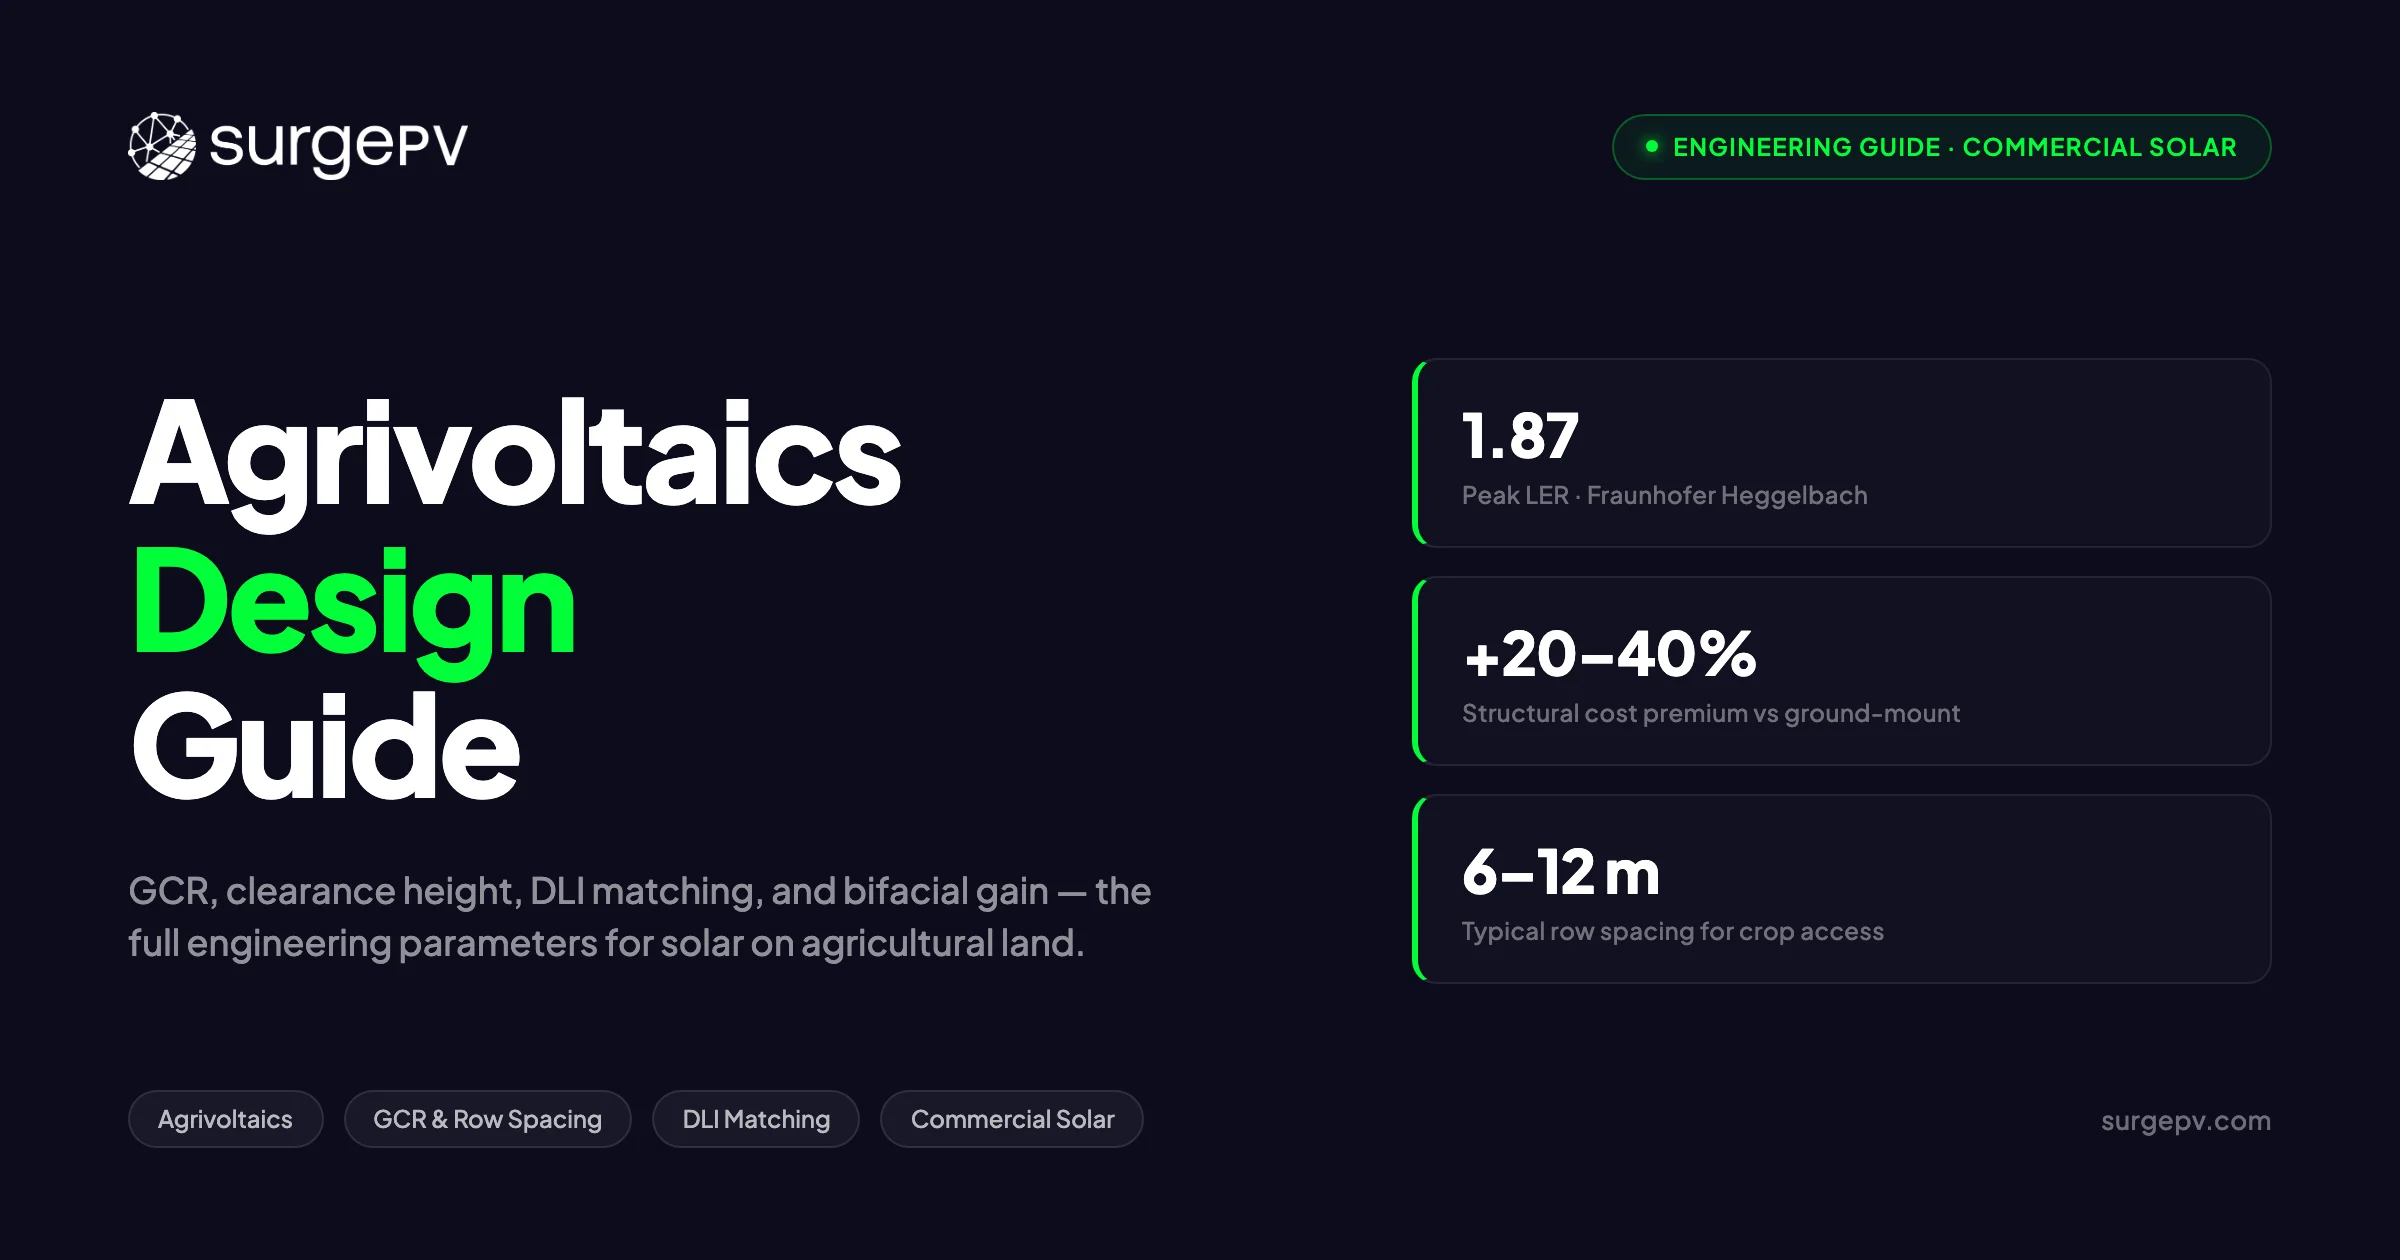
Agrivoltaics has moved past the pilot phase. As of late 2024, roughly 10 GW of agrivoltaic installations were operational across the U.S. alone, spanning nearly 600 sites (NREL, 2025). Globally, PV-plus-crop systems accounted for approximately 2.8 GW of operational capacity by 2020 — with China holding 1.9 GW of that total — and growth since has been steep (Fraunhofer ISE, 2020). The Fraunhofer ISE Heggelbach project in Germany recorded a Land Equivalent Ratio of 1.56–1.87, meaning the same land produced the equivalent of 56–87% more agricultural and energy output combined than the same acreage could deliver in two separate mono-use systems (Trommsdorff, IEA PVPS, 2020). Also see: Germany solar subsidies.
Agrivoltaics design requires 3–5 meter panel height, 2–3x row spacing versus standard ground-mount, and semi-transparent or elevated panels. Compatible crops include leafy greens, berries, and grazing pasture. GHI reduction under panels is 30–50%, requiring shade-tolerant crops.
But the engineering that produces those results is not standard ground-mount engineering with a taller racking system bolted on. Agrivoltaics imposes three design constraints that conventional ground-mount ignores entirely: light sharing rather than pure irradiance capture, vertical clearance for agricultural equipment rather than just mower access, and land use co-optimization rather than maximum DC density. Getting any one of these wrong produces a system that looks fine on an energy model and fails in the field — either because the crop is shade-stressed or because the combine cannot get under the panels at harvest.
This guide covers the engineering parameters from the ground up: GCR selection, mounting topology choices, clearance height tiers, row-spacing math, DLI-to-crop matching, bifacial gain under elevated mounting, three worked design examples, and a cost premium breakdown by structure type. For the full background on what agrivoltaics is and why it exists, see the encyclopedic primer at /hub/solar-technology/agrivoltaics. This guide starts where that one ends — at the design table. If you are modeling these systems in a solar design software that handles both energy yield and ground-level irradiance distribution — and packaging the case in solar proposal software for the landowner — the sections on DLI verification and bifacial gain are directly actionable.
TL;DR — Agrivoltaics Design Parameters
Key design targets: GCR 0.2–0.3 for crop-friendly layouts (vs 0.5–0.6 standard ground-mount); row spacing 6–12 m for tractor and combine access; panel clearance 1.5–5.5 m depending on equipment tier; cost premium +20–40% over conventional fixed-tilt. Fraunhofer ISE Heggelbach achieved LER 1.56–1.87 for potatoes, wheat, and celeriac. Mazzeo et al. (2025) found peak LER 2.05 for lettuce at GCR 0.2–0.3 and 2.5 m clearance. (Sources: NREL TP-6A20-77811, 2020; Trommsdorff, IEA PVPS, 2020; Mazzeo et al., Applied Energy, 2025)
In this guide:
- Why agrivoltaics design diverges from standard ground-mount across three core constraints
- The 6 design parameters that define every agrivoltaic system, with ranges and trade-offs
- Four mounting topologies and when to use each — with a comparison table
- Ground Coverage Ratio math and the row-spacing formula tied to tractor turning radius
- Panel clearance height by crop class and equipment tier
- Daily Light Integral (DLI) requirements by crop and how to calculate DLI under panels
- Bifacial gain under elevated mounting: albedo, view factor, and height effect
- Three worked design examples — leafy greens, berry orchard, sheep pasture
- Structural cost premiums by system type with $/W ranges
- Land Equivalent Ratio: the formula, real-world benchmarks, and bankability thresholds
- The seven most common agrivoltaic design mistakes
Agrivoltaics in One Paragraph: Why Design Diverges from Standard Ground Mount
Standard ground-mount solar has one optimization objective: maximize kWh per hectare. GCR runs 0.5–0.6, row spacing is set just wide enough for a ride-on mower, and clearance height needs only to clear vegetation. The energy model is the whole design. Agrivoltaics adds three constraints that standard tools do not handle.
Light sharing. Every watt of irradiance that panels intercept is a watt not reaching the crop canopy. Designing for both requires a GCR that balances panel density against crop photosynthetic demand — a number the standard energy model ignores entirely. INRAE synthesis (2023) found that GCR above 0.25 is “not advisable if crop yield is to be maintained” for most shade-sensitive crops.
Vertical clearance for equipment. Standard ground-mount clearance of 0.3–0.5 m keeps wiring off the ground and allows mowing. An agrivoltaic system on arable farmland needs 4.5–5.5 m to allow combine harvesters — a structural specification that requires substantially heavier piles and wider footings. The clearance decision is made at the design stage, not the construction stage; changing it post-installation is not economically viable.
Co-optimized land use. Standard solar design asks: “What is the maximum DC array I can fit on this land?” Agrivoltaic design asks: “What is the GCR, row pitch, and clearance combination that maximizes Land Equivalent Ratio given this crop’s light and machinery requirements?” The two questions lead to very different layouts.
The table below summarizes how these three divergences translate into concrete parameter differences.
| Design dimension | Standard ground-mount | Agrivoltaic system |
|---|---|---|
| GCR | 0.50–0.60 | 0.20–0.30 |
| Row spacing | 3–5 m | 6–12 m |
| Clearance height | 0.3–0.5 m | 1.5–5.5 m |
| Light optimization target | Irradiance capture only | Irradiance sharing (energy + crop DLI) |
| Structural cost premium | Baseline | +20–40% (or more for tall stilted systems) |
The Six Design Parameters That Define Every Agrivoltaic System
Every agrivoltaic system is defined by six parameters set during the design phase. Changes to any one affect all the others. Here is the full set with recommended ranges.
1. Ground Coverage Ratio (GCR) — 0.20–0.30 for agrivoltaics. GCR is the ratio of panel area to total land area. Standard ground-mount targets 0.50–0.60. For agrivoltaics, keeping GCR at 0.20–0.30 maintains enough light transmission to support most shade-tolerant and semi-tolerant crops. Mazzeo et al. (Applied Energy, 2025) found peak LER of 2.05 for lettuce at GCR 0.20–0.30.
2. Mounting topology — vertical bifacial, elevated fixed-tilt, SAT, or stilted high-clearance. Topology determines the shade pattern, energy yield, and equipment access options. Each type suits different crop-and-climate combinations, covered in full in the next section. Read Bifacial Solar Panel Design Guide for a complete walkthrough.
3. Panel clearance height — 1.5 m to 5.5 m. Height is the structural cost driver. Clearance must match the tallest piece of equipment that will operate under the panels, including any future crop rotation.
4. Row spacing — 6–12 m. Row spacing must accommodate tractor width, implement width, and the turning radius headland at row ends. Typical agrivoltaic row spacing ranges 6–12 m center-to-center depending on crop type and machinery. This is the parameter most commonly under-specified by designers unfamiliar with agricultural operations.
5. Panel transmissivity — 10–40% for crop systems; 0% for standard. Opaque bifacial modules transmit no light through the module face but leave light gaps between modules and between rows. Semi-transparent modules (transmittance 0–0.30 per INRAE, 2023) distribute diffuse light more evenly but sacrifice rear-side gain. The choice depends on whether uniform light distribution or bifacial energy boost takes priority.
6. Tilt and azimuth — flatter tilts for better light distribution. Steeper tilt angles concentrate shade directly below the panel string. Shallower tilts at the same GCR spread the shade footprint over more ground area, giving crops more hours of direct light per day. In agrivoltaic systems optimizing for crop yield, tilt angles of 10–20° are common even at latitudes where 30–35° would maximize energy yield.
| Parameter | Standard ground-mount | Agrivoltaic range | Key constraint |
|---|---|---|---|
| GCR | 0.50–0.60 | 0.20–0.30 | Crop light demand |
| Mounting type | Fixed-tilt or SAT | Fixed / SAT / Vertical / Stilted | Crop + equipment type |
| Clearance height | 0.3–0.5 m | 1.5–5.5 m | Machinery height |
| Row spacing | 3–5 m | 6–12 m | Tractor turning radius |
| Transmissivity | 0% (opaque) | 10–40% (semi-transparent) or gap-only | Crop DLI floor |
| Tilt angle | Latitude-optimized | Often 10–20° (crop-priority) | Light uniformity |
Mounting Topologies: Four Systems and When to Use Each
Mounting topology is the first structural decision. It determines the shade pattern shape, the achievable clearance height, the bifacial gain potential, and the cost. Four topologies cover the vast majority of operational agrivoltaic systems.
| Topology | Panel height | Typical GCR | Cost vs standard $/W | Light penetration | Best crop fit | Notes |
|---|---|---|---|---|---|---|
| Elevated fixed-tilt | 2–3 m | 0.20–0.30 | +$0.07–$0.20/W | Moderate | Berries, leafy greens, herbs | Most common topology in EU and U.S. |
| Stilted high-clearance | 4–5.5 m | 0.20–0.30 | +$0.30–$0.80/W | High | Row crops, arable, combine harvest | Common in Japan; Heggelbach uses 5.5 m |
| Vertical bifacial | 1.5–2 m | 0.20–0.25 | +$0.10–$0.25/W | Very high (above 90% midday) | Pasture, arable, vineyards | East-west orientation; no midday shade |
| Single-axis tracking | 2–3 m (elevated SAT) | 0.25–0.35 | +$0.40–$0.70/W | Variable; programmable | Heat-stressed crops, energy-priority | Dynamic shading control possible |
Elevated fixed-tilt (2–3 m) is the most common topology in Europe and the U.S. for food-crop agrivoltaics. The structure is straightforward to engineer — essentially standard ground-mount racking with longer piles and an elevated torque tube. Panels face south at a moderate tilt (10–20° for crop-priority, up to 30° for energy-priority). Shade falls in predictable static strips, which simplifies DLI modeling. NREL InSPIRE data from Jack’s Solar Garden shows this approach working well for mixed vegetables at approximately 1.8–2.4 m clearance with fixed-tilt panels (NREL, 2024). Also see: European Solar Incentives.
Stilted high-clearance (4–5.5 m) is the topology used when full mechanized farming must continue under the array. The Fraunhofer ISE Heggelbach research station in Baden-Württemberg, Germany, used a stilt-mounted system with 5.5 m working clearance — enough for standard combine harvesters. This topology is the dominant form in Japan (670 MW installed by 2024) where rice and vegetable mechanization requires full-height access. The structural cost premium is substantial: piles extend 4–6 m above grade, foundations are deeper and wider, and bracing requirements increase significantly (NREL TP-6A20-77811, 2020). Read more about Community Solar Projects Germany.
Vertical bifacial panels are mounted in an east-west orientation, facing 90° from horizontal, at 1.5–2 m height. At noon, panels are edge-on to the sun, casting virtually no shade on the ground below. At morning and evening, the east-facing and west-facing sides each receive direct irradiance, producing a characteristic morning-peak and evening-peak generation profile. Ground-level irradiance stays above 80–90% of unshaded values throughout the midday period. This makes vertical bifacial well-suited to crops that need full midday sun — pasture grass, arable crops, and vineyards. A sheep grazing scenario (discussed in Worked Example 3) fits particularly well: animals graze freely all day, and the panel rows become windbreak structures.
Single-axis tracking (elevated SAT) adds approximately 15–25% energy output versus fixed-tilt at the same GCR. The tracker tilts panels throughout the day, which means the shade pattern rotates as well. For heat-stressed crops, this is a benefit — shade migrates rather than sitting permanently on the same row section. Advanced “agronomic tracking” firmware from providers can prioritize crop light during critical phenological stages (e.g., flowering, silking) and revert to solar-tracking at other times. The cost premium is the highest of the four topologies, driven by motor systems, elevated pylon fabrication, and controller infrastructure.
Ground Coverage Ratio and Row Spacing: The Math
The GCR formula:
GCR = module area (m²) / total land area (m²)
For a fixed-tilt row, this simplifies to:
GCR ≈ module width / row pitch
Where row pitch is the center-to-center distance between panel rows. A 2 m wide module at GCR 0.25 requires a row pitch of 8 m.
Why GCR above 0.25 hurts crop yield:
Every percentage point of ground covered by panels is a percentage point of irradiance lost to the crop below. The relationship is approximately linear for opaque modules: a GCR of 0.50 blocks roughly 50% of incoming light over the entire site area. Since most crops cannot maintain target yield at below 50% of full sun, a GCR of 0.50 is incompatible with most food crop production. INRAE (2023) stated that GCR “not advisable if yield is to be maintained” exceeds 0.25 for most shade-sensitive cultivars.
Row-spacing calculation: the tractor constraint:
Row spacing is not just a function of GCR. It must also satisfy the minimum turning radius of any agricultural machinery operating on the site. A standard 2-wheel-drive compact tractor with a vegetable transplanter requires approximately 7.5 m turning radius; minimum aisle width for a medium tractor with seed drill is approximately 4 m; 10 m of headland space is needed at row ends for full turns.
The design flow:
- Determine the widest implement that will operate between rows — typically a tractor with plough or spray equipment.
- Set minimum aisle width to implement width plus at least 0.5 m clearance on each side.
- Confirm the headland at row ends meets the turning circle requirement (minimum 8–10 m for most tractors with implements).
- Back-calculate maximum GCR from the resulting row pitch.
Row pitch reference table:
The table below shows row pitch (center-to-center, meters) as a function of GCR and module width. Shaded cells indicate configurations that do not provide minimum tractor aisle of 4 m.
| GCR | 2.0 m module width | 2.1 m module width | 2.5 m module width |
|---|---|---|---|
| 0.20 | 10.0 m | 10.5 m | 12.5 m |
| 0.25 | 8.0 m | 8.4 m | 10.0 m |
| 0.30 | 6.7 m | 7.0 m | 8.3 m |
| 0.35 | 5.7 m | 6.0 m | 7.1 m |
At GCR 0.25 with a 2.0 m module, row pitch is 8 m, giving a 6 m aisle (8 m pitch minus 2 m module width). That passes the 4 m minimum aisle requirement and provides room for most standard tractors. At GCR 0.30 with the same module, pitch drops to 6.7 m and the aisle narrows to 4.7 m — still viable for most compact tractors, but too tight for a tractor pulling wide implements.
Panel Clearance Height by Crop Class and Equipment
Clearance height is the structural cost driver that most EPCs under-specify on first-pass agrivoltaic designs. Setting it for today’s crops without considering planned rotation is the most expensive design mistake on this list.
The four clearance tiers and their implications:
| Tier | Clearance height | Crop and use examples | Equipment type | Structural cost note |
|---|---|---|---|---|
| 1 — Grazing and ground cover | 1.5–2.0 m | Pasture grass, sheep, pollinator habitat, low ground cover | Ride-on mower, sheep | Lowest cost; minimal pile extension over standard ground-mount |
| 2 — Hand-harvest and small mechanized | 2.0–3.0 m | Lettuce, spinach, strawberries, herbs, berries | Hand tools, small tractor, ATV | Moderate cost premium; most common for food-crop agrivoltaics |
| 3 — Row crop mechanized | 3.5–4.5 m | Staked tomatoes, cucumbers, peppers, tall vegetable crops | Standard tractor with plough, sprayer | Significant pile depth and bracing required |
| 4 — Arable and combine harvest | 4.5–5.5 m | Wheat, barley, soy, corn, celeriac, potatoes | Combine harvester, large tractor | Highest cost; requires engineered pile foundations |
NREL benchmark designs use 2.5 m (8.2 ft) as the reference stilt-mount height for crop agrivoltaics (NREL TP-6A20-77811, 2020). Cereal cropping with large combine harvesters requires at least 4–5 m clearance. The Heggelbach project used 5.5 m to ensure full operability of standard German arable machinery (Trommsdorff, IEA PVPS, 2020).
Cost implication of height tiers:
Each additional meter of pile height above Tier 1 increases steel consumption significantly and pushes foundation engineering into reinforced concrete territory at 4 m and above. The NREL bottom-up cost model (2020) documents the full range: +$0.07/W for the most basic elevated structure to +$0.80/W for heavily reinforced stilted high-clearance configurations. CAPEX for a U.S. reinforced agrivoltaic structure has been reported at up to $2.33/W — approximately 52% above conventional solar park pricing — for the most structurally demanding designs (as of March 2026).
The rotation problem:
A farm that currently grows lettuce (Tier 2, 2–3 m clearance) and plans to introduce wheat (Tier 4, 4.5–5.5 m clearance) in year 5 of a 25-year project has a fundamental design conflict if clearance was set to Tier 2 at installation. Agrivoltaic systems are not practically modifiable after construction. The clearance height must be set at the design stage to the maximum tier the landowner anticipates using across the full project life.
Matching Panel Transmissivity to Crop DLI Requirements
What is Daily Light Integral?
Daily Light Integral (DLI) measures the cumulative amount of photosynthetically active radiation (PAR) a crop surface receives over a full day. The unit is moles of photons per square meter per day (mol/m²/day). DLI is the single most useful agronomic number for agrivoltaic design because it integrates cloud cover, sun angle, panel shading, and season into one crop-usable figure. Also see: Us Residential Solar Market Trends 2026.
Each crop species has a minimum DLI below which it cannot maintain target yield, and a Light Saturation Point (LSP) — the irradiance level above which additional light produces no further photosynthetic gain. Crops with low LSPs are well-suited to agrivoltaics because they do not need full-sun irradiance to produce commercially viable yields.
DLI requirements by crop:
| Crop | Min DLI (mol/m²/day) | Optimum DLI (mol/m²/day) | LSP (µmol/m²/s) | Shade tolerance | Notes |
|---|---|---|---|---|---|
| Lettuce | 12–17 | 14–20 | 200–400 | High | 20–40% transmission fine; excellent agrivoltaic crop |
| Spinach | 14–20 | 16–22 | 200–500 | High | Performs well under elevated fixed-tilt |
| Basil | 15–25 | 18–25 | 300–500 | High | Heat and drought stress reduced under panels |
| Strawberries | 12 (min); 15–25 (optimum) | 20–25 | 400–600 | Medium | Performs well in Pacific Northwest under 3 m clearance |
| Peppers | 20–30 | 22–30 | 500–800 | Low-medium | Needs GCR below 0.25 and high clearance |
| Tomatoes | 20–30 | 22–30 | 700–1,000 | Low | High clearance required; heat-stress benefit offsets shade loss in hot climates |
| Corn (maize) | 20 | 30–40 | 1,000–1,500 | Very low | Only viable at GCR below 0.20 with 4.5 m+ clearance |
| Wheat / barley | 30–50 | 35–50 | 1,000–1,500 | Very low | Requires stilted high-clearance plus GCR below 0.20 |
| Pasture grass | 6–20 | 12–20 | 200–800 | Medium | Most tolerant of the common agrivoltaic understories |
(Sources: University of Florida IFAS Extension; Iowa State University Extension; agronomic literature)
How to calculate DLI under panels:
The working formula is:
DLI_under = DLI_ambient × (1 − shade_fraction)
Where shade_fraction is the proportion of the crop surface that is in panel shadow during peak sunlight hours, averaged over the growing season. For a GCR of 0.25 at moderate latitudes, shade_fraction typically runs 0.25–0.35 depending on tilt and row orientation.
Worked DLI example — lettuce in California:
Summer ambient DLI in California’s Central Valley runs approximately 40–50 mol/m²/day. A GCR 0.25 elevated fixed-tilt system at 15° tilt and 8 m row pitch produces a shade fraction of approximately 0.30 during peak growing season. Applying the formula:
DLI_under = 40 × (1 − 0.30) = 28 mol/m²/day
Lettuce minimum DLI is 12–17 mol/m²/day. At 28 mol/m²/day the crop is well above its minimum and also below the level where heat stress typically affects quality. This explains why California lettuce is one of the highest-performing agrivoltaic food crops — ambient DLI is high enough that even with 30% shade reduction, the under-panel DLI stays in the sweet spot.
Transmissivity vs bifacial trade-off:
Semi-transparent modules transmit 10–30% of incoming irradiance through the module face (INRAE, 2023). This provides more uniform light distribution across the crop bed. However, semi-transparent modules have no functional rear side, eliminating bifacial gain. Opaque bifacial modules in a standard gap-and-row configuration transmit 0% through the module face but leave substantial gap light between modules and between rows. For crops that tolerate some shade patchiness (leafy greens, strawberries), opaque bifacial modules are often the better engineering choice because they preserve rear-side energy gain without sacrificing total DLI meaningfully.
The solar shadow analysis software used to verify DLI targets should model hourly ground-irradiance maps — not just annual energy yield — so that shade fraction can be calculated at the crop level rather than the module level.
Design your agrivoltaic system before breaking ground
SurgePV’s shadow analysis tool models hourly irradiance across panel rows and crop zones — so you know DLI targets are met before structural specs are locked.
Book a DemoNo commitment required · 20 minutes · Live project walkthrough
For a direct comparison, see Arka 360 vs SurgePV.
Bifacial Gain Under Elevated Mounting
Elevated agrivoltaic mounting creates conditions that are favorable for bifacial modules — often more favorable than standard ground-mount, where panels sit close to the ground and the rear-side view factor is constrained by the proximity to soil.
Why elevation improves bifacial gain:
The rear side of a bifacial module receives light from reflected and diffuse radiation from the ground and surrounding environment. The fraction of that light that reaches the rear side depends on two factors: the albedo of the ground surface and the view factor — the geometric proportion of the hemisphere below the module that is “seen” as ground rather than panel or structure. At 0.3–0.5 m height (standard ground-mount), the view factor is dominated by nearby soil and structure. At 2–4 m height (agrivoltaic), the module rear can see a wider area of ground, improving the effective albedo contribution.
Ground surface albedo values:
| Surface | Albedo (reflectivity) |
|---|---|
| Bare soil | 0.15–0.20 |
| Grass / pasture | 0.20–0.23 |
| Light gravel / sand | 0.25–0.35 |
| Concrete | 0.30–0.35 |
| Snow (fresh) | 0.70–0.85 |
Bifacial gain by height and surface — estimated:
| Height | Bare soil (~0.17 albedo) | Grass (~0.22 albedo) | Light gravel (~0.30 albedo) |
|---|---|---|---|
| 0.5 m (standard ground-mount) | 3–4% | 4–5% | 6–8% |
| 1.0 m | 4–5% | 5–6% | 7–9% |
| 2.0 m | 5–7% | 6–9% | 9–12% |
| 3.0 m | 6–8% | 7–9% | 10–13% |
(Sources: Tongwei, 2023; NREL/PVEL field testing)
The bifaciality formula:
P_rated_bifacial = P_front + (albedo × bifaciality_factor × P_rear)
Where bifaciality_factor is typically 0.65–0.80 for standard bifacial modules. For a module with P_front = 400 W, P_rear = 380 W (bifaciality 0.95), grass albedo 0.22, and height 2 m with estimated view factor contribution of 0.22:
P_rear_contribution = 0.22 × 0.95 × 380 × 0.35 (view factor fraction) ≈ 27.8 W additional
This gives approximately 7% rear-side gain on a grass surface at 2 m — consistent with field data from NREL/PVEL (low-reflection surface range of 5–7%).
NREL recommends a minimum 0.5 m clearance for any bifacial rear-side gain to register; 1.0–1.5 m is optimal for commercial ground-mount; and gains above 1.5 m see diminishing marginal returns. Agrivoltaic systems operating at 2–4 m clearance are well within the range where bifacial gain is meaningful and consistent.
Three Worked Design Examples
Example 1: Shade-Tolerant Leafy Greens (Lettuce, 6 kW/acre System)
Site: 1-acre farm, Central California. Annual ambient DLI in summer: approximately 42 mol/m²/day. Electricity tariff: $0.22/kWh.
Crop: Butter lettuce. Minimum DLI: 12–17 mol/m²/day. LSP: ~300 µmol/m²/s. High shade tolerance.
Design parameters:
- Mounting: Elevated fixed-tilt, 2.5 m clearance (Tier 2 — hand harvest and small tractor)
- GCR: 0.25
- Module: 400 W bifacial, 2.0 m wide
- Row pitch: 8.0 m (GCR = 2.0 / 8.0 = 0.25)
- Aisle width: 6.0 m (sufficient for hand carts and small electric tractor)
- Tilt: 15°
Energy output:
- DC capacity: approximately 6 kW/acre (constrained by GCR, not land area)
- Estimated annual energy yield: approximately 9,000 kWh/acre (using California DNI and 15% system losses)
- Annual energy revenue at $0.22/kWh: approximately $1,980/acre
DLI check:
- Shade fraction at GCR 0.25 and 15° tilt: approximately 0.28
- DLI_under = 42 × (1 − 0.28) = 30.2 mol/m²/day
- Lettuce minimum: 12–17 mol/m²/day. Pass — significant headroom.
Structural cost premium: approximately 25% above standard fixed-tilt ground-mount, driven by longer piles and elevated racking.
LER estimate: approximately 1.30. The system produces both commercially viable lettuce yield and ~9,000 kWh/acre annually.
Reference data: Mazzeo et al. (Applied Energy, 2025) simulated LER 1.04–2.05 for lettuce at GCR 0.20–0.30 and 2.5 m clearance — this site’s parameters fall within that study’s optimum range.
Example 2: Berry Orchard + Bifacial Elevated (100 kW System)
Site: 5-acre strawberry farm, Pacific Northwest. Annual ambient DLI in summer: approximately 30 mol/m²/day (lower irradiance than California; cooler climate). Electricity tariff: $0.18/kWh.
Crop: Strawberries. Minimum DLI: 12 mol/m²/day. Optimum: 15–25 mol/m²/day. Medium shade tolerance.
Design parameters:
- Mounting: Elevated fixed-tilt, 3.0 m clearance (allows small tractor + spray equipment)
- GCR: 0.22
- Module: 440 W bifacial (monocrystalline, bifaciality factor 0.70)
- Row pitch: approximately 9.1 m (GCR = 2.0 / 9.1 ≈ 0.22)
- Ground cover: grass/organic mulch between rows
- Tilt: 20°
Energy output:
- DC capacity: approximately 100 kW across 5 acres
- Bifacial gain on grass at 3 m height: approximately 7% (using grass albedo 0.22 and height data from field studies)
- Estimated annual energy yield: approximately 120,000 kWh (100 kW system × 1,200 specific yield for Pacific Northwest)
- Annual energy revenue at $0.18/kWh: approximately $21,600
DLI check:
- Shade fraction at GCR 0.22 and 20° tilt: approximately 0.25
- DLI_under = 30 × (1 − 0.25) = 22.5 mol/m²/day
- Strawberry optimum DLI: 15–25 mol/m²/day. Pass — at top of optimum range.
Crop co-benefit: Strawberries in the Pacific Northwest frequently experience heat stress during July–August peaks that reduces berry quality and shelf life. Partial shading at 3 m elevation reduces heat stress on fruit. University of Arizona / NREL InSPIRE research (Barron-Gafford et al., Nature Sustainability, 2019) showed that shade from solar panels reduced plant water stress and improved fruit quality metrics in dryland climates. Pacific Northwest benefit is moderate but measurable.
Structural cost premium: approximately 30% above standard ground-mount, driven by 3 m pile height and bifacial glass module cost.
25-year revenue profile: approximately $540,000 in energy revenue (undiscounted) plus premium berry yield value from reduced heat stress. LER estimated at approximately 1.35–1.50 based on crop and climate parameters.
Example 3: Sheep Grazing Pasture + Vertical Bifacial (1 MW System)
Site: 50-acre sheep pasture, UK or Northern Europe. Annual ambient DLI: approximately 15–25 mol/m²/day (seasonal range). Electricity tariff: £0.28/kWh. For the latest details on UK, see Battery Solar System Design UK. Read more about Heritage Building Solar Case Study. For Europe-specific compliance details, see Europe solar compliance.
Co-use: Sheep grazing (approximately 100–150 animals). No crop harvest machinery required.
Design parameters:
- Mounting: Vertical bifacial, east-west orientation
- Clearance: 1.8 m (sheep clearance; no combine access needed)
- GCR: 0.22 (east-west orientation; GCR calculated on module area / total land area)
- Module: 440 W bifacial glass-glass, mounted vertically on fence-post style galvanized steel frames
- Row spacing: 7–8 m north-south between vertical panel rows
Energy output and daily pattern:
- DC capacity: approximately 1 MW across 50 acres
- Annual energy yield: approximately 750,000–850,000 kWh (vertical east-west at UK latitude yields approximately 75–85% of equivalent south-facing fixed-tilt)
- Daily generation profile: morning peak (east face), midday near-zero, evening peak (west face). This matches grid demand peaks and reduces midday overgeneration relative to south-facing fixed-tilt. For more on this topic, see Design Commercial Solar System 1MW. For United Kingdom-specific compliance details, see United Kingdom comparisons/mcs-vs-non-mcs.
Light penetration:
- At solar noon, panels are edge-on to the sun — ground-level irradiance exceeds 90% of unshaded reference.
- Sheep graze freely through midday with full light access.
- Pasture DLI: cool-season grasses maintain yield at DLI of 6–20 mol/m²/day. At 90%+ midday transmission, DLI is near-ambient. Pass — very comfortably.
Water savings: NREL InSPIRE data documents 14–29% reduction in water evaporation from soil under solar panels in dryland conditions (Barron-Gafford et al., 2019; Dinesh and Pearce, 2016). In a wetter UK climate the absolute water saving is smaller, but reduced evapotranspiration from partial shading supports pasture drought resilience.
Vegetation management: Sheep are the vegetation management system here, reducing O&M costs substantially. The U.S. Solar Grazing Census (2024/2025) documents approximately 113,050 sheep grazing 129,000 acres across 500+ solar sites nationally.
Soil health: Research at grazed solar sites found organic matter, predicted soil protein, and active carbon significantly higher at grazed solar sites than non-grazed sites.
LER: approximately 1.56, using Heggelbach pasture baseline (Trommsdorff, IEA PVPS, 2020). Pasture grass has high shade tolerance, which explains why grazing agrivoltaics consistently achieves high LER values.
Structural cost premium: approximately 20% above standard ground-mount. Vertical bifacial systems use a simpler, lighter structural frame than elevated fixed-tilt (no tilt angle means no wind torque on the structure), partially offsetting the cost of dual-glass bifacial modules.
Structural and Cost Premium: What to Budget
The cost premium for agrivoltaic mounting over conventional ground-mount fixed-tilt is the most frequently underestimated variable in early-stage feasibility analysis. Accurate capex modeling starts with a reliable solar design software that incorporates structural specification by clearance tier — not a single aggregate markup applied to all agrivoltaic system types.
Cost premium by system type:
| System type | Installed cost premium vs standard $/W | LCOE benchmark | Source |
|---|---|---|---|
| Standard ground-mount fixed-tilt (baseline) | — | ~$0.85–$1.10/W | NREL cost benchmarks |
| Elevated fixed-tilt 2–3 m | +$0.07–$0.20/W | ~0.08 €/kWh (grassland EU) | NREL TP-6A20-77811, 2020 |
| Vertical bifacial | +$0.10–$0.25/W | Similar to elevated fixed-tilt | Industry estimates |
| Stilted high-clearance 4–5.5 m | +$0.30–$0.80/W | ~0.12 €/kWh (arable EU) | NREL TP-6A20-77811, 2020 |
| Single-axis tracking elevated | +$0.40–$0.70/W | Higher; partially offset by +15–25% energy | Industry estimates |
The cost premium range is wide — $0.07–$0.80/W — because the structural requirements vary enormously by clearance tier. Heavily reinforced U.S. agrivoltaic structures can reach $2.33/W installed, representing a 52% premium over conventional solar parks (as of March 2026).
The three cost drivers:
-
Post height and gauge. Taller posts require heavier gauge steel and deeper driven or bored foundations. At 4 m height, engineered pile foundations with reinforced concrete may be required.
-
Bifacial glass modules. Dual-glass bifacial modules cost approximately $0.02–$0.05/W more than standard monofacial modules. For agrivoltaic systems where bifacial gain is meaningful (grass albedo, 2+ m height), this premium pays back through additional generation. For systems under tree canopy or adjacent to tall vegetation, bifacial gain is reduced and the module cost premium may not be justified.
-
Foundation width for tall structures. A 5 m pile transfers significantly more wind moment load to the foundation than a 1 m pile. Spread footings or screw piles for tall stilted systems require wider bearing areas, adding materials and groundwork cost.
OPEX offsets:
Grazing vegetation management reduces O&M cost substantially compared to mechanical mowing and herbicide programs. For a 50-acre system, switching from conventional vegetation management to sheep grazing saves thousands of dollars per year in O&M.
Irrigation water savings of 14–50% (Barron-Gafford et al., 2019; Dinesh and Pearce, 2016) reduce operating cost on irrigated crop agrivoltaic sites, partially offsetting the structural cost premium over the project life.
Land Equivalent Ratio: Putting a Number on Co-Benefit
Land Equivalent Ratio (LER) is the core metric for demonstrating that an agrivoltaic system creates more value per hectare than two separate mono-use systems would on the same total land area.
The LER formula:
LER = (Y_crop_agrivoltaic / Y_crop_reference) + (Y_energy_agrivoltaic / Y_energy_reference)
Where:
- Y_crop_agrivoltaic = crop yield from the agrivoltaic site
- Y_crop_reference = crop yield from an equivalent area under conventional agriculture (no panels)
- Y_energy_agrivoltaic = energy output from the agrivoltaic array
- Y_energy_reference = energy output from an equivalent area under conventional ground-mount solar (no crops)
LER above 1.0 means the dual-use system is more land-efficient. LER of 1.56 means you would need 56% more land to produce the same combined output from two separate systems.
Documented LER benchmarks:
| Project | Location | Crop | LER | Year | Source |
|---|---|---|---|---|---|
| Fraunhofer ISE Heggelbach (APV-RESOLA) | Baden-Württemberg, Germany | Potato, wheat, celeriac, clover | 1.56–1.87 | 2017–2018 | Trommsdorff, IEA PVPS, 2020 |
| Mazzeo et al. simulation (best case) | Parametric (multiple) | Lettuce at GCR 0.20–0.30 | 2.05 | 2025 | Mazzeo et al., Applied Energy, 2025 |
| Mazzeo et al. simulation (baseline) | Parametric (multiple) | Lettuce at GCR 0.60 | 1.04 | 2025 | Mazzeo et al., Applied Energy, 2025 |
The Heggelbach project provides the most-cited real-world LER data. The LER reached 1.87 in 2018 — a drought year — because the panels reduced heat and water stress on the crops, improving yield while the solar array continued performing normally. In 2017 (a normal year), LER was 1.56. This drought-year uplift pattern appears at other sites too: agrivoltaic systems become relatively more productive under climate stress, not less.
Bankability thresholds:
Many project lenders and USDA grant programs treat LER above 1.3 as the minimum threshold for demonstrating dual-use viability in financing submissions. LER above 1.5 typically satisfies premium-land-use justifications required for agricultural zoning variances.
For detailed financial modeling of dual-revenue agrivoltaic projects — PPA structures, crop lease revenue, carbon credit stacking — see the agricultural solar guide at /hub/commercial-solar/agricultural-solar.
Pro Tip
Report LER at the design stage — not after installation. Run a shadow simulation to estimate shading loss per crop zone across the growing season, then model crop yield impact using the DLI reduction data. Most lenders and USDA grant programs require projected LER in the feasibility submission, not just post-harvest actuals. A design-stage LER projection produced by a bankable simulation is the document that gets the project financed.
Common Design Mistakes
Seven mistakes account for most post-installation agrivoltaic failures. All are preventable at the design stage.
-
Using standard ground-mount GCR (0.50+) on a food-crop site. GCR 0.50 blocks approximately half of incoming irradiance. Most food crops cannot maintain commercial yield at 50% light reduction. The system looks fine in the energy model and fails agronomically within one growing season. Correct: target GCR 0.20–0.25 for most food crops; confirm with a crop-specific DLI calculation.
-
Setting clearance height for current equipment, not future crop rotation. A 2.5 m clearance works for lettuce but not for wheat. If the landowner plans to rotate to grain crops in year 3, the installation at 2.5 m is permanently incompatible with combine harvesters. Correct: specify clearance for the highest-clearance crop or equipment anticipated across the full 25-year project life.
-
Ignoring tractor turning-radius headlands in row-spacing math. Row spacing is often calculated based on aisle width for straight-line tractor passes. But headlands — the space at row ends needed for turning — require approximately 8–10 m of open space. A row pitch of 8 m might provide adequate inter-row access but leave no room to complete the turn at the end of each row. Correct: design headland clearing explicitly before finalizing the layout.
-
Choosing semi-transparent bifacial glass for uniform light distribution without checking rear-side gain loss. Semi-transparent modules distribute light more evenly, which some agronomists prefer for uniform crop canopy development. But they eliminate rear-side bifacial gain. If the site’s grass or soil albedo justifies 5–9% bifacial gain from opaque modules, choosing semi-transparent can reduce annual energy output by that margin without a meaningful crop benefit. Correct: model both options using the site’s specific albedo and shade fraction.
-
Running energy simulation without a DLI check. A GCR of 0.30 at a high-irradiance site will produce a perfectly acceptable energy yield — and may simultaneously shade a DLI-sensitive crop below its minimum threshold. Standard energy simulation tools report kWh/year; they do not report mol/m²/day at ground level. Correct: use an irradiance map export from the shadow analysis tool to compute seasonal DLI under the array and compare against the crop minimum.
-
Overlooking foundation cost for taller posts. Early-stage feasibility models often apply a flat percentage markup for “agrivoltaic” without distinguishing between 2 m and 5 m clearance. The cost premium for a 5 m stilted high-clearance system can reach +$0.30–$0.80/W above standard ground-mount — a material difference on a 1 MW project. Correct: use clearance-tier-specific cost models from NREL TP-6A20-77811 or current industry data, not a generic “agrivoltaic premium.”
-
Filing for standard ground-mount permits. In the U.S., agrivoltaic systems on agricultural land often require USDA NRCS sign-off for the agricultural component and may require a separate special use permit or agricultural-use variance from the AHJ for the energy component. In the EU, Common Agricultural Policy (CAP) compliance paperwork for dual-use land is required to maintain subsidy eligibility. Filing under standard solar permitting paths can trigger post-approval stop-work orders when the agricultural use is discovered. Correct: identify the agrivoltaic permit pathway in the target jurisdiction before design work begins.
Conclusion
Agrivoltaics design is not standard ground-mount design with taller posts. The three decisions that determine whether a system works are: GCR (which sets the light budget for the crop), clearance height (which determines equipment and crop rotation options), and whether to use bifacial or semi-transparent modules (which determines whether you optimize for bifacial energy gain or uniform crop-canopy light distribution). Set any one of these incorrectly at the design stage, and the structural cost is fixed while the agricultural or energy performance falls short.
The six parameters — GCR 0.20–0.30, row spacing 6–12 m, clearance height 1.5–5.5 m, mounting topology, panel transmissivity, and tilt — interact. Row pitch follows from GCR and module width. Clearance height follows from crop rotation and equipment specification. Tilt follows from the balance between energy yield and light uniformity under the array.
Fraunhofer ISE’s Heggelbach data (LER 1.56–1.87) and Mazzeo et al.’s 2025 simulations (LER up to 2.05) confirm that the land productivity gain is real and measurable when the parameters are set correctly. It does not happen by default.
The solar shadow analysis software that simulates your crop-row geometry and verifies DLI targets is the difference between a site that performs as designed and one that requires a post-installation agronomic intervention. If you are scoping an agrivoltaic project now, the design-stage simulation is where that outcome is decided. Book a walkthrough at surgepv.com/demo to run your site through the shadow analysis and DLI verification before structural specs are locked.
Frequently Asked Questions
What is the ideal ground coverage ratio for agrivoltaics?
For most agrivoltaic systems, a GCR of 0.20–0.30 is recommended. INRAE research (2023) found that GCR above 0.25 is “not advisable if crop yield is to be maintained” for shade-sensitive crops. Mazzeo et al. (Applied Energy, 2025) found peak LER of 2.05 at GCR 0.20–0.30 for lettuce at 2.5 m clearance. Standard ground-mount solar typically uses GCR 0.50–0.60, which is incompatible with most food crop production.
How high should solar panels be for tractor access in an agrivoltaic system?
Clearance height depends on the equipment type. Sheep grazing and ground cover need 1.5–2 m. Standard tractor access for ploughing and spraying requires 3.5–4.5 m. Combine harvester clearance for cereal crops requires 4.5–5.5 m. The Fraunhofer ISE Heggelbach system used 5.5 m working clearance for full arable mechanization (Trommsdorff, IEA PVPS, 2020). Specify clearance based on the largest equipment anticipated across the full project life, not just current operations.
What crops grow best under solar panels?
Shade-tolerant crops with low daily light integral (DLI) requirements perform best. Lettuce (minimum DLI 12–17 mol/m²/day), spinach (14–20 mol/m²/day), basil (15–25 mol/m²/day), and strawberries (minimum 12 mol/m²/day) all tolerate the partial shading from a GCR 0.20–0.25 elevated fixed-tilt system without significant yield reduction. Wheat, barley, and corn require either very low GCR (below 0.20) or stilted high-clearance configurations to maintain commercial yields.
Is agrivoltaics more expensive than standard ground-mount solar?
Yes — typically 20–40% more expensive on a per-watt installed basis. NREL’s bottom-up model (TP-6A20-77811, 2020) documents premiums of $0.07–$0.80/W over standard ground-mount. Heavily reinforced structures can reach $2.33/W — 52% above conventional solar park pricing (as of March 2026). The cost premium is driven by pile height, foundation depth, and heavier gauge steel at elevated clearances.
What is the Land Equivalent Ratio in agrivoltaics, and what is a good LER target?
Land Equivalent Ratio (LER) measures how much separate land would be needed to produce the same combined energy and crop yield as the agrivoltaic system on a single plot. LER above 1.0 means the dual-use system is more land-efficient. The Fraunhofer ISE Heggelbach project recorded LER 1.56–1.87 across 2017–2018 for potatoes, wheat, and celeriac (Trommsdorff, IEA PVPS, 2020). Most lenders and USDA grant programs treat LER above 1.3 as the bankability threshold for dual-revenue models. LER above 1.5 typically satisfies agricultural zoning variance requirements for special-use permits.