Quick Answer
Neighborhood solar marketing uses bulk purchase programs to achieve 20–30% cost savings through volume discounts. Strategies include: neighborhood solarize campaigns, group buying co-ops, and referral incentives ($250–$500 per successful referral). Bulk programs can install 50–200 homes in a single community.
A solar installer in Tucson, AZ tracked their 2024 install locations on a map. The pattern was striking: 38% of their installs occurred within 0.5 miles of a prior install. The clustering wasn’t accidental — it was the result of intentional neighborhood marketing.
Neighborhood solar marketing uses bulk purchase programs to achieve 20–30% cost savings through volume discounts. Strategies include: neighborhood solarize campaigns, group buying co-ops, and referral incentives ($250–$500 per successful referral). Bulk programs can install 50–200 homes in a single community.
Neighborhood solar marketing uses bulk purchase programs to achieve 20–30% cost savings through volume discounts. Strategies include: neighborhood solarize campaigns, group buying co-ops, and referral incentives ($250–$500 per successful referral). Bulk programs can install 50–200 homes in a single community.
They averaged 16 installs per month and 6 of those installs (38%) came from neighborhoods where they had at least one prior install. Cost per acquired customer in cluster neighborhoods: $340. Cost per acquired customer in non-cluster neighborhoods: $1,180. The 3.5x cost difference compounded across their full year of revenue.
By the start of 2026, the same installer had completed 12+ installs in 31 different neighborhoods across Tucson. Each of those neighborhoods became permanent lead-generation territory.
Quick Answer: Neighborhood Solar Marketing
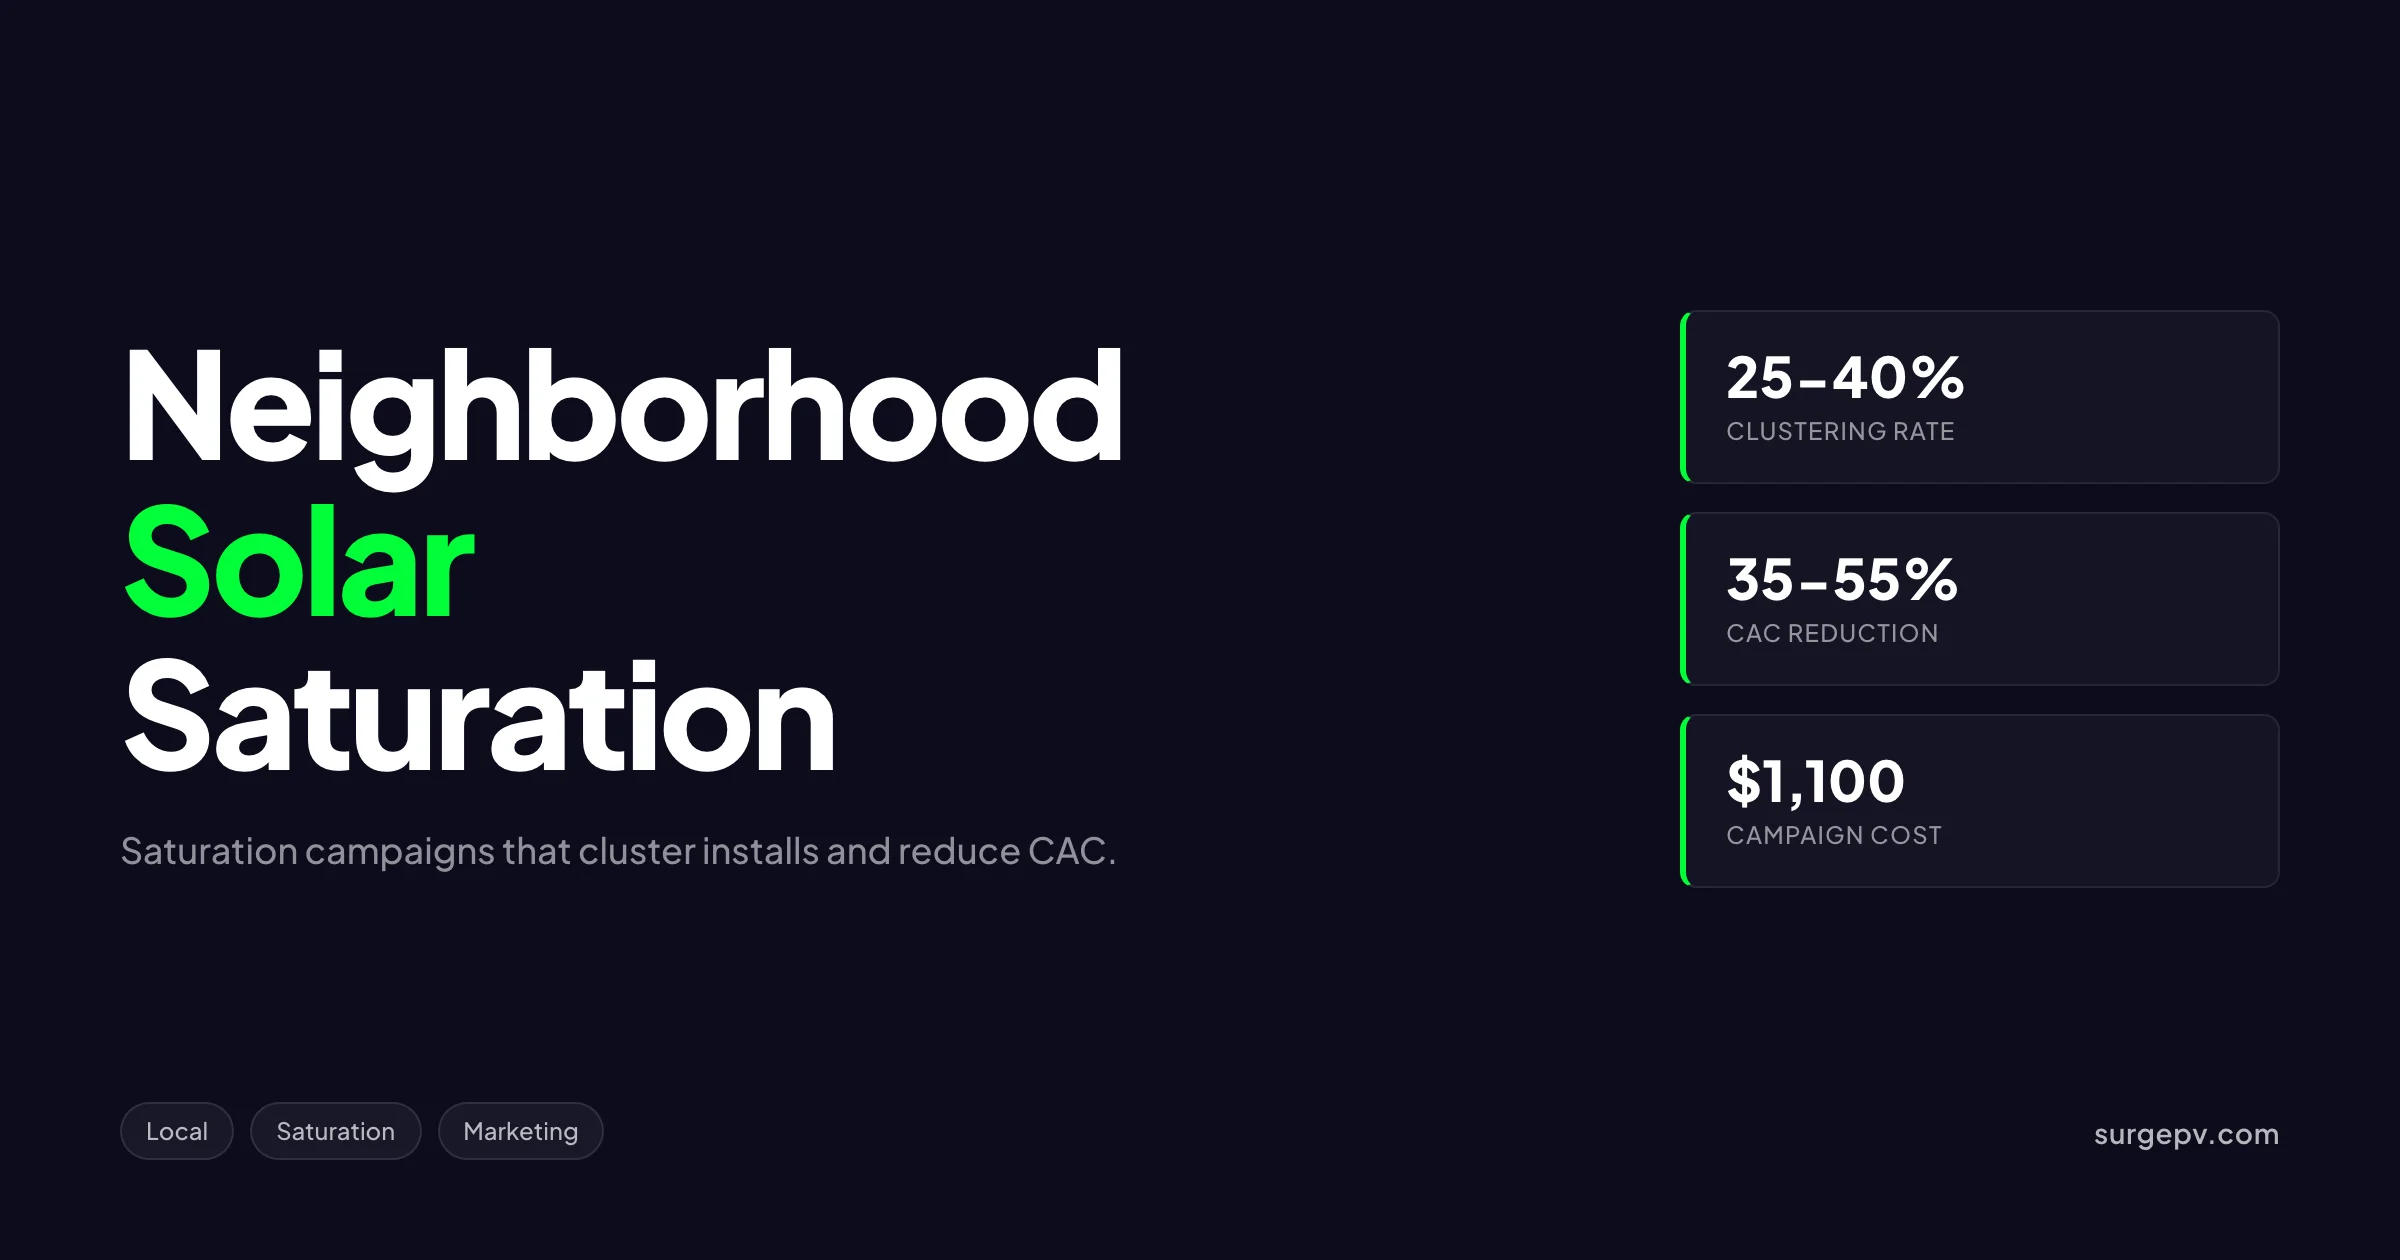
Neighborhood solar marketing uses initial installs as social proof anchors for surrounding homes. Mature installers achieve 25-40% install clustering rates (within 0.5 miles of prior installs). Saturation campaigns combining yard signs, door hangers, and direct outreach cost $400-$1,200 per neighborhood and generate 4-12 leads. CAC drops 35-55% vs random geography.
In this guide:
- Why solar is contagious (the social proof science)
- The 100-house saturation playbook
- Identifying high-potential neighborhoods
- Multi-channel saturation tactics
- Timing the campaign (the 30-day window)
- Tracking clustering rates and ROI
- Long-term neighborhood relationships
- Common mistakes in neighborhood marketing
- Eight common questions
Why Solar Is Contagious
Solar adoption follows a contagion pattern unlike most consumer products. Research from the Yale School of Environment and Stanford’s Solar Adoption Research found:
- A homeowner is 2-3x more likely to install solar within 12 months of a close neighbor installing
- Each additional solar install in a neighborhood increases probability of next install by 15-30%
- Installs cluster geographically far more than would be predicted by demographic factors alone
Three drivers of the contagion effect:
1. Visible social proof Solar panels are visible from the street. Driving past a neighbor’s installation reduces perceived risk for the next homeowner.
2. Fence-line conversations Neighbors talk. “How does your solar work? What did it cost? Was it worth it?” These conversations happen naturally between known parties — without sales filter.
3. Shared utility/regulatory context Neighbors share the same utility, same incentive structure, same net metering rules, same AHJ. The complexity that overwhelms one homeowner becomes manageable when shared with neighbors.
The Social Proof Multiplier
Most marketing channels have a 1:1 relationship between effort and result. Spend $1,000, get X leads. Linear.
Neighborhood marketing creates non-linear multiplication:
- 1 install in neighborhood generates 4-12 leads
- 3-5 installs in neighborhood generate 25-60 leads
- 10+ installs in neighborhood create ongoing organic interest
The compounding effect means mature installer neighborhoods become permanent lead generation territories that require minimal active marketing. For more on this topic, see Solar Lead Generation Strategies.
The 100-House Saturation Playbook
After every install, run a structured 30-day saturation campaign in the surrounding 100 homes.
Day 0: Install Day
Customer yard sign:
- Branded sign in customer’s front yard
- Visible from street, both directions of travel
- Include customer’s first name and install date
- Customer agreement to leave up minimum 30 days (preferably 60-90)
System photo + GBP post:
- Photo of completed install
- Post to Google Business Profile with location
- Share on installer social media accounts
- Include in neighborhood Facebook groups if appropriate
Crew engagement:
- Crew chief leaves business cards with neighbors who ask
- Install crew available for 30-minute Q&A period at end of install
- Photo with customer for marketing use
Day 1-7: Immediate Awareness
Door hangers (highest priority):
- 100 hangers in surrounding homes
- 50 closest homes get hanger within 48 hours
- 50 broader homes get hanger by day 7
Door hanger content:
- “Your neighbor at [street name] just installed solar”
- System size and benefit
- Specific local incentives
- Call-to-action with QR code
- Local phone number
Personal letters:
- Hand-written letter from project manager
- Sent to 8-12 closest neighbors
- Personalized: “We were at the [Customer Name] home this week…”
- Invite to walk-by or call
Neighborhood post:
- Facebook neighborhood group post (organic)
- Nextdoor neighborhood post
- Include photo of completed install
Day 7-14: Educational Outreach
Direct mail piece:
- EDDM (Every Door Direct Mail) to 200-500 homes
- Different format than door hanger
- Educational angle: “Solar incentives for [Neighborhood] homeowners”
- QR code for detailed information
Facebook ad targeting:
- Geo-targeted to neighborhood zip codes
- $100-$300 spend over 14 days
- Promote customer testimonial or saturation campaign
Customer referral push:
- Ask customer to mention solar to 5-10 neighbors
- Provide customer with referral cards
- Offer $300-$500 referral bonus
Day 14-21: Deepening Engagement
Email follow-ups:
- Anyone who responded to first 14 days outreach
- Educational nurture content
- Specific local incentive details
- Soft scheduling offer
Phone outreach (selectively):
- Top-prospect homes (electric bill over $200/month, owner-occupied)
- 5-10 phone calls
- Focus on neighbors who showed initial interest
Second-wave door hanger:
- Different design from first wave
- Different message angle
- 100 surrounding homes
Day 21-30: Closing Window
Personal customer follow-up:
- Customer hosts informal “see the system” gathering
- 5-10 neighbors visit on a Saturday
- Coffee, casual conversation, system walkthrough
Soft urgency:
- Reminder of time-sensitive incentives
- Direct calls to engaged prospects
- Special offer for neighbors of completed install ($500 off, free monitoring upgrade)
Long-term tracking:
- Add all engaged prospects to nurture sequences
- Continue periodic contact even beyond day 30
- Some leads will mature 60-180 days post-campaign See Solar Racking Design Guide for detailed guidance.
Total Investment per Saturation Campaign
| Item | Cost |
|---|---|
| Yard signs (customer + neighbor) | $50 |
| Door hangers (200 across two waves) | $400 |
| EDDM direct mail (300 homes) | $200 |
| Facebook ads (14 days) | $200 |
| Personal letters and follow-up | $50 (time + materials) |
| Customer thank-you/gathering | $150 |
| Tracking and reporting | $50 (CRM/tools) |
| Total | $1,100 |
Expected outcomes:
- 4-12 leads generated
- 1-3 acquired customers
- $15,000-$60,000 attributed revenue
ROI: 15-55x
Identifying High-Potential Neighborhoods
Not all neighborhoods saturate equally. Five factors predict success.
Factor 1: Owner-Occupied Rates
Renters rarely install solar. Target neighborhoods with 70%+ owner-occupation.
Data sources:
- Census American Community Survey
- County assessor records
- ATTOM Data property reports For United States-specific compliance details, see United States arizona/phoenix. For United States-specific compliance details, see United States california/los-angeles.
Factor 2: Electric Bill Levels
Homes with electric bills under $100/month have weak solar economics. Target neighborhoods averaging $150+ monthly electric bills.
Indicators of high electric use:
- Large homes (2,500+ sq ft)
- Pool ownership
- All-electric homes (heat pumps, electric water heaters)
- AC-intensive climates
Factor 3: Home Age and Roof Condition
Solar requires structurally sound roofs with 15+ years remaining life. Optimal target: homes built 1990-2015 with original or recent roof replacement.
Factor 4: HOA Status and Solar Policy
HOAs hostile to solar can reduce neighborhood conversion 50-70%. Target neighborhoods:
- No HOA, or
- HOA with positive solar policy, or
- State Solar Rights laws that override hostile HOA
Factor 5: Existing Solar Density
Counter-intuitively, neighborhoods with 0% solar adoption may underperform mid-density neighborhoods.
Optimal targeting:
- 2-8% solar density in neighborhood
- Active solar discussion in neighborhood groups
- Visible installations driving social proof
Neighborhoods with 0% solar lack social proof anchors. Neighborhoods with 15%+ solar may be saturated.
Building the Target List
Layer these factors to identify top neighborhoods in your service area. Most installers find 20-50 high-potential neighborhoods in their service area worth coordinated effort.
Tracked metrics per neighborhood:
- Total installs completed
- Active leads
- Pipeline value
- Saturation campaign history
- Estimated remaining opportunity
Multi-Channel Saturation Tactics
Single-channel campaigns underperform. Multi-channel campaigns compound.
Channel 1: Direct Mail
Cost per piece: $0.40-$1.20 (EDDM) or $0.85-$1.80 (targeted) Conversion rate to response: 1-3% Best for: Broad neighborhood awareness
Effective formats:
- Postcards with strong photo
- Door hangers with QR code
- Folded letters in envelopes (higher cost, higher open rate)
Channel 2: Yard Signs
Cost per sign: $4-$12 Visibility: 30-90 days per sign Best for: Social proof and brand awareness
Optimal sign types:
- Customer endorsement signs (their yard, post-install)
- “Coming Soon” signs (during install)
- Neighborhood referral signs (corner lot rentals)
Channel 3: Door-to-Door Canvassing
Cost per door visit: $5-$15 (canvasser labor) Conversion to lead: 2-5% Best for: Active selling, qualified prospects
D2D is more aggressive than other channels. Some markets prohibit. Check local ordinances.
Channel 4: Facebook Geographic Targeting
Cost: $0.50-$3.00 per click Reach: All Facebook users in target zip codes Best for: Demographic-targeted awareness
Targeting parameters:
- Zip code (5-15 in target neighborhood)
- Homeowner status
- Income bracket (varies by market)
- Behavioral signals (home improvement interest)
Channel 5: Nextdoor Marketing
Cost: $200-$1,000/month for premium business listing Reach: Nextdoor users in target neighborhoods Best for: Highly local, community-engaged audience
Channel 6: Local Newspaper Inserts
Cost: $300-$1,200 per neighborhood Reach: Older demographic in target geography Best for: Suburban markets with active local newspapers
Channel 7: Local Events
Cost: $500-$3,000 per event Reach: 50-200 attendees per event Best for: Customer-hosted or community-organized events
Channel 8: Customer Referrals
Cost: $300-$1,000 per acquired customer Conversion rate: 30-50% (highest of all channels) Best for: Highest-quality lead generation
Channel Mix by Budget
Low budget ($500-$1,000 per neighborhood):
- Door hangers (200)
- Yard sign (customer)
- Customer referral cards
- Organic neighborhood social posts
Mid budget ($1,000-$2,500):
- All low-budget tactics
- EDDM direct mail (300 homes)
- Facebook ads ($200)
- Limited D2D in high-potential streets
High budget ($2,500-$6,000):
- All mid-budget tactics
- Premium D2D campaign
- Event hosting
- Nextdoor premium presence
- Local newspaper ads
Timing the Campaign: The 30-Day Window
Saturation timing matters more than channel selection. The 30-day post-install window is the highest-leverage period.
Why 30 Days?
Three factors create the 30-day window:
1. Customer excitement Customer is most engaged in the first 30 days post-install. They proudly discuss solar with neighbors and willingly host informal demos.
2. Visual freshness Neighbors notice new solar installations. Within 90 days, the panels become “just part of the house” and lose attention-grabbing power.
3. Conversation triggers Within 30 days, conversations naturally occur: “I saw the work crew at your house, did you get solar?” These conversations fade after the install completes.
Timing Sequence
| Days Post-Install | Activity Level | Key Tactics |
|---|---|---|
| 0-7 | Maximum | Door hangers, yard sign, GBP post |
| 8-14 | High | Direct mail, Facebook ads, personal letters |
| 15-21 | Moderate | Second-wave outreach, customer gathering |
| 22-30 | Maintenance | Final follow-ups, long-term nurture |
| 31-90 | Low | Periodic updates, customer referral |
| 91+ | Passive | Yard sign decay, ongoing social proof |
Tactical Calendar
Day 0 (install day):
- Yard sign installed
- 50 door hangers distributed
- GBP post published
- Customer photo and quote captured
Day 2:
- 50 additional door hangers
- Personal letters to 8 closest neighbors
Day 5:
- EDDM direct mail batch sent
- Facebook ad campaign launched
Day 10:
- Customer testimonial captured (if customer willing)
- Second wave of social media content
Day 14:
- Email follow-up to all responsive contacts
- Second EDDM if budget allows
Day 21:
- Customer “see the system” gathering
- Targeted phone outreach to top prospects
Day 30:
- Campaign wrap-up
- All leads in nurture sequences
- Performance review and ROI calculation
Tracking Clustering Rates and ROI
Without tracking, you can’t optimize. Build measurement into every saturation campaign.
Key Metrics
Clustering rate: % of installs within 0.5 miles of prior install
- Target: 25-40% for mature installers
- Below 15%: under-leveraged neighborhood marketing
- Above 50%: possibly over-focused on existing territories
Saturation conversion rate: % of homes contacted that become leads
- Target: 2-5% conversion to lead
- Below 1%: weak targeting or messaging
- Above 7%: highly effective campaign
Cost per acquired customer (clustered): $ spent on saturation / customers acquired
- Target: $400-$1,000 in cluster neighborhoods
- Below $400: outstanding performance
- Above $1,200: needs optimization
Neighborhood lifetime value: Total revenue from all installs in a neighborhood
- Target: 8-25 installs per “winning” neighborhood
- Track over 24-36 months
Tracking Setup
CRM tagging: Every lead tagged with:
- Source neighborhood
- Originating install
- Channel that drove inquiry
- Days from neighborhood activation to inquiry
Map visualization: Quarterly mapping of:
- All completed installs (by year)
- Active pipeline by neighborhood
- Saturation campaign status
Tools like Maptive, BatchGeo, or Google My Maps work for basic visualization.
Quarterly review: Identify:
- Top 10 highest-yielding neighborhoods (>10 installs each)
- Mid-yielding neighborhoods (3-9 installs) — opportunity for deeper saturation
- Single-install neighborhoods — opportunity for first campaign expansion
Long-Term Neighborhood Relationships
Mature installer neighborhoods generate leads for years without active campaigning.
Building Permanent Territory
Steps to convert active saturation into permanent territory:
1. Maintain visible presence
- Customer yard signs in 10+ homes per neighborhood (rotating)
- Vehicle wraps visible during work
- Periodic GBP posts featuring neighborhood installs
2. Annual neighborhood updates
- Email to all known contacts in neighborhood
- “Solar update for [Neighborhood]” content
- Incentive changes, technology updates
3. Customer events
- Annual customer appreciation events in major neighborhoods
- Casual gatherings with current customers
- Open invitation to neighbors
4. Local partnerships
- Real estate agents in neighborhood (referrals)
- Solar service partnerships in neighborhood
- Sponsorship of neighborhood events
Indicators of Permanent Territory
Permanent territory looks like:
- 8+ installs in single neighborhood
- Self-generating referrals (1+ per year per neighborhood)
- Strong organic search presence for neighborhood-specific terms
- Local recognition (vans, signs, customers)
Once a neighborhood becomes permanent territory, maintenance costs drop 70-80% while lead generation continues.
Pro Tip
Map your existing installs today. Most installers are surprised to find natural clusters they haven’t actively cultivated. These existing clusters represent immediate opportunities for low-cost saturation work that will compound quickly.
Common Neighborhood Marketing Mistakes
Mistake 1: One-Size-Fits-All Approach
Same campaign for every install regardless of neighborhood characteristics. Affluent suburb saturation looks different than urban condo building marketing.
Mistake 2: Stopping Too Early
Quitting after 14 days when most conversions happen day 30-90. Maintain longer-term nurture beyond active campaign.
Mistake 3: Skipping Tracking
No CRM tagging. No mapping. No ROI calculation per neighborhood. Without data, optimization is impossible.
Mistake 4: Sales-First Messaging
Aggressive “buy now” messaging in early days. Lead with social proof and education. Sales-first reduces response by 40-60%.
Mistake 5: Ignoring Existing Customers
Existing customers in a neighborhood are the strongest asset. Failing to engage them in saturation campaigns leaves value on the table.
Mistake 6: Generic Material
Same brochure for every neighborhood. Tailor materials to specific neighborhood context (HOA, utility, demographics).
What Most Guides Miss
Neighborhood saturation requires patience compounded by data. Year 1: campaigns generate immediate leads. Year 2: organic referrals from year 1 customers boost results. Year 3: neighborhood becomes self-generating. The compounding only happens if year 1 saturation was disciplined and tracked.
Real-World Example: 18-Month Neighborhood Build
A solar installer in Sacramento, CA committed to neighborhood marketing in early 2024 with $5M revenue and primarily generic geographic distribution.
The 18-month plan:
- Standard $1,200 saturation campaign per install
- CRM tagging by neighborhood
- Monthly clustering rate tracking
- Quarterly map visualization
- Annual customer appreciation events in top neighborhoods
Results after 18 months:
- 247 total installs across 18-month period
- Clustering rate: started at 12%, ended at 36%
- Top 5 neighborhoods: 47 total installs
- Cost per acquired customer: dropped from $1,180 to $580
- Revenue from saturation-attributed customers: $4.2M
- Permanent territory established in 8 neighborhoods
Investment: $156,000 across 130 saturation campaigns Revenue lift: ~$1.4M vs. non-clustered baseline (CAC delta × volume)
The compounding effect was most visible in months 12-18 when previously activated neighborhoods began generating organic referrals without active campaign work.
Track Your Clustering With Real Data
Use solar design software to map every install geographically. Identify your existing clusters. Plan future saturation campaigns where you already have social proof anchors. The data alone often reveals immediate 20-30% efficiency improvements.
Book a DemoNo commitment required · 20 minutes · Live project walkthrough
Frequently Asked Questions
What is neighborhood solar marketing?
Neighborhood solar marketing is the coordinated effort to convert multiple homeowners in a single neighborhood after one or more initial installs. It combines yard signs, door hangers, social proof, and direct outreach in a defined geographic area to maximize the social contagion effect that drives solar adoption.
Why does neighborhood saturation work for solar?
Solar adoption is highly contagious. Research from Yale and Stanford shows homeowners are 2-3x more likely to install solar within 12 months when a close neighbor installs. Visible panels, fence-line conversations, and shared utility/HOA experiences create natural social proof that overcomes typical buying objections.
How does neighborhood clustering reduce installer costs?
Clustered installs reduce drive time, share permitting time, and lower per-customer marketing costs. Installers achieving 25-40% clustering rates (installs within 0.5 miles of prior install) reduce CAC by 35-55% vs installers with random geographic distribution.
What is the ROI of a neighborhood saturation campaign?
A 100-house saturation campaign around a single install typically costs $400-$1,200 and generates 4-12 additional leads. With typical solar lead-to-customer conversion rates of 15-25%, expected acquired customers per campaign: 1-3. Cost per acquired customer through saturation: $200-$1,000.
How long do neighborhood marketing effects last?
Direct saturation impact (immediate post-install) lasts 60-90 days for active outreach. Indirect contagion effects (neighbors seeing panels, hearing about it) extend 12-36 months. Mature installer clusters in established neighborhoods generate leads for years after initial installs.
What is the best timing for neighborhood saturation?
Launch saturation campaigns within 7 days of system energization. The customer is excited, neighbors notice the install, and social proof is fresh. Beyond 30 days post-install, attention fades. Days 1-14 are highest-leverage; days 15-30 are moderate-leverage; beyond 30 days yields diminishing returns.
Should solar installers target whole neighborhoods or specific homes?
Both. Whole-neighborhood saturation (door hangers, mailers) builds general awareness. Specific-home targeting focuses on highest-potential prospects (owner-occupied, single-family, suburban, electric bill over $150/month). Combined approach delivers 2-3x the leads of either alone.
What is the biggest mistake in neighborhood solar marketing?
The biggest mistake is treating every install identically. Some neighborhoods will saturate easily (suburban, owner-occupied, electric-heavy). Others won’t (renters, low-income, urban). Use install data to identify which neighborhoods convert well and focus saturation efforts there.
Three Steps to Start This Week
-
Map your last 50 installs on Google My Maps. Identify natural clusters. Mark neighborhoods with 2+ installs.
-
Build a 30-day saturation playbook. Standardize the 100-house campaign so it runs identically for every install. Use solar design software project data to make outreach materials specific and credible.
-
Track clustering rate monthly. Current % of installs within 0.5 miles of prior. Targeting 25%+ within 12 months reduces CAC by 35-55% and creates compounding territory growth.
Related SurgePV Resources
Continue learning with these related guides for solar installers and EPCs:
- Solar Yard Signs and Vehicle Wraps
- Solar Community Events Marketing
- Solar Customer Testimonial Strategy
- Solar Review Management
- Local SEO for Solar Installers
For more solar business and marketing content, explore the full SurgePV blog or browse the SurgePV glossary for definitions of solar industry terms. For a direct comparison, see Arka 360 vs SurgePV.
Solar Software Tools to Support This Work
Effective solar installer operations depend on integrated software. SurgePV’s solar design platform helps installers handle the upstream work that feeds every decision in this guide:
- Solar design software for system layouts, panel placement, and BOM generation
- Shadow analysis for site-specific irradiance and obstruction modeling
- Generation and financial tool for production forecasts and project ROI
- Solar proposal software for branded, customer-facing proposals
- Clara AI for automated design assistance and Q&A
Browse the full SurgePV platform to see how installers across 50+ countries use the tools to design smarter, sell faster, and streamline every solar project.