Quick Answer
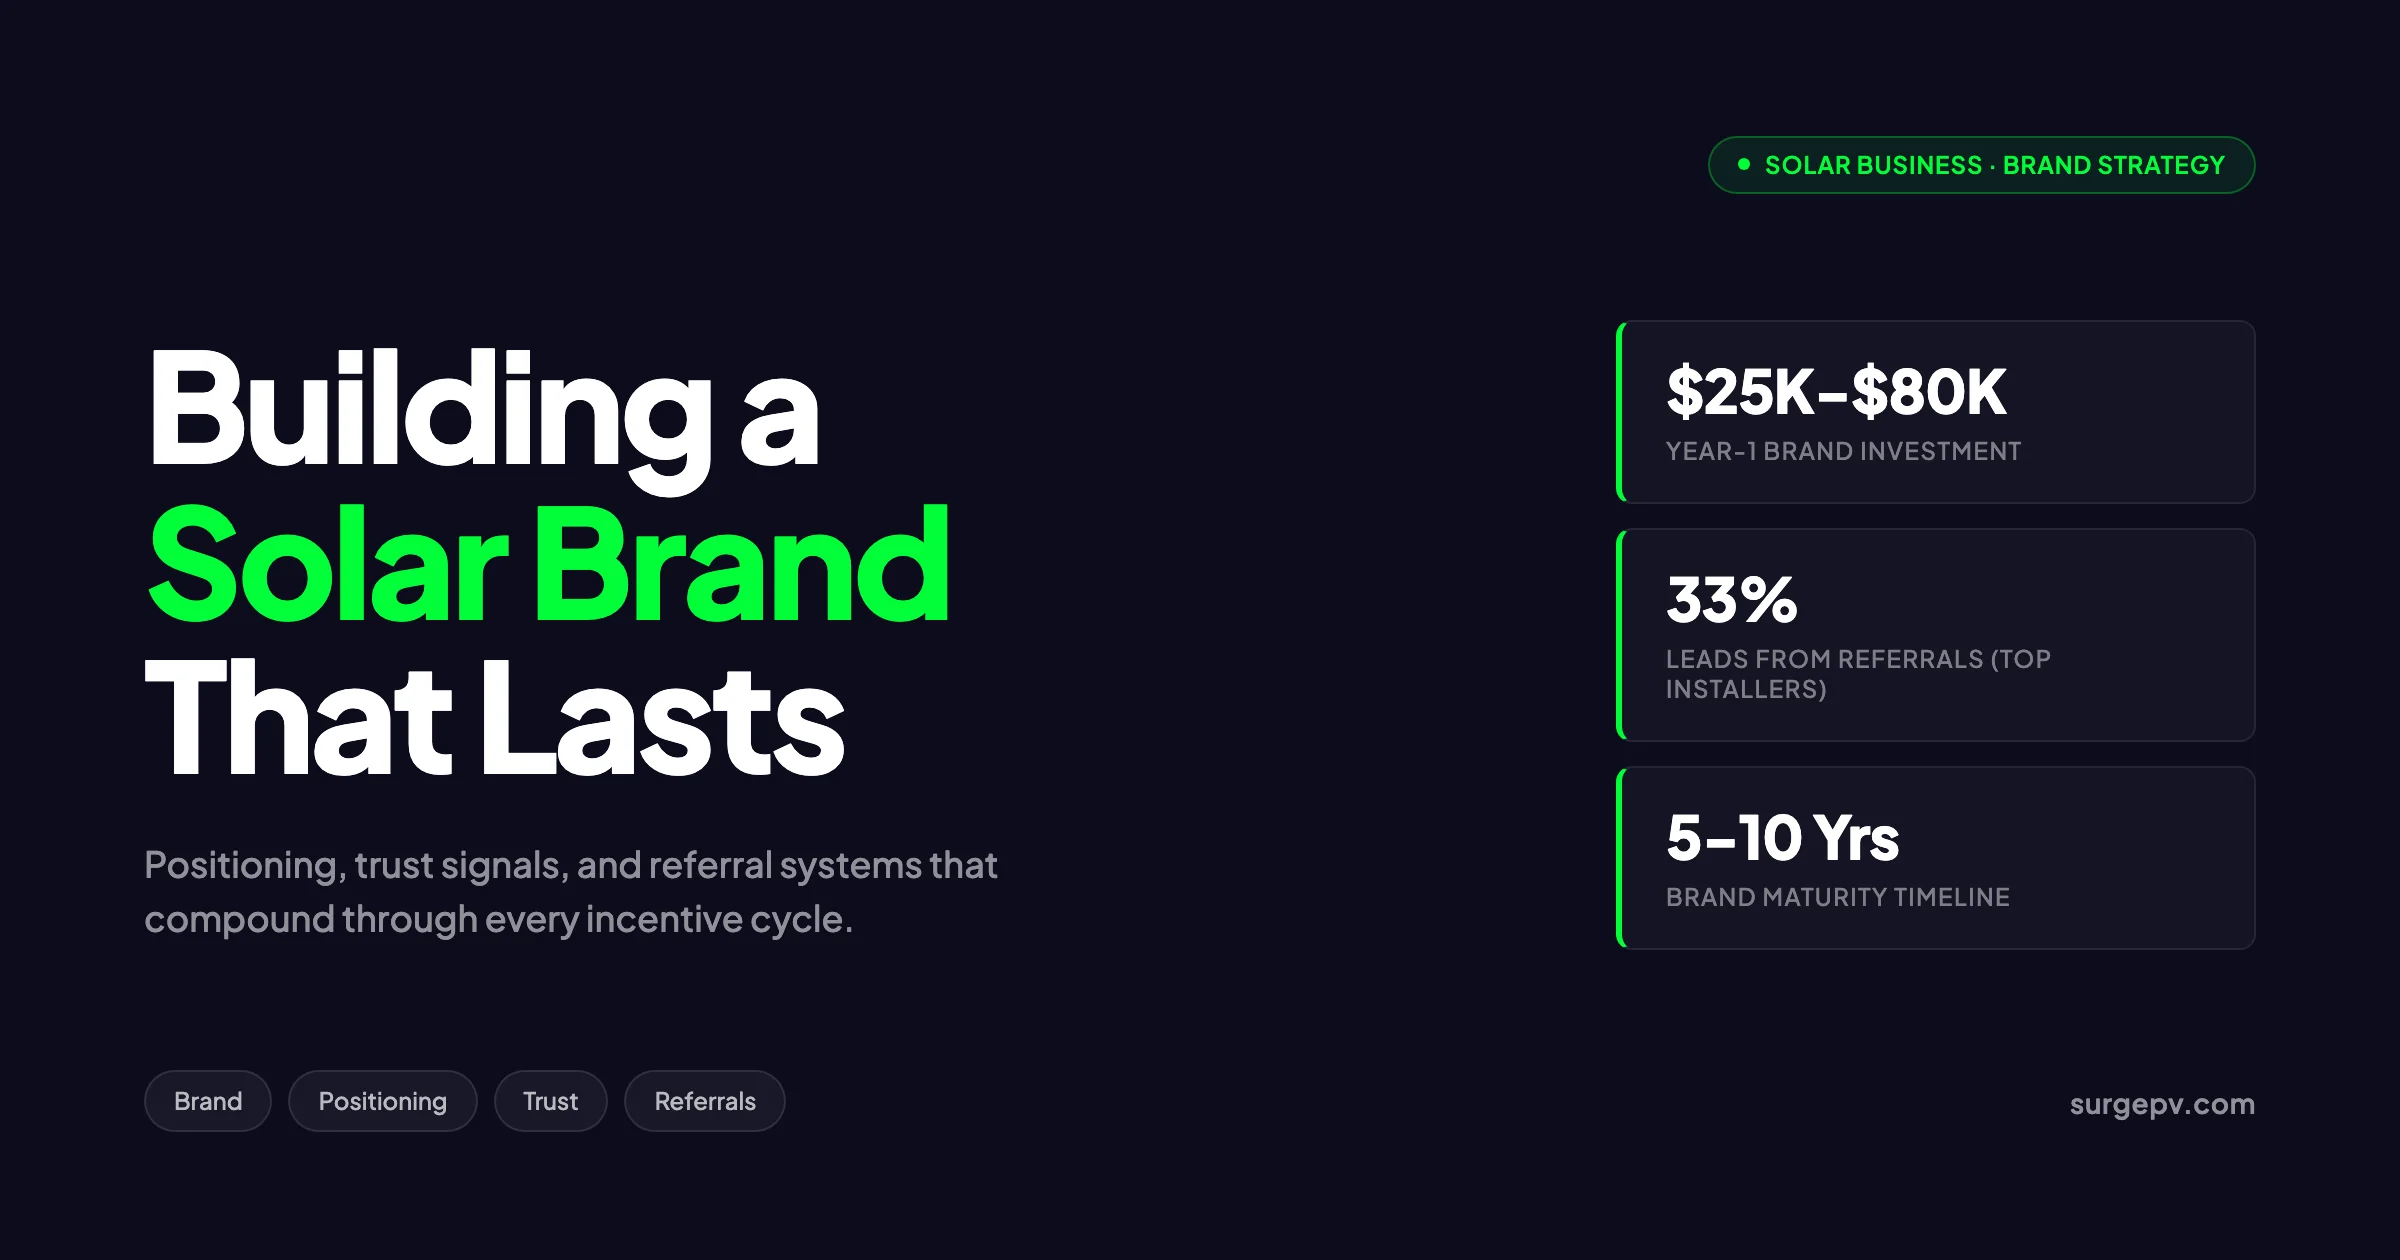
When the 30 percent residential ITC expired on December 31, 2025, US residential solar installers split into two camps. Strong solar brands invest $25,000 to $80,000 in year one on visual assets, photography, and review systems. Building this takes 5 to 10 years of consistent work. The brands that built equity through 2023 and 2024 kept share.
When the 30 percent residential ITC expired on December 31, 2025, US residential solar installers split into two camps. The ones with a brand kept selling at full margin. The ones who chased every leftover rebate are now selling on price. The gap is widening every quarter.
When the 30 percent residential ITC expired on December 31, 2025, US residential solar installers split into two camps. Strong solar brands invest $25,000 to $80,000 in year one on visual assets, photography, and review systems. Building this takes 5 to 10 years of consistent work.
Brand is what survives when the incentives go away. It is also what protects margin when 12 other installers knock on the same door. A clear position, a deep review base, and a working referral engine compound year after year. Discount-led marketing does the opposite.
This guide covers how solar installers build that durable brand equity in 2026 and beyond, with budget ranges, real referral structures, and the trust signals that move close rates. We also map the role of solar software and proposal tooling in protecting that brand at scale.
Quick Answer
A solar brand is the sum of your position, voice, visual identity, and the trust signals that prove your claims. Strong solar brands invest $25,000 to $80,000 in year one on visual assets, photography, and review systems. They earn 30 percent or more of leads through referrals by year three. They sell on outcomes and reliability rather than discounts. Building this takes 5 to 10 years of consistent work.
Key Takeaways
Solar brand equity is the single best hedge against incentive cycles, with referrals converting at 30 to 50 percent versus 2 to 5 percent for paid leads. Plan a year-one brand budget of $25,000 to $80,000 covering naming, identity, website, and photography. Trust signals like Google reviews, Solar Reviews scores, and NABCEP certification raise close rates by 8 to 15 percent each. Referral payouts of $500 to $1,500 per residential close and up to $5,000 per commercial close are now standard. Differentiation by roof type, geography, certification, or storage specialty beats generic claims of quality or service.
In this guide:
- Why solar brand matters more after the residential ITC expired
- What a solar brand actually is, with positioning frameworks and voice rules
- The trust stack that moves close rates: reviews, certifications, and local proof
- Brand foundations including naming, visual identity, and photography
- Content strategy across blog, video, email, and owned media
- Referral program structures with real payout ranges
- Local SEO and geographic brand building
- Why discount pricing erodes brand equity
- Common mistakes and myth-busting
Why Solar Brand Matters More Post-Incentive in 2026
The US distributed solar industry installed 8.4 GWdc of capacity in 2025, a 5 percent decline from 2024, with residential flat and community solar down 25 percent. The brands that built equity through 2023 and 2024 kept share. The ones leaning on tax-credit messaging lost it overnight. Read Community Solar Business Model for a complete walkthrough.
Wood Mackenzie reports a “flight to quality” across the industry. Capital providers, tax-equity partners, and homeowners are all narrowing their installer lists. New entrants struggle to break in. Established names with proven execution gain share.
This is the post-ITC reality. The 30 percent residential ITC under Section 25D ended on December 31, 2025. Commercial Section 48 credits remain available with new restrictions. Most state incentives are also tightening or sunsetting. The installers that built brand equity now sell on outcomes instead of subsidies.
The math also changed. Customer acquisition costs hit $0.85 per watt in 2023, close to $10,000 per residential sale, according to SEIA data. Paid leads convert at 2 to 5 percent. Referrals convert at 30 to 50 percent. A working brand cuts CAC by half or more, which is the difference between profit and loss in a flat market.
Brand also affects pricing power. Referred customers usually ask for one quote and accept higher prices, according to a 2024 EnergySage installer survey. The 18 percent loyalty premium they show over paid leads compounds across warranty claims, battery upgrades, and second-home installs.
Pro Tip
Track your “referral and repeat” percentage every month. The top installers move from 10 percent in year one to 33 percent or higher by year five. If that number flatlines, your brand is not compounding.
If your team still leans on incentive math in sales calls, you are training customers to shop on price. Build the brand assets that justify a premium, then train sales on the value story. Our guide to solar customer acquisition cost breaks down the spend ratios that work in a post-ITC market.
What a Solar Brand Actually Is
A solar brand is four things stacked together: position, voice, visual identity, and the trust signals that prove all three. Most installers skip the first and rush to the fourth. That order is backwards.
Position is the single sentence that answers, “Why pick you over the 12 other installers in this county?” Generic answers like “quality work and great service” mean nothing. Sharp positions are specific: “the only NABCEP-certified tile roof specialist in San Diego County” or “the installer with the fastest interconnection in Hudson Valley.”
Voice is how you sound in writing, on the phone, and in the proposal. Confident and clear, or pushy and hedged. Voice consistency across the sales rep, the email reply, and the install crew is what makes a brand feel real. It costs nothing to fix and takes years to drift back to mush.
Visual identity is the logo, color palette, typography, photography style, and uniform. Most installers over-invest in logos and under-invest in photography. A clean wordmark and one strong color beat any clever symbol. Real installation photos with clear safety gear and finished arrays beat any stock image.
Trust signals are the proofs. Google reviews, Solar Reviews scores, EnergySage badges, NABCEP and OSHA 30 certifications, BBB accreditation, local utility partnerships, manufacturer certifications, years in business, total installations, and warranty terms. We cover the full stack in the next section.
A Brand Without Position Is Just a Logo
If you cannot complete this sentence in 15 words or less, you have no position: “We are the best installer for [audience] in [geography] because [reason].” Generic positions like “best customer service” do not survive a competitive bid round. Sharp positions do.
A useful exercise: write your position sentence, then read it to three recent customers. If they nod and say, “Yeah, that is why I picked you,” you have a position. If they look confused, rewrite it. Customers can tell you your brand far better than any agency can.
The full positioning framework also includes audience and category. Audience is the customer profile you serve best: residential, commercial, agricultural, off-grid, or specific roof types. Category is the bucket you compete in: full-service installer, design-only, EPC contractor, or O&M specialist. Audience plus category plus reason forms the position. Our marketing for solar installers guide includes 20 example positions from real installers.
The Trust Stack: Reviews, Certifications, Local Proof
Solar buyers cross three thresholds before signing: site suitability, financial viability, and installer trust. Trust is the threshold most installers underprice. Each trust signal raises close rates measurably.
BrightLocal’s 2025 Local Consumer Review Survey shows 87 percent of consumers read online reviews for local services before contacting them. NeverMiss data shows 88 percent of homeowners read reviews before hiring a solar company. Recency and response rate matter more than star count.
The table below shows the relative impact of trust signals on close rate, based on a 2024 study by Sunvoy of 14 mid-sized installers across the US.
| Trust Signal | Typical Close-Rate Lift | Notes |
|---|---|---|
| 100+ Google reviews at 4.6 stars or higher | 12 to 15 percent | Velocity matters as much as volume |
| Solar Reviews installer rating 4.5+ | 8 to 12 percent | Strong influence on educated buyers |
| EnergySage Elite or Premier badge | 7 to 10 percent | Higher weight in multi-quote shoppers |
| NABCEP-certified installer on staff | 5 to 8 percent | Often a hard filter for premium buyers |
| BBB A+ accreditation | 3 to 5 percent | Matters more for buyers over 55 |
| 10+ years in business | 5 to 7 percent | Signals durability for 25-year warranty |
| Manufacturer master installer status | 4 to 6 percent | Tesla, Enphase, SunPower, Panasonic |
| Local utility approved installer list | 3 to 5 percent | Increases speed-to-interconnect trust |
The compounding effect is real. An installer with strong signals across five or six of those rows can run a 35 percent close rate where a generic competitor runs 12 percent. That gap is the brand premium.
Review velocity beats review volume. Google favors steady inflow over bursts. A solar company that gets five reviews per month for 12 months ranks better than one that posts 30 reviews in one month and then nothing. Aim for one review per closed install minimum, and respond to every review within 48 hours.
Ask for the Review at Peak Excitement
The best time to ask is the day the system turns on, not three weeks later. Train your install crew to text a Google review link from the truck the moment the inverter shows production. Conversion on that text is 60 to 70 percent versus 5 to 10 percent for email follow-ups two weeks later.
The Solar Reviews and EnergySage platforms also surface installer profiles in branded search results. A homeowner who searches “[your installer name] reviews” should see your Solar Reviews profile in the top three results. If they do not, your brand is exposed to competitor pages and aggregator sites that rank for that query.
Local proof closes the gap that aggregators cannot. Yard signs, branded vehicles, finished system photos with neighborhood names visible, and case studies tied to specific zip codes. Buyers trust the work they can drive past more than any star rating.
Brand Foundations: Naming, Visual Identity, Photography
The four foundation assets are name, visual identity system, website, and photography. Together they form the surface of the brand. Most installers underspend on photography and overspend on logo iterations.
The table below shows typical year-one budget ranges across the US, based on a 2025 survey of 80 installer marketing leads by Solar Power World.
| Asset | Budget Range | Notes |
|---|---|---|
| Naming and trademark | $2,000 to $8,000 | Includes domain, USPTO filing |
| Logo and visual identity system | $5,000 to $15,000 | Wordmark, color, typography, guidelines |
| Website (custom) | $15,000 to $50,000 | Lead capture, project gallery, CMS |
| Professional photography | $5,000 to $25,000 | 2 to 4 shoots covering install crews and finished systems |
| Vehicle wraps and uniforms | $3,000 to $12,000 | Per truck, plus crew apparel |
| Proposal and PDF templates | $1,000 to $5,000 | Branded sales collateral |
| Signage and yard signs | $2,000 to $8,000 | Job site visibility |
| Initial brand campaign | $5,000 to $20,000 | Launch announcement, press, intro paid |
A new installer targeting $2 to $5 million in year-one revenue should budget $25,000 to $80,000 across these assets. An established installer doing $20 million should budget $100,000 to $300,000 yearly on maintenance, refresh, and new photography. Brand is not a one-time expense.
Naming rules are simple. Pick a name that is easy to spell on a phone call. Avoid puns that age poorly, like “SunsetSolar2024” or “WattsUpSolar.” Check the dot-com domain, the USPTO trademark database, and the social handles before committing. Names that include a geographic anchor like “Hudson Valley Solar” build local SEO faster than abstract names like “Lumen Energy.”
Visual identity should pick one strong color and one neutral. Yellow, orange, green, and blue dominate the solar category. To stand out, choose a single color and use it consistently across every surface. Black with a single accent color, like the SurgePV navy and neon green, reads as premium against the sea of generic sunburst logos. For a direct comparison, see Arka 360 vs SurgePV.
Typography matters more than logo cleverness. Pick two fonts: one for headlines and one for body. Use them across the website, proposals, and email signatures. Consistency over creativity. The brands that customers remember have a system, not a mood board.
Photography is where most installers lose. Stock photos of generic panels and smiling families read as fake. Hire a local photographer for two half-day shoots per year. Get install crews on roofs in branded uniforms, finished systems with the homeowner present, close-ups of clean wire management, and team shots in front of the warehouse. These images carry the brand across the website, social, and proposals.
Photography Is the Cheapest Brand Lift
A $7,000 photo shoot replaces every stock image on your website. The lift in time-on-page, demo bookings, and proposal close rates is measurable within 60 days. Most installers refresh photography every 18 to 24 months as crews and trucks change.
The proposal template is often the most-read brand asset in your business. Every prospect reads it cover to cover. Invest in a designed PDF template with your photography, your color system, and a clear narrative. Use SurgePV’s design tools to ship branded proposals from the same workflow your design team uses.
Content Strategy: Blog, Video, Email, Owned Media
Owned media is the brand asset you keep no matter what platforms do. A homeowner who finds your blog post on “how to read a SunRun lease” trusts you before the first sales call. The cost to keep them in the funnel is near zero from that point on.
A working content engine has four pillars: educational blog, finished-system video, email nurture, and a public project gallery. Most installers run one of the four. The compounders run all four.
Educational blog. Two to four posts per month covering buyer questions: cost, financing, equipment comparisons, local utility processes, and roof types. Use Google Search Console and AnswerThePublic to find what real buyers ask. Aim for 1,500 to 3,000 word posts that answer the question completely. Avoid promotional copy. Buyers click away the moment a “guide” turns into a brochure. Read more about Agricultural Solar Case Study. For the latest details on France, see Floating Solar Farms France.
Finished-system video. A 60 to 90 second walkthrough of each install. The crew, the homeowner, the finished array, and the first-day production reading. Post to YouTube, Instagram Reels, and the website. Three videos per month builds a library that ranks in YouTube search within 18 months.
Email nurture. A 12 to 18 month drip for leads who request a quote but do not close. Send one educational email every 2 to 3 weeks: equipment comparisons, financing updates, customer stories, and local case studies. Close rate on nurtured leads runs 8 to 15 percent versus 1 to 3 percent for cold reactivation, according to Bodhi’s 2024 customer experience report. For the latest details on France, see France Solar Feed-in Tariffs.
Public project gallery. A page on the website with finished systems by city, system size, and roof type. Each entry includes a photo, the installer date, the system specs, and a one-paragraph homeowner story. Buyers near each project see proof that you work in their area. Local SEO compounds as the gallery grows.
Ship Branded Proposals From Day One
Every proposal your team sends is a brand impression. SurgePV’s design and proposal tools include branded PDF templates, your color system, and your photography baked in.
Book a DemoNo commitment required · 20 minutes · Live walkthrough
LinkedIn and Instagram split duty. LinkedIn is where you build B2B credibility with commercial buyers, channel partners, and utility staff. Instagram is where you build visual proof for residential. Both feed the brand. Both need consistent posting cadence. Twice a week minimum on each.
The discipline that separates content engines from content theater is editorial calendar. Plan 90 days at a time. Tie every post to a buyer question, a service area, or a product. Measure organic traffic and contact form conversions monthly. If a topic does not move either, drop it.
Owned media also includes the proposal PDF, the post-install handover document, the warranty card, and the homeowner portal. Every touchpoint is a chance to reinforce the brand. Treat the proposal like a magazine cover, not a price sheet.
Referral Programs: Turning Customers Into a Sales Force
Referrals are the highest-converting lead source in solar. Most installers run a referral program in name only. The compounders run real systems with tracked attribution, automated payouts, and double-sided incentives.
Resultcalls reports that referral leads close at 30 percent for top installers, with one Australian solar company generating $8 million in referral revenue in a single year. Nielsen data shows 92 percent of people trust recommendations from friends and family more than any other marketing channel. For Australia-specific compliance details, see Australia comparisons/lgc-vs-stc.
The table below shows the three common referral structures and what each is best for.
| Structure | Payout | Best For | Trade-offs |
|---|---|---|---|
| Flat fee per close | $500 to $1,500 residential, $2,500 to $5,000 commercial | Simple to launch, easy to communicate | Customers with multiple referrals lose incentive after the first |
| Tiered fee | $500 for small systems, $1,000 for large, $1,000 bonus per 5 referrals | Established installers with referral champions | More complex tracking, harder to explain |
| Percentage of contract | 1 to 2 percent of project value | Commercial-focused installers | Hard to compete with flat fees on small residential jobs |
A flat $1,000 residential payout is the most common starting point. Adjust up or down based on average deal size and customer acquisition cost. If your CAC sits at $4,500, paying $1,000 for a referral that closes at 30 to 50 percent is a clear win.
Double-sided rewards work better than single-sided. Offer $1,000 to the referrer and $500 off the install to the new customer. The new customer gets a reason to pick you over a competing bid. The referrer gets to feel generous instead of mercenary.
Timing the ask matters as much as the payout. The peak excitement window is contract signing, installation day, and the first electric bill that shows the savings. Build a system that triggers a referral request at each of those moments. Most installers ask once at install completion and never again. The compounders ask at four touchpoints across 18 months.
The 80/20 rule applies hard. About 80 percent of referrals come from 20 percent of customers. Identify the champions and treat them differently. Send a holiday gift. Invite them to crew anniversaries. Give them branded apparel. Champions generate three to seven referrals each. Lose them and your engine sputters.
Track Every Referral or Lose Them
Manual referral tracking fails within 90 days. Customers refer their cousin, the cousin calls your sales line, the rep takes the call, no one logs the referral source, and the original customer never gets paid. Automate referral capture through a CRM or dedicated tool. Pay every referrer within 30 days of the close.
See Solar Racking Design Guide for detailed guidance.
B2B referral networks extend the engine beyond your customer base. Partner with roofers, real estate agents, EV dealers, HVAC contractors, and energy auditors. Each one talks to your customers before you do. Pay them on the same terms as customers, or offer co-marketing budget instead of cash.
Our solar lead generation strategies guide covers the full referral and partner playbook, including CRM templates and sample referral agreements.
Local SEO and Geographic Brand Building
Local SEO is where solar brand and search rank meet. Most residential solar searches are geographic: “solar installer Austin,” “solar panels Sacramento,” or “best solar company Tampa.” Ranking in the top three local results moves more revenue than any paid campaign.
Three signals dominate local rank: Google Business Profile completeness, review velocity and recency, and citation consistency across the web. Each one is a brand asset that compounds.
Google Business Profile. Claim and verify. Fill every field. Add 30+ photos of crews, finished systems, and the office. Post twice a month with current promotions, finished projects, or seasonal updates. Respond to every review. Add Q&A entries that match common search queries. A complete profile with 100+ reviews at 4.6 stars or higher dominates the local pack in most US metros.
Review velocity. Get one review per closed install minimum. Use a text-based review request from the install crew on the day the system turns on. Reply to every review within 48 hours. Address negative reviews with a clear, specific response. Never argue. Offer to take the conversation offline and resolve the issue.
Citation consistency. Your business name, address, and phone number must match exactly across Google, Yelp, Solar Reviews, EnergySage, BBB, Angi, Nextdoor, and any local directory. Inconsistent citations confuse search algorithms and drop your rank. Use a tool like BrightLocal or Whitespark to audit every quarter.
City-specific landing pages help when your service area covers multiple metros. A page titled “Solar Installation in Tampa, Florida” with local case studies, utility-specific info, and a Tampa-specific contact form ranks better than a generic services page. Build one per metro you serve. Avoid thin content. Each page needs 800 to 1,500 words minimum.
Yard signs and vehicle wraps complete the geographic brand. A wrapped truck in a neighborhood for 4 to 6 weeks during install builds local recognition that no digital ad matches. Yard signs left for 30 to 60 days post-install drive 1 to 3 referral inquiries per sign on average, according to Solar Power World’s 2024 installer survey.
The Yard Sign Funnel
The cheapest brand asset in solar is a yard sign. Offer $50 to the homeowner per month for keeping the sign up. The cost of 60 yard signs at $50 a month for 3 months is $9,000. The lead value from 60 to 180 inbound calls in that period easily exceeds $200,000 in pipeline. Most installers skip this and run paid ads instead.
Brand vs Promo: Why Discount Pricing Erodes Equity
Discount pricing trains customers to wait for the next deal. Once they learn your prices drop, the next bid drops too. Margin compresses, sales cycles lengthen, and the brand becomes a commodity. The cycle is hard to reverse.
The post-ITC market is full of installers who built their pipeline on rebate stacking. When the 30 percent residential ITC ended, their marketing engine stopped working overnight. They had no brand to fall back on. The ones still winning sold on bill stability, blackout protection, home value, and reliability long before December 31, 2025.
Promotional offers have a place. A $500 install credit for booking by month-end is a useful tactical lever. A 25 percent off “blowout sale” trains customers to mistrust your starting price. The difference is whether the offer is the brand or a tactic within the brand.
Pricing transparency works better than discounting. Publish your price ranges by system size on the website. Show a clear breakdown of equipment, labor, permitting, and overhead in every proposal. Buyers reward transparency with trust. The installers with public pricing pages convert 15 to 25 percent higher than those that gate price behind a sales call, according to a 2024 EnergySage benchmark.
Premium positioning takes nerve. The first time a competitor underbids you and the customer leaves, the pressure to drop price is real. The brand-led installers hold the line. They lose 30 to 40 percent of bids on price and win the other 60 to 70 percent on trust, warranty, and proof. Their margin per install is 15 to 25 percent higher than commodity competitors.
The math also rewards the premium position over a five-year horizon. A discount installer doing 200 installs per year at $0.50 lower margin per watt is leaving $700,000 to $1.4 million on the table annually, based on average system sizes of 7 to 14 kW. That gap funds the brand investment that creates the premium in the first place.
A Narrative Fragment: The Installer That Survived
A mid-sized installer in southern New Jersey, 12 years in business, $14 million in 2024 revenue. The owner had spent six years building a referral engine. By the end of 2025, 41 percent of installed projects came from past customers or partners. Total marketing spend ran 4.8 percent of revenue, less than half the regional average.
When the 30 percent ITC expired, three competitors in the same county shut down within 90 days. They had built their pipeline on incentive math and rebate stacking. The cost-per-lead from paid channels doubled as residential demand softened. They had no brand to soften the landing.
The owner kept selling. The 2026 pipeline came in at $11.2 million by April, slightly below the 2025 run rate but still profitable. Average ticket size moved up by 6 percent because the customers came in pre-trusted and asked for fewer competing quotes. The referral payouts grew from $180,000 in 2024 to $230,000 in 2026. Cheap money, cleanly earned.
The brand asset that did the heavy lifting was not the logo or the website. It was 1,400 finished installs across the same five zip codes, with yard signs, branded vehicles, and Google reviews compounding for a decade. The brand was the work, made visible.
Why Most Solar Brands Look Identical (And How to Break Out)
Open ten installer websites in a row. You will see the same blue gradient, the same stock photo of a happy family on a porch, the same headline about “saving money and the planet,” and the same generic CTA. Solar brands look identical because most installers copy the last installer they noticed.
The escape is sharper positioning, not better design. A clear position forces the visual identity, the photography, and the copy into a single coherent system. A vague position produces vague visuals. Pair the position with modern solar design software so the technical work always matches the brand promise.
Three positioning lanes break the sameness:
Specialist. Pick one segment and own it. Tile roof specialist, agricultural installer, off-grid expert, battery-first installer, historic district specialist, or HOA-approved aesthetic installer. The narrower the segment, the louder the brand. Generalist installers compete on price. Specialists compete on expertise.
Process. Sell the experience instead of the panels. The 14-day install guarantee. The single point-of-contact project manager. The transparent pricing page. The same crew from sales to install. Process brands win on stress reduction, not equipment.
Local authority. Be the installer that knows the local utility, the permitting office, and the HOA boards better than anyone. Publish guides on city-specific solar processes. Sponsor the local high school robotics team. Show up at city council meetings. Authority compounds over years.
The biggest mistake is trying to be all three at once. Pick one lane, build the brand around it, and let the other lanes go. The installers that survive incentive cycles are the ones with the sharpest single-lane position.
Photography choices also break out of the sameness. Drop the smiling family stock images. Use real crew photos with branded uniforms, finished arrays with the homeowner present, and process shots showing the work behind the scenes. Honest photography reads as confidence.
Common Mistakes (Myth-Busting)
Myth: You need a viral marketing moment to build a brand. No. Brand is the slow compounding of consistent quality and clear positioning over 5 to 10 years. Viral moments are accidents. The brands that survive are built on disciplined execution, not luck.
Myth: A new logo will fix the brand. No. A new logo will fix nothing if the position is unclear and the trust signals are weak. Most rebrands are expensive distractions from harder structural work. Invest the rebrand budget in photography, content, and review systems instead.
Myth: Brand only matters for residential. Wrong. Commercial buyers spend more time researching installers and read review platforms harder than homeowners. A weak C&I brand loses on the long-list stage, often before you know you were in the running. Our commercial solar sales cycle guide breaks down the trust signals C&I buyers weigh.
Myth: Paid ads scale brand. Paid ads scale lead volume, not brand equity. A brand built only on paid acquisition collapses the day you cut spend. Paid ads work best as an amplifier of an existing brand, not as a substitute. Pair paid with referral, content, and reviews.
Myth: Local SEO is dead because of AI search. No. Google’s AI overviews still pull from local pack results, Solar Reviews, and Google Business Profiles. The fundamentals of local SEO matter more in AI search, not less, because AI engines reward authoritative sources with consistent citations.
Myth: You can buy your way to 5-star reviews. Anything except a real review process is a liability. Solar Reviews, EnergySage, and Google penalize and remove fake reviews routinely. The brands that win invest in earning reviews, not gaming them.
Myth: Brand is a year-one expense and then maintenance. Brand is a year-over-year investment. The installers with the strongest brands spend 5 to 10 percent of revenue on brand and marketing every year for a decade. Year five spending is usually triple year-one spending.
Myth: Sales training is separate from brand. No. Every sales call is a brand impression. A pushy rep undoes years of brand work. Train sales on the brand voice and the proof points. Consistency from first ad to install handover is the brand.
The Brand-Builder’s Quarter
Block a half-day each quarter to audit your brand surfaces: website, proposal template, Google Business Profile, Solar Reviews profile, the last 10 outbound emails, the truck wraps, and the install photos. If any one looks dated or inconsistent, fix it that week. Quarterly brand audits beat annual rebrands.
ROI Examples: What Brand Investment Returns
Three installer profiles, three brand investment paths, and the five-year revenue impact.
Profile A: New installer, year-one budget $35,000. Spent on naming, identity, photography, website, and a basic review system. Year-one revenue $1.8 million, year-five revenue $9.4 million. Referral percentage grew from 6 percent to 31 percent. CAC dropped from $2,800 to $1,100 over five years.
Profile B: Established installer, brand refresh at year 8. Spent $120,000 on new photography, website rebuild, proposal redesign, and updated positioning. Year-zero revenue $11 million, year-three revenue $19 million. Average ticket size up 8 percent. Net new referral lift of 14 percent.
Profile C: Discount-led installer, no brand investment. Spent $8,000 in year one, mostly on a logo and a free WordPress template. Year-one revenue $2.1 million, year-five revenue $3.6 million. Margin compressed by 4 percentage points. Closed shop in year six when the residential ITC expired.
The pattern repeats across every regional market. Brand investment compounds. Discount-led growth caps out.
The cost of not investing is harder to measure but real. Every quote lost to a competitor with stronger trust signals is brand debt. Every customer who shops three quotes instead of accepting yours is brand debt. Every install where the customer asks “can you match Tesla’s price?” is brand debt. Brand investment is the only way to pay the debt down.
Use SurgePV’s generation and financial tool to build proposal economics that hold up against competitor bids on value, not price.
Conclusion
Three actions to start this quarter:
- Write your position sentence in 15 words or less, then test it with three recent customers. Rewrite until it lands.
- Audit your trust stack: Google reviews, Solar Reviews score, EnergySage status, certifications, and citations. Fix the weakest link first.
- Build or rebuild your referral program with a $1,000 flat payout, double-sided incentives, and automated tracking. Ask for referrals at four moments: contract signing, install day, first bill, and one-year anniversary.
Brand is the only growth lever that compounds. Incentives come and go. Lead costs rise and fall. The installers that own a clear position, a deep review base, and a working referral engine survive every cycle. Start now.
Frequently Asked Questions
How long does it take to build a solar brand?
Plan for 5 to 10 years to build durable solar brand equity. A clear name, visual identity, and review base form in 12 to 18 months. Geographic recognition and a referral engine usually take 3 to 5 years. Defensible brand authority, where prospects ask for you by name, takes 5 to 10 years of consistent work.
How much should a solar installer spend on branding?
Most installers spend 5 to 10 percent of revenue on marketing, with a quarter of that on brand assets. A new installer should budget $25,000 to $80,000 in year one for visual identity, website, photography, and review systems. Established installers spend $100,000 to $300,000 yearly on brand maintenance, content, and community presence.
Are solar referral programs effective?
Yes. Referrals convert at 30 to 50 percent versus 2 to 5 percent for purchased leads, according to data from solar marketing firms. The average referred customer also spends more and asks for fewer competing quotes. Most installers pay $500 to $1,500 per closed referral, with commercial referrals reaching $5,000.
What is more important: Google reviews or Solar Reviews?
Google reviews drive local search visibility and have the largest reach. Solar Reviews ranks higher in solar-specific searches and influences educated buyers comparing installers. The best installers maintain both, plus EnergySage. Aim for 4.6 stars or higher on Google with at least 100 reviews, and active profiles on Solar Reviews and EnergySage.
Can I build a solar brand without paid ads?
Yes, but slowly. Referrals, local SEO, content marketing, and partnerships can sustain growth without paid ads, especially in markets under 250,000 people. National brands or fast scaling usually require paid channels. Most successful installers spend 60 percent on organic and 40 percent on paid in year three.
How do I differentiate a solar installer brand?
Pick a single sharp position. Best for tile roofs, fastest permits in the county, longest workmanship warranty, or only certified battery specialist. Generic claims like quality and service signal nothing. The brands that survive incentive cycles own one clear category in the customer’s mind.
Does a logo matter for a solar company?
A logo matters less than most owners think. A clean wordmark on trucks, hard hats, and proposals beats a complex symbol every time. Spend more on photography, uniforms, and proposal design than on logo iterations. Customers remember consistent visual systems, not clever marks.
What is the post-ITC marketing playbook?
Stop selling tax credits. Sell bill stability, blackout protection, and long-term home value. Move budget from paid lead generation to referral programs, content authority, and storage attachment. Train sales teams on cash flow and lease math, not rebate stacking. Lean on local SEO and trust signals rather than discount messaging.
Further Reading
- Marketing for Solar Installers covers the full marketing mix
- Solar Lead Generation Strategies breaks down channel economics
- Solar Company Marketing covers brand and demand together
- Solar Business Growth Strategies for scaling beyond the brand foundation
- Solar Customer Acquisition Cost for the math behind brand-led marketing
- Scale Solar Installation Business for operations that match the brand promise
- Best Solar Influencers for borrowed audience tactics
External references: SEIA, EnergySage, Solar Reviews, NREL, BBB, and the Wood Mackenzie distributed solar outlook.
Want to build proposals that match your brand from the first design view? Try SurgePV’s solar proposal software or talk to our team about solar design software built for installers who sell on value. Solar proposal software generates professional quotes in minutes.


