A solar system without monitoring is a car without a dashboard - you won't know something's wrong until it's expensive. Research from Fraunhofer ISE shows that monitored systems detect faults 3–6 months faster than unmonitored ones. The average undetected fault costs €300–1,000 in lost generation per year. That's before counting any equipment damage from running a system outside normal parameters.
This chapter covers two linked topics: commissioning (what you test before the system goes live) and monitoring (how you track performance for the system's entire 25-year life). Both matter. Skip commissioning and you have no baseline. Skip monitoring and you won't notice when things drift.
What You'll Learn
- Why monitoring matters and what it actually tracks
- The IEC 62446 commissioning tests required before monitoring starts
- Inverter-native vs third-party monitoring options
- The six key metrics in every solar dashboard
- How to configure performance alerts that actually fire
- A systematic approach to diagnosing underperformance
What Is Solar Monitoring and Why It Matters
Solar monitoring is real-time tracking of a PV system's energy production, self-consumption, grid export, and import. At the most basic level, it answers three questions: how much did the panels produce today, how much did the building use from solar, and how much went back to the grid.
At a more detailed level, monitoring shows performance at the string or individual panel level. That's where faults hide. A single underperforming panel in a string can drag down the entire string's output - and without string-level data, you'll never know which panel it is.
Most modern inverters include free cloud monitoring. The data is uploaded automatically via Wi-Fi or an ethernet connection. You access it through a web portal or smartphone app. Third-party platforms can aggregate data from multiple systems or brands into a single dashboard - useful for installers managing a portfolio of sites.
Key Takeaway
Activate monitoring on commissioning day. The first year's data becomes your performance baseline - the reference point for every future check. A system without year-1 data is much harder to diagnose when problems emerge in year 5 or 10.
The connection between monitoring and solar design software is direct. A good design produces an accurate energy yield estimate. Monitoring tells you whether the real system matches that estimate. If it doesn't, you investigate. That investigation loop - design estimate → real data → diagnosis - is what separates professional solar companies from ones that install and disappear.
IEC 62446 Commissioning: The Pre-Monitoring Step
IEC 62446 is the international standard that defines the minimum tests required before a PV system is handed over to the customer. It's mandatory in most European markets and increasingly required by insurers worldwide. The tests happen before the monitoring is active - or more precisely, completing them gives you the baseline data that makes monitoring meaningful.
Chapter 8 (Permits & Grid Connection) covers the full IEC 62446 test procedure. Here's the summary relevant to monitoring:
What IEC 62446 Produces
At the end of commissioning, you generate a test report. That report contains:
- Open-circuit voltage (Voc) for each string - establishes the expected voltage range at commissioning conditions
- Short-circuit current (Isc) per string - confirms all panels in a string are connected and producing
- Insulation resistance - confirms no DC wiring fault between conductors and earth
- Earth continuity - confirms the grounding circuit is intact
- Polarity check - confirms DC strings are wired with correct polarity before connecting to inverter
- Functional test - inverter powers up, connects to grid, and exports power correctly
This test report is your legal handover document. Keep it. When you compare string currents two years from now and something looks off, the commissioning report tells you what that string produced on day one.
The Performance Baseline
The commissioning report also records the irradiance at the time of testing, which lets you calculate the expected performance ratio at commissioning. That baseline PR - typically 76–84% for a well-installed residential system - is the benchmark every future monitoring review is compared against.
Without this baseline, "PR dropped 8%" means nothing. With it, "PR dropped 8% from the 81% commissioning baseline" tells you exactly how far the system has drifted from its original condition.
Solar Monitoring Options: Inverter vs Third-Party vs Smart Meter
Three monitoring approaches cover most residential and small commercial installations. They're not mutually exclusive - the best setups combine all three.
Inverter-Native Monitoring
Every major inverter brand now includes a free cloud monitoring platform:
| Brand | Platform | App | String-level data |
|---|---|---|---|
| SMA | Sunny Portal | SMA Energy | Yes (with energy meter) |
| Fronius | Solar.web | Fronius Solar.web | Yes |
| Huawei | FusionSolar | FusionSolar | Yes |
| Sungrow | iSolarCloud | iSolarCloud | Yes |
| Enphase | Enlighten | Enlighten | Panel-level (microinverters) |
Inverter-native monitoring is the easiest to set up and free to use. The main limitation is data lock-in: your monitoring is tied to that manufacturer's ecosystem. If you switch inverter brands in year 12, your monitoring history lives on the old platform.
Third-Party Monitoring Platforms
Platforms like Solar-Log, Loxone, and Home Assistant connect to most inverter brands via Modbus or manufacturer APIs. They offer brand-independent monitoring, better alerting tools, and portfolio-level dashboards for installers managing multiple sites.
PVOutput.org is a free community monitoring tool. Users upload daily production data and can compare their system against others with similar location, panel type, and system size. It's not real-time - data is typically uploaded once per day - but it's a useful benchmarking resource.
Smart Meter Consumption Monitoring
A production-only monitor tells you how much the panels generated. A revenue-grade smart meter installed at the consumer unit tells you how much the building consumed and how much was imported from the grid. The combination gives you:
- Self-consumption ratio: what percentage of solar production was used directly
- Self-sufficiency ratio: what percentage of total consumption came from solar
- Grid import pattern: when and how much grid electricity is drawn
These numbers drive battery sizing decisions. If self-consumption is 30%, adding storage can realistically push it to 70–80% - and the financial case for a battery becomes clear. Learn more about how generation data feeds into financial modeling at the generation and financial tool.
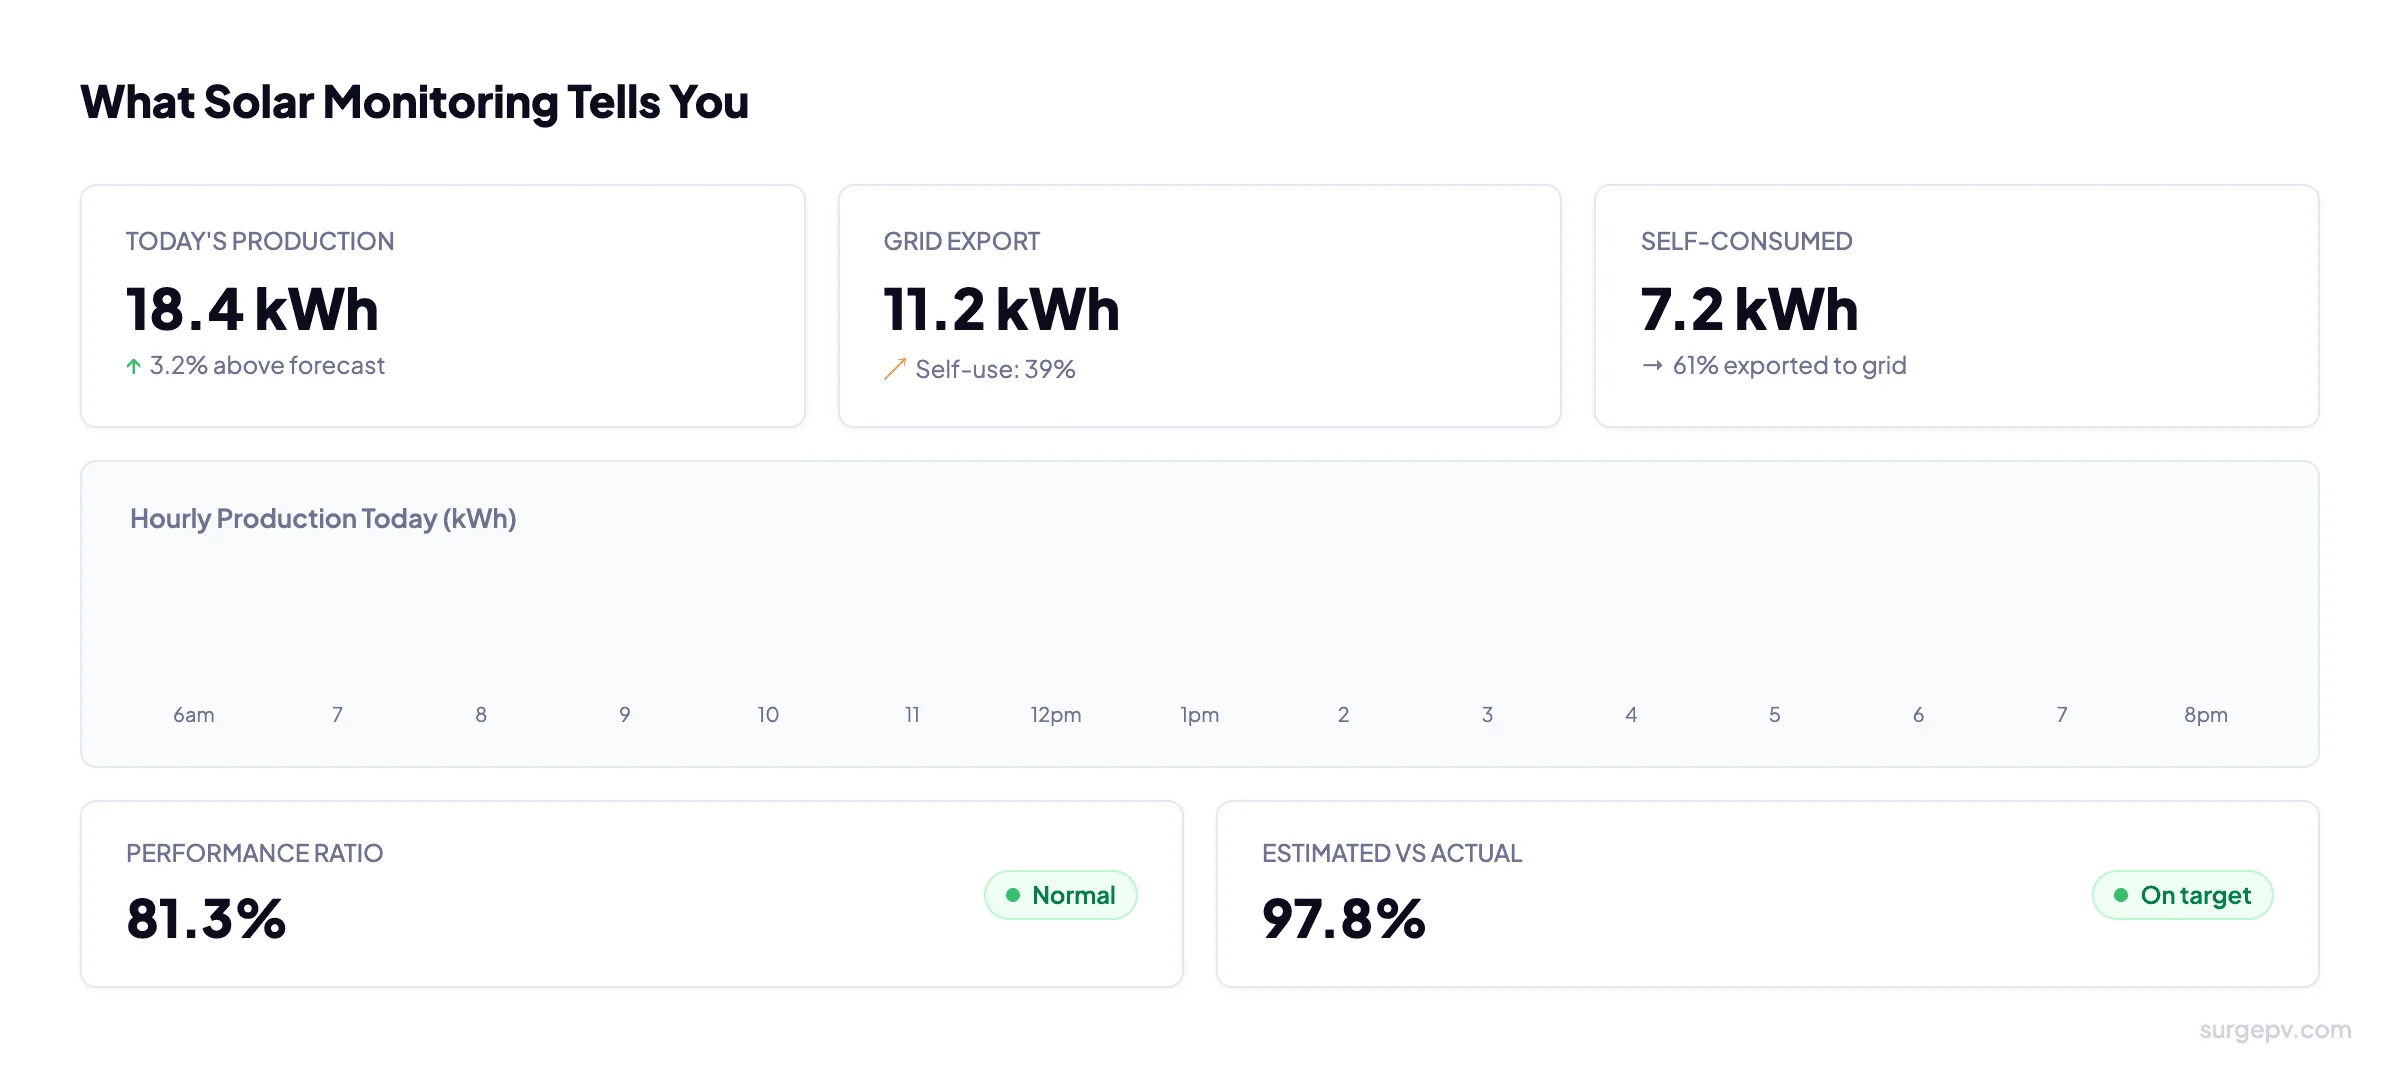
The Key Metrics to Track in Your Solar Dashboard
Six numbers tell you almost everything you need to know about a solar system's health.
Daily and Monthly Production (kWh)
The most visible metric. Compare against your design estimate - typically available from the installer's proposal. A single bad day is weather. A bad week in good weather is a fault. The comparison only works if you have the design forecast to compare against. This is why the solar design software estimate matters: it's the benchmark everything else is measured against.
Performance Ratio (PR)
PR is the ratio of actual energy output to theoretical maximum output given the irradiance received. It accounts for all system losses: inverter efficiency, wiring, temperature, shading, soiling, and degradation. A well-designed residential system achieves PR of 75–85%. Below 70% means something is wrong. Above 85% is excellent.
PR is the single best metric for comparing performance over time because it removes the effect of weather. A PR of 81% in January and 81% in July means the system is performing consistently - even though January's production in kWh is much lower.
Specific Yield (kWh/kWp)
Annual production divided by system peak capacity. This normalizes performance across different system sizes. A 900 kWh/kWp specific yield in the UK is typical. 1,100 kWh/kWp is excellent. Below 800 kWh/kWp warrants investigation.
Self-Consumption Ratio
The percentage of total solar production that was consumed directly by the building. Typical values: 30–40% for a working household with an average load profile. 60–80% if there's a battery or a large daytime load (e.g., EV charging during the day). Higher self-consumption means less exported at low feed-in tariff rates and more energy displacing expensive grid imports.
Self-Sufficiency Ratio
The percentage of total household consumption covered by solar. In the UK with a 4 kW system: typically 40–55% in summer, 10–20% in winter, 30–40% annually. Adding battery storage or an EV charger with smart scheduling can push this to 60–70%.
String-Level Current Comparison
On systems with multiple strings, comparing the current from each string is the most reliable early fault detection method. Strings with identical panel count and orientation should produce within 2–3% of each other. A string running at 85% of its peers likely has a panel fault, a shadow issue, or a connector problem. The shadow analysis baseline from the original design tells you whether the difference is shading-related or something new.
Pro Tip
Download a monthly CSV export from your monitoring platform on the first of each month. Store it in a folder with the system address and date. If you ever need to make a warranty claim, this data proves the fault history without relying on the manufacturer's servers staying live for 25 years.
Setting Up Performance Alerts
Alerts are the most underused feature in solar monitoring platforms. Most installers activate the system, hand over the app, and never configure alerts. That means faults sit undetected until the customer notices their bill has increased.
Set these alerts on commissioning day:
Zero Production During Daylight Hours
If the system produces zero kWh between 9am and 4pm on any day, send an immediate email or push notification. This catches inverter trips, communication failures, and DC isolation faults. It should fire within hours of a fault, not days.
How to set it: most inverter platforms have a "production below threshold" alert. Set threshold to 0.5 kWh/h and trigger after 2 consecutive hours in the configured daylight window.
Production Below 50% of Forecast for 3+ Consecutive Days
This catches major faults that don't cause a complete shutdown: a failed string, partial shading from a new obstruction, a stuck inverter operating in reduced power mode. The 3-day window avoids false alarms from cloudy periods.
Individual String Fault
If your inverter platform supports string-level alerting, configure an alert when any string falls below 80% of the average of all strings on the same inverter. This is the most sensitive fault detector available without panel-level microinverters.
Alert Setup Checklist
- Zero production during daylight - immediate alert
- Production under 50% of forecast for 3+ days - daily alert
- String current imbalance above 20% - weekly review
- Inverter fault code active - immediate alert
- Communication loss (inverter offline) for 24+ hours - daily alert
Design Systems That Are Easy to Monitor
SurgePV produces accurate energy forecasts - the baseline every monitoring comparison depends on.
Book Free Demo20 minutes · Live walkthrough · No commitment
How to Spot and Diagnose Underperformance
Underperformance is any sustained drop in output that isn't explained by weather. Here's a systematic approach to diagnosing it.
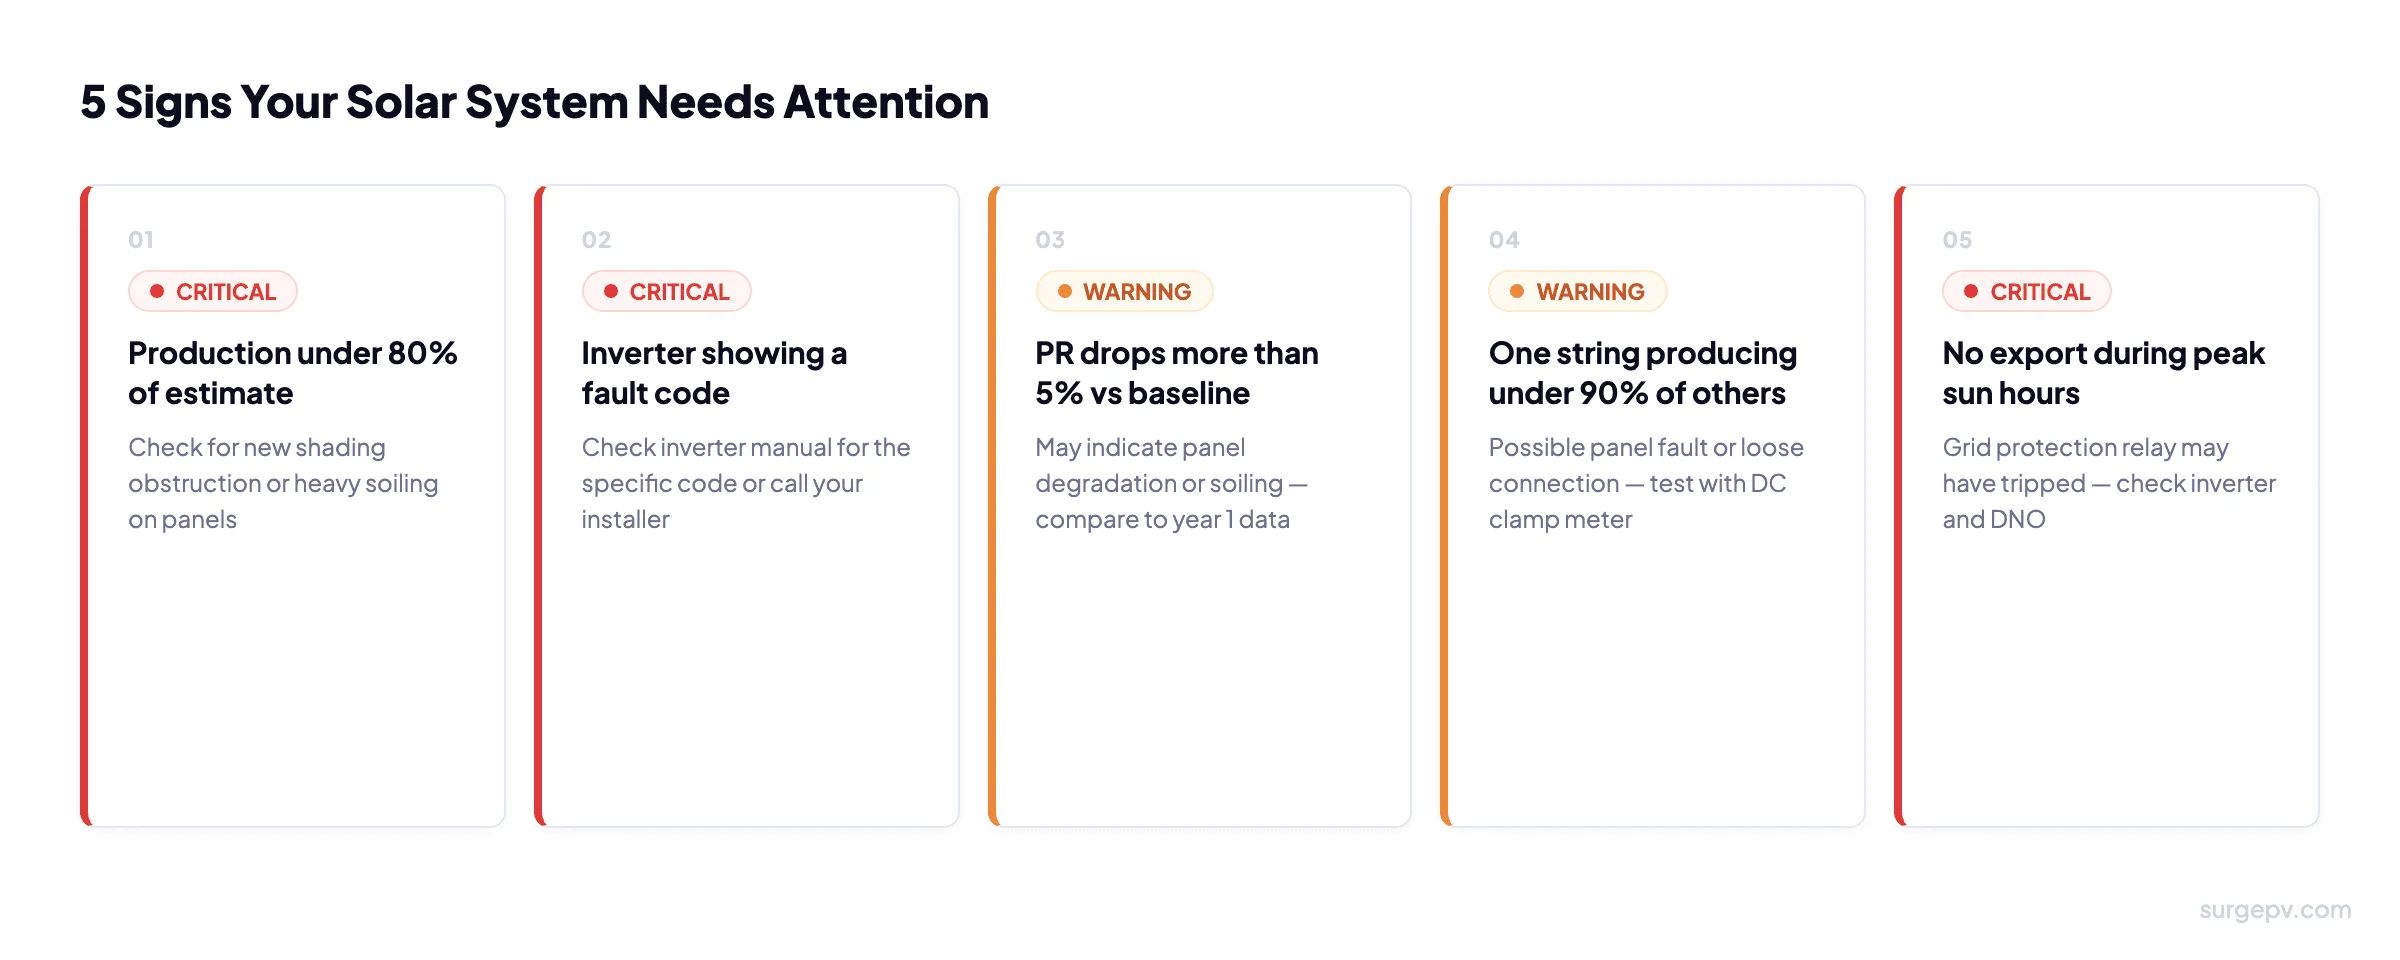
Step 1: Compare PR to Commissioning Baseline
Calculate the PR for the period in question and compare to the commissioning baseline PR. A drop of more than 5% is a fault until proven otherwise. A drop of 1–3% year-on-year is consistent with normal panel degradation (0.35–0.5%/year).
Step 2: Check String-Level Current Balance
Are all strings producing in proportion to each other? If string 2 is producing 75% of string 1 with identical panel count and orientation, there's a fault in string 2. Possible causes: one panel in the string has a failed bypass diode, an MC4 connector has water ingress, a panel has micro-cracking from a storm, or there's a new shading obstruction affecting only that string.
Step 3: Check the Inverter Fault Log
Every inverter records a fault log in its monitoring platform. Common faults and what they mean:
| Fault type | Likely cause | Action |
|---|---|---|
| Grid overvoltage | Distribution network voltage too high (common in rural areas) | Contact DNO; may need grid voltage setting adjusted |
| Overtemperature | Inverter enclosure too hot - insufficient ventilation clearance | Check 15 cm clearance above/below; clean any dust blockage on vents |
| Insulation fault | DC wiring fault - potential shock hazard | Isolate immediately and call a qualified installer |
| Islanding / anti-islanding | Grid disturbance or protection relay setting mismatch | Usually self-resolves; if frequent, check DNO settings |
Step 4: Check for New Shading
Satellite imagery comparison is the fastest way to identify new shading obstructions. Compare a current satellite view (Google Maps, Bing) to the site survey photos taken at commissioning. A tree that has grown into the sun path will show up clearly. This is where the original solar shadow analysis model becomes useful - run the shade analysis again with the new obstruction to quantify the loss.
Step 5: Inspect for Soiling
Dust, bird droppings, lichen, and pollen accumulation reduce output. A single bird dropping on a cell in a panel without bypass diodes can affect the entire string. Soiling losses of 5–15% are common in dusty or urban environments without regular cleaning. Visual inspection from the ground (or using a drone) is enough to identify obvious soiling.
Step 6: Establish the Annual Baseline
After the first full year of data, calculate annual specific yield and annual PR. Write it down. Every subsequent year, compare to this baseline. Any year that comes in more than 5% below the previous year's adjusted baseline (accounting for that year's irradiance from a local weather station or satellite data source) should trigger a full inspection.
Further Reading
Chapter 10 - Solar Panel Maintenance - covers how to act on what monitoring finds: cleaning schedules, inverter health checks, and when to call your installer vs handle it yourself.
Frequently Asked Questions
Do I need a solar monitoring system?
You don't legally need one, but you should have one. Unmonitored systems lose an average of 3–8% more generation to undetected faults. Most modern inverters include free cloud monitoring - there's no reason not to activate it on installation day.
Can I monitor my solar panels from my phone?
Yes. All major inverter brands include a smartphone app. Fronius Solar.web, Huawei FusionSolar, and SMA Sunny Portal are the most widely used in Europe. Setup takes 10–15 minutes during commissioning and requires the system to have a Wi-Fi or ethernet connection.
What is a good performance ratio for a solar system?
A well-installed residential system should achieve PR of 75–85%. Below 70% indicates a problem worth investigating. Above 85% is excellent. Your commissioning report establishes the baseline PR for all future comparisons - it's the most important document your installer produces.
Continue Learning
Next: Chapter 10 - Solar Panel Maintenance Guide covers annual inspection schedules, cleaning technique, inverter health checks, and troubleshooting the 10 most common solar faults.
About the Contributors

CEO & Co-Founder · SurgePV
Keyur Rakholiya is CEO & Co-Founder of SurgePV and Founder of Heaven Green Energy Limited, where he has delivered over 1 GW of solar projects across commercial, utility, and rooftop sectors in India. With 10+ years in the solar industry, he has managed 800+ project deliveries, evaluated 20+ solar design platforms firsthand, and led engineering teams of 50+ people.