Quick Answer
SEIA tracks approximately 65 GW of module assembly capacity against roughly 40 GW of domestic installation demand. First Solar, Qcells, Silfab, Heliene, Canadian Solar, Suniva Solar cells. ~3.2 GW. ~5%. First Solar (CdTe), Qcells (ramping), T1 Energy (end 2026) Wafers. ~5 GW. ~8%. Qcells Cartersville (delayed to end 2026) Polysilicon. ~20,000 MT. ~10 GW equivalent.
The popular narrative is that IRA tax credits are building a self-sufficient US solar supply chain. The reality in 2026 is more measured: module assembly capacity has grown from 8 GW pre-IRA to roughly 65 GW today, but solar cell output sits at 3.2 GW and wafer manufacturing is only now starting from a near-zero base. You can assemble panels in Georgia, Ohio, or Minnesota. You still cannot make the cell that goes inside most of them without importing it.
SEIA tracks approximately 65 GW of module assembly capacity against roughly 40 GW of domestic installation demand. First Solar, Qcells, Silfab, Heliene, Canadian Solar, Suniva Solar cells. ~3.2 GW. For Canada-specific compliance details, see Canada comparisons/solar-design-software.
This guide covers what actually got built, where, and at what cost. It names the factories, the failures, and the gaps. It explains why the US has 20× more module capacity than cell capacity, what Section 45X credits actually paid for, and why the next four years will determine whether reshoring becomes a permanent industrial base or a temporary subsidy story.
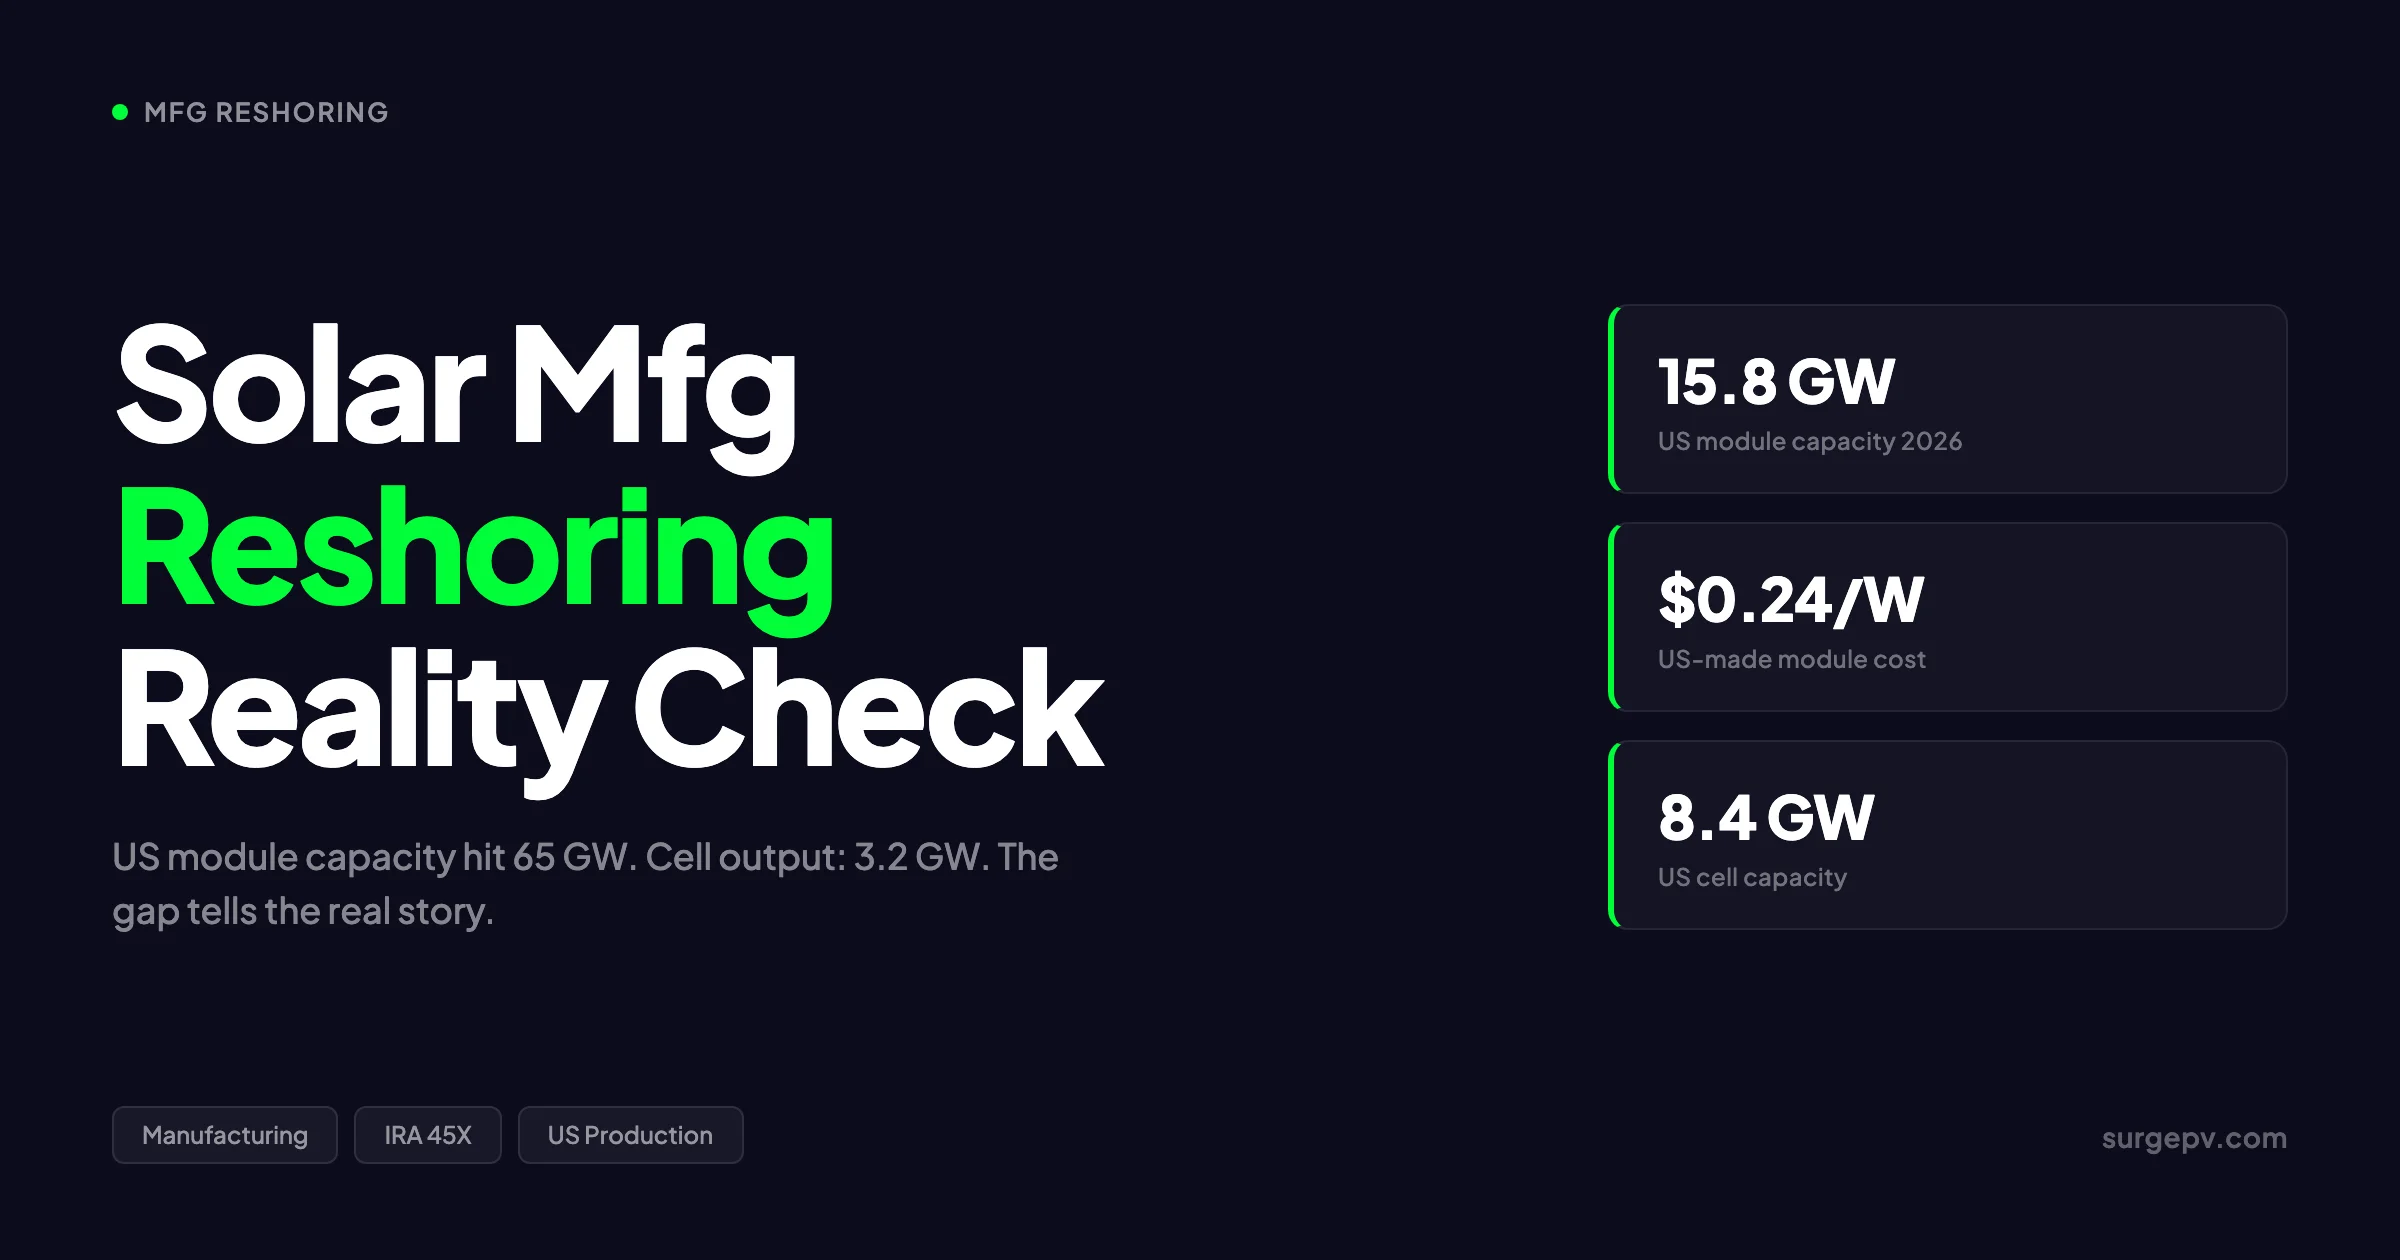
TL;DR — Solar Manufacturing Reshoring 2026
US module assembly: ~65 GW. US cell output: 3.2 GW. US wafer capacity: ~5 GW. First Solar and Hanwha Qcells account for roughly half of US module production. IRA Section 45X drove $3B+ in investments but the credits phase out after December 31, 2026. US-assembled modules cost $0.325–0.36/W; fully domestic modules cost $0.42–0.46/W versus $0.265/W for imports. REC Silicon shut down its Moses Lake polysilicon plant in 2025. The EU is further behind, with only 4–12 GW of module capacity and zero wafer production.
In this guide:
- US solar manufacturing capacity 2026 — module, cell, wafer, and ingot breakdown
- IRA Section 45X — what the credits paid for and what they did not
- Factory by factory — who built what, where, and when
- The US cell and wafer gap — why upstream manufacturing lags
- What most reshoring reports get wrong — a contrarian view
- Polysilicon production — the raw material problem
- EU and India — alternative reshoring narratives
- Cost reality — US-made versus imported modules
- 2027–2030 outlook — will the supply chain ever complete? Also see: Best Solar Design Software India.
US Solar Manufacturing Capacity 2026: Module, Cell, Wafer, Ingot
The US solar manufacturing map in 2026 looks impressive at the module level and thin everywhere else. SEIA tracks approximately 65 GW of module assembly capacity against roughly 40 GW of domestic installation demand. That is a healthy surplus. But the upstream picture tells a different story.
US Solar Manufacturing Capacity by Segment (2026)
| Segment | Annual Capacity | Share of Module Needs | Key Producers |
|---|---|---|---|
| Module assembly | ~65 GW | 100%+ | First Solar, Qcells, Silfab, Heliene, Canadian Solar, Suniva |
| Solar cells | ~3.2 GW | ~5% | First Solar (CdTe), Qcells (ramping), T1 Energy (end 2026) |
| Wafers | ~5 GW | ~8% | Qcells Cartersville (ramping), Corning (limited) |
| Ingots | under 1 GW | under 2% | Qcells Cartersville (delayed to end 2026) |
| Polysilicon | ~20,000 MT | ~10 GW equivalent | Hemlock Semiconductor (Michigan) |
Sources: SEIA Solar and Storage Supply Chain Dashboard, Wood Mackenzie Q1 2026, IEA Energy Technology Perspectives 2026.
The 65 GW module number is real capacity — physical lines running in physical factories. The 3.2 GW cell number is also real, but it is heavily concentrated in First Solar’s thin-film cadmium telluride (CdTe) technology, which does not use silicon wafers at all. For crystalline silicon modules — the roughly 70% of US output that is not First Solar — essentially every cell is imported.
This matters because crystalline silicon dominates global solar technology. PERC, TOPCon, and heterojunction (HJT) cells all start with polysilicon, go through ingot pulling, wafer slicing, cell fabrication, and then module assembly. The US has built the last step at scale and barely touched the first four. For Global-specific compliance details, see Global net-metering-by-country.
Key Takeaway — The Cell Gap Defines Reshoring
The 60+ GW gap between module assembly and cell production is not a rounding error. It is the structural feature of US solar manufacturing in 2026. Every GW of cell capacity requires $200–400 million in capital equipment, 18–24 months of construction, and a workforce with semiconductor-level clean-room skills. Module assembly lines cost one-tenth as much and hire from general manufacturing labor pools. The economics explain why investors built modules first.
Technology Split in US Cell Production
First Solar’s CdTe thin-film technology accounts for approximately 80% of all US solar cell production in 2026, according to PV Magazine USA’s April 2026 manufacturing survey. That is a remarkable concentration — and it is not silicon-based. Also see: Us Residential Solar Market Trends 2026.
| Technology | US Cell Share (2026) | Key Producer | Notes |
|---|---|---|---|
| CdTe thin-film | ~80% | First Solar | Fully integrated; no silicon supply chain needed |
| PERC / HJT c-Si | ~15% | Qcells, Canadian Solar | Ramping; uses imported wafers/cells initially |
| Other / pilot | ~5% | T1 Energy, Suniva | Pre-commercial or limited output |
This technology split has a policy implication. First Solar’s CdTe process qualifies for Section 45X credits as a fully integrated manufacturing step, which treats thin-film deposition as equivalent to cell production. Crystalline silicon manufacturers must build or buy each upstream step separately to claim the full credit stack. The result: First Solar captured a disproportionate share of 45X value while c-Si competitors struggled to justify wafer and cell investments.
IRA Section 45X: Tax Credits That Reshored the Industry
The Inflation Reduction Act’s Section 45X production credit is the single policy tool that made US solar manufacturing economically viable after a decade of decline. Without it, none of the factories built since 2022 would have broken ground.
Section 45X Credit Rates for Solar Components
| Component | Credit Rate | Approximate Value per GW | Key Requirement |
|---|---|---|---|
| Polysilicon | $3/kg | ~$6 million | Solar-grade purity; produced in US |
| Solar wafers | $12/m² | ~$15 million | Sliced in US from US or imported ingots |
| Solar cells | $0.04/W | ~$40 million | Fabricated in US |
| Solar modules | $0.07/W | ~$70 million | Assembled in US; cells can be imported |
| Backsheets / encapsulant | $0.40/m² | ~$2 million | Produced in US |
Source: IRS Notice 2023-44, Treasury Department guidance.
A vertically integrated manufacturer producing polysilicon through finished modules could theoretically claim over $130 million per GW in production credits. In practice, no US company achieves full vertical integration. First Solar claims the module and cell credits. Qcells aims to claim the full stack from ingots to modules by end of 2026. Heliene and Silfab claim module credits only, using imported cells.
Total 45X Investment Impact
| Metric | Value | Source |
|---|---|---|
| Announced manufacturing investments (post-IRA) | $3 billion+ | SEIA, 2025 |
| Jobs created in solar manufacturing | 9,500+ | SEIA, 2025 |
| Module capacity added (2022–2026) | ~57 GW | SEIA Supply Chain Dashboard |
| Estimated annual 45X cost to Treasury (peak) | $2–4 billion | Congressional Budget Office |
The credits worked as designed for module assembly. They have not yet worked for upstream components. The reason is simple math: a module assembly line costs $20–40 million per GW and generates $70 million in annual credits. A cell fab costs $200–400 million per GW and generates $40 million in credits. The return on capital is 1.75–3.5× for modules versus 0.1–0.2× for cells. Investors followed the numbers.
The OBBBA Phase-Out Problem
The One Big Beautiful Bill Act, passed in mid-2025, accelerated the phase-out of Section 45X credits. For solar components:
- Solar modules and cells: Credits end after December 31, 2026
- Wind components: Credits end after 2027
- Critical minerals: Phase-out through 2033
This compressed timeline created a rush to complete factories before the deadline. It also reduced the incentive for long-term upstream investments. A cell factory that takes 24 months to build and 12 months to ramp would only capture 6–12 months of full credits before the cliff. Several planned cell and wafer projects were shelved or delayed after OBBBA passed.
Pro Tip — Domestic Content Bonus Math
The 10% domestic content bonus under the IRA Investment Tax Credit (Section 48E) is often more valuable than 45X for project developers. On a $100 million utility-scale project, 10% of the ITC is $3–4 million in additional tax equity. That bonus requires 40% domestic content in 2026, rising to 45% in 2027. For crystalline silicon projects, the threshold is typically met with US-made modules, domestic steel racking, and US inverters — even with imported cells. Use solar proposal software that models domestic content scenarios against total project economics.
See Solar Racking Design Guide for detailed guidance.
Factory by Factory: Who Built What and Where
The US solar manufacturing landscape in 2026 is concentrated in a handful of states and dominated by a few large players. Here is the complete operational and planned factory map.
Major US Solar Manufacturing Facilities (2026)
| Company | Location | Capacity | Product | Status | Investment |
|---|---|---|---|---|---|
| First Solar | Perrysburg, OH (3 plants) | ~10 GW | CdTe modules | Operational | Part of $1.1B+ |
| First Solar | Lawrence County, AL | 3.5 GW | CdTe modules | Operational since 2024 | $1.1 billion |
| First Solar | Louisiana | 3.5 GW | CdTe modules | Commissioning 2026 | Part of expansion |
| Hanwha Qcells | Dalton, GA | 5.1 GW | c-Si modules | Operational since 2019 | $2.5B total |
| Hanwha Qcells | Cartersville, GA | 3.3 GW | Ingots, wafers, cells, modules | Module production started April 2025; full integration end 2026 | $2.5B total |
| Silfab Solar | Bellingham, WA | ~1.5 GW | c-Si modules | Operational | Ongoing expansion |
| Silfab Solar | Fort Mill, SC | ~1.5 GW | c-Si modules | Operational | New line added |
| Heliene | Mountain Iron, MN | 800 MW | c-Si modules | Operational | $54M for MN Line 3 |
| Heliene | Rogers, MN | 500 MW | c-Si modules | Operational since April 2025 | $54M funding |
| Canadian Solar | Jeffersonville, IN | 2.1 GW | HJT modules | Ramping 2026 | Major HJT investment |
| Suniva | Norcross, GA | ~1 GW | c-Si cells & modules | Restarted 2024 | Post-bankruptcy restart |
| T1 Energy | Rockdale, TX | 2.1 GW | c-Si cells | Coming online end 2026 | New entrant |
| Meyer Burger | Goodyear, AZ | 0 | HJT modules | Shut down May 2025 | $10.2M equipment sale |
Sources: SEIA, company announcements, Solar Power World, PV Magazine USA.
First Solar: The Outlier
First Solar is the only US solar manufacturer that was already large before the IRA and has grown larger since. Its CdTe thin-film technology avoids the silicon supply chain entirely — no polysilicon, no wafers, no cells from China. First Solar manufactures the semiconductor layer (CdTe deposition) in-house and claims both cell and module credits under 45X.
By end of 2026, First Solar expects roughly 14 GW of US manufacturing capacity across Ohio, Alabama, and Louisiana. It announced an additional 3.7 GW factory in late 2025 with production starting late 2026 and full ramp in early 2027. The company also enforces its TOPCon patent portfolio aggressively, including a Section 337 investigation that creates additional friction for crystalline silicon competitors.
First Solar’s 2026 financial guidance explicitly assumes continued Section 45X credits. If the phase-out is not extended, the company’s US expansion calculus changes materially.
Hanwha Qcells: The Vertical Integration Bet
Hanwha Qcells is the most important crystalline silicon story in US solar manufacturing. Its $2.5 billion Georgia investment represents the only attempt at full vertical integration — from polysilicon ingots to finished modules — in the United States.
The Dalton plant (5.1 GW) has operated since 2019 and assembles modules using imported cells. The Cartersville plant (3.3 GW) is the critical piece: it aims to produce ingots, wafers, cells, and modules in a single facility. Module production began in April 2025. Full integration was delayed from 2025 to end of 2026.
The delay matters. Qcells planned to source polysilicon from REC Silicon’s Moses Lake plant, which shut down in January 2025 after failing quality qualification. Qcells is now sourcing from OCI Holdings in Malaysia for its Georgia wafer production. The Cartersville facility received a $1.45 billion DOE loan guarantee, making it one of the most heavily subsidized manufacturing projects in US history.
If Cartersville achieves full integration by end of 2026, Qcells will be the only company in North America producing all key solar components domestically. That would make its modules eligible for the full domestic content bonus and the full 45X stack.
The Failures: Meyer Burger and REC Silicon
Not every reshoring story succeeded. Meyer Burger, the Swiss-German heterojunction pioneer, shut down its Arizona module factory in May 2025 after laying off 282 workers. The company had canceled its Colorado Springs cell factory plans in August 2024, citing inability to monetize 45X credits. Meyer Burger filed for Chapter 11 bankruptcy and sold its US production equipment for approximately $10.2 million. See our guide on Community Solar Projects Germany for more. Read Community Solar Business Model for a complete walkthrough.
REC Silicon’s Moses Lake, Washington polysilicon plant restarted in late 2023 after a five-year idle, only to shut down permanently in January 2025. The plant could not achieve solar-grade purity standards for its sole customer, Qcells. REC Silicon laid off 224 workers and pivoted to silicon gases for battery anodes.
These failures illustrate a hard truth: manufacturing subsidies do not guarantee manufacturing success. Technical execution, offtake agreements, and capital discipline matter as much as policy support.
US Cell and Wafer Manufacturing Gap: The Missing Links
The most misunderstood aspect of US solar reshoring is the cell and wafer gap. Headlines celebrate 65 GW of module capacity. They rarely mention that 95% of the cells inside those modules are imported.
Why Cells Are Hard
Solar cell manufacturing is closer to semiconductor fabrication than to assembly-line work. The process involves:
- Texturing — etching pyramid structures into silicon wafer surfaces
- Doping — diffusing phosphorus or boron at 800–900°C to create p-n junctions
- Passivation — depositing dielectric layers (AlOx, SiNx) to reduce recombination
- Metallization — screen-printing silver paste contacts at micron precision
- Testing and sorting — flash testing each cell for efficiency binning
Each step requires clean-room conditions, precise temperature control, and equipment that costs $50–100 million per GW of capacity. A cell fab employs PhD-level process engineers, not general manufacturing labor. The workforce simply does not exist in most US markets at the scale required.
The Economics of Cell versus Module Investment
| Metric | Module Assembly | Cell Fabrication | Ratio |
|---|---|---|---|
| Capital cost per GW | $20–40 million | $200–400 million | 6–10× |
| 45X credit per GW | $70 million | $40 million | 0.6× |
| Annual OPEX per GW | $8–12 million | $25–40 million | 2–3× |
| Workforce per GW | 200–400 | 500–800 | 1.5–2× |
| Construction timeline | 8–12 months | 18–24 months | 1.5–2× |
| Payback period (with 45X) | 1–2 years | 4–8 years | 3–4× |
The payback math explains investor behavior. Module assembly pays back in 1–2 years with 45X credits. Cell fabrication pays back in 4–8 years even with credits. Without credits, cell manufacturing in the US is not economically viable against Chinese competition.
Planned Cell and Wafer Projects
| Project | Location | Capacity | Timeline | Status |
|---|---|---|---|---|
| Qcells Cartersville | Georgia | 3.3 GW (integrated) | End 2026 | Delayed; module production started |
| T1 Energy | Rockdale, TX | 2.1 GW (phase 1) | End 2026 | Under construction |
| T1 Energy (phase 2) | Rockdale, TX | 3.2 GW | 2027 | Planned |
| Heliene / Premier Energies | Minneapolis, MN | 1 GW | Q2 2026 | Joint venture; cell production |
| NorSun | Oklahoma | 5 GW | Canceled | Halted in 2025 |
| Meyer Burger | Colorado Springs, CO | 2 GW | Canceled | Canceled August 2024 |
NorSun’s $620 million, 5 GW ingot and wafer factory in Oklahoma was halted in 2025, representing a major blow to US wafer ambitions. The Norwegian company cited market conditions and policy uncertainty. That single cancellation removed more planned wafer capacity than currently exists in the entire United States.
Key Takeaway — The Cell Gap Will Persist
Even if every planned US cell project comes online on schedule, domestic cell capacity would reach approximately 10–12 GW by 2028. Against 65+ GW of module assembly and 40–50 GW of installation demand, that leaves a 30–50 GW cell deficit. The gap narrows but does not close. US solar manufacturing will remain a module-assembly story with imported cells for the foreseeable future.
What Most Reshoring Reports Get Wrong
Most published analyses of US solar manufacturing reshoring make three errors that distort the real picture.
Error 1: Conflating Module Assembly with Manufacturing
When SEIA reports 65 GW of US “solar manufacturing capacity,” the number refers primarily to module assembly — screwing frames, laminating glass, and connecting junction boxes. The actual value-added manufacturing (cell fabrication, wafer slicing, ingot pulling, polysilicon purification) happens overwhelmingly abroad.
This is not a criticism of SEIA’s methodology. Module assembly is a real manufacturing step that creates real jobs. But calling 65 GW of assembly capacity “self-sufficiency” is misleading. A country that assembles cars from imported engines is not self-sufficient in automobile manufacturing. The same logic applies to solar.
Error 2: Assuming 45X Credits Created a Permanent Industry
Section 45X credits expire for solar components after December 31, 2026. The factories built since 2022 were financed with 4–5 years of credit revenue in their pro formas. After the cliff, these factories must compete on operational cost alone.
US module assembly costs are estimated at $0.18–0.22/W before credits. Chinese module manufacturing costs are approximately $0.09–0.11/W. The $0.07/W module credit closes most of that gap. Without it, US assembly becomes economically marginal unless tariffs keep import prices elevated.
The implicit bet of US solar reshoring is not that American factories are inherently competitive. It is that American trade policy will keep import prices high enough to protect domestic production. That is a policy bet, not a manufacturing bet.
Error 3: Ignoring the Technology Divergence
US solar cell technology is diverging from the global mainstream. While China and most of Asia have shifted to TOPCon (tunnel oxide passivated contact) cells, US production is split between First Solar’s CdTe thin-film and a mix of PERC and HJT crystalline technologies.
TOPCon now dominates global cell production with roughly 70% market share. The US has minimal TOPCon capacity. This creates a long-term competitiveness risk: if TOPCon continues to improve efficiency faster than CdTe or HJT, US-made modules could face a technology disadvantage even if they achieve cost parity.
The Real Narrative
US solar reshoring in 2026 is best understood as a trade-policy-driven restructuring, not a spontaneous industrial renaissance. Tariffs raised import prices. Subsidies covered domestic costs. The combination made US assembly viable. Upstream components — cells, wafers, ingots — remain uneconomic even with subsidies, which is why they were not built at scale.
This is not failure. It is the predictable outcome of policy design that prioritized quick capacity additions (modules) over slow, capital-intensive investments (cells). The question for 2027–2030 is whether the module assembly base is large enough to justify backward integration into cells and wafers, or whether it remains permanently dependent on imported inputs.
Model Domestic Content Scenarios in Your Solar Proposals
SurgePV’s solar proposal software lets you compare project economics with and without the domestic content bonus, model 45X credit pass-throughs, and present accurate cost comparisons between US-made and imported modules. Stop guessing at incentive stacking.
Book a DemoNo commitment required · 20 minutes · Live project walkthrough
For France-specific information, see Agricultural Solar Case Study.
Polysilicon Production: The Raw Material Problem
Polysilicon is the foundational input for crystalline silicon solar. Without it, there are no wafers, no cells, and no modules. The US polysilicon story in 2026 is one of contraction, not expansion.
US Polysilicon Capacity Timeline
| Year | US Capacity | Key Plants | Notes |
|---|---|---|---|
| 2019 | ~50,000 MT | Hemlock (MI), REC Silicon (WA), Wacker (TN) | Pre-trade war baseline |
| 2021 | ~20,000 MT | Hemlock (MI), REC Silicon idle | Chinese tariffs idled REC |
| 2023 | ~35,000 MT | Hemlock (MI), REC Silicon restarting | REC restarted late 2023 |
| 2024 | ~45,000 MT | Hemlock (MI), REC Silicon (WA) | REC targeting 16,000 MT |
| 2025 | ~20,000 MT | Hemlock (MI) only | REC shut down January 2025 |
| 2026 | ~20,000 MT | Hemlock (MI) only | No new plants operational |
Hemlock Semiconductor in Michigan is now the only operational US producer of solar-grade polysilicon. The company produces both semiconductor-grade and solar-grade material, with the higher-margin semiconductor business cross-subsidizing solar production. Hemlock has announced expansion plans but has not committed to specific capacity targets publicly.
The REC Silicon Failure
REC Silicon’s Moses Lake plant was supposed to be the comeback story of US polysilicon. The facility used fluidized bed reactor (FBR) technology to produce granular polysilicon at lower energy cost than traditional Siemens process plants. Hanwha Qcells acquired a 16.6% stake in REC Silicon in 2021 and signed a 10-year offtake agreement to supply its Georgia wafer plant.
The plant restarted in late 2023 after a five-year idle. By late 2024, it was producing material but could not meet Qcells’ quality specifications. Impurities from post-reactor handling systems persisted despite multiple fix attempts. Qcells canceled the offtake agreement. REC Silicon shut down polysilicon production, laid off 224 workers, and pivoted to silane gas for battery anodes.
The failure had cascading effects. Qcells’ Cartersville wafer production was delayed because it lost its planned domestic polysilicon source. The company now sources from OCI Holdings in Malaysia, adding supply chain miles and tariff exposure.
Global Polysilicon Context
| Producer | Country | 2026 Capacity | Share |
|---|---|---|---|
| Tongwei | China | ~450,000 MT | ~25% |
| GCL Tech | China | ~400,000 MT | ~22% |
| Daqo New Energy | China | ~300,000 MT | ~17% |
| Xinte Energy | China | ~250,000 MT | ~14% |
| Wacker Chemie | Germany | ~80,000 MT | ~4% |
| OCI Holdings | Malaysia | ~60,000 MT | ~3% |
| Hemlock Semiconductor | USA | ~20,000 MT | ~1% |
| Others | Various | ~250,000 MT | ~14% |
China produces more than 80% of global polysilicon. The Xinjiang region alone accounts for roughly 40% of world supply, subject to UFLPA import restrictions. The US produces approximately 1% of global polysilicon — enough for roughly 5–8 GW of cell production, far below domestic demand.
Further Reading
For the full picture on how trade policy shapes module sourcing costs, see our solar trade tariffs impact analysis 2026. For the broader supply chain context including shipping, inverter markets, and global capacity, see solar supply chain trends 2026.
EU and India: Alternative Reshoring Narratives
The US is not the only region trying to reshore solar manufacturing. The EU and India have launched parallel efforts with different mechanisms and equally mixed results. For India-specific information, see 5kW Solar Panel Price in India.
EU: The NZIA and Industrial Accelerator Act
The EU’s Net-Zero Industry Act (NZIA), adopted in May 2025, aims to ensure that 40% of EU-deployed clean energy equipment is manufactured in Europe by 2030. For solar, that translates to roughly 24–32 GW of annual module production. Also see: European Solar Incentives.
Current EU module capacity is estimated at 4–12 GW depending on what counts as “operational.” The EU has zero ingot and wafer capacity and minimal cell production. SolarPower Europe’s Fraunhofer ISE study found that EU-made modules cost 2.2–5.8 €ct/Wp more than NZIA-compliant non-EU modules, with a 14.5% LCOE premium.
| EU Solar Manufacturing | Current (2026) | NZIA 2030 Target |
|---|---|---|
| Module capacity | ~4–12 GW | 24–32 GW |
| Cell capacity | ~2 GW | 76 GW |
| Ingot/wafer capacity | 0 GW | 76 GW |
| Polysilicon capacity | ~25 GW equivalent | 76 GW |
The EU’s approach relies on non-price criteria (NPCs) in renewable energy auctions rather than direct production subsidies. Member states must apply NPCs to at least 30% of auctioned volume. The Industrial Accelerator Act, proposed in March 2026, would add “Made in EU” requirements for inverters and cells in publicly supported projects.
Dries Acke, Deputy CEO of SolarPower Europe, called the Industrial Accelerator Act a “watershed moment for industrial policy in Europe.” The reality is more cautious: the EU is further behind the US in solar manufacturing and lacks the direct subsidy firepower of the IRA.
India: The PLI Scheme
India’s Production Linked Incentive (PLI) scheme for solar modules has been more successful than the EU’s NZIA in driving capacity additions. The program allocated ₹24,000 crore (~$2.7 billion) across two tranches, awarding capacity to 12 manufacturers.
| India Solar Manufacturing | Capacity (2026) | Notes |
|---|---|---|
| Module capacity | ~144–172 GW | Exceeds domestic demand; export-oriented |
| Cell capacity | ~29–30 GW | Growing; ALMM List-II drives backward integration |
| Ingot/wafer capacity | ~2–5.3 GW | Lagging significantly |
| Polysilicon capacity | ~3.3 GW | Adani is the only integrated producer |
India’s module capacity now exceeds domestic demand, making it an export-oriented manufacturing base. However, the cell gap is similar to the US: 29–30 GW of cell capacity against 144–172 GW of module capacity means roughly 80% of cells are still imported.
A critical policy change took effect June 1, 2026: government-backed projects must use modules with cells listed under ALMM List-II. Modules assembled in India using Chinese cells no longer qualify. This is forcing urgent backward integration into cell manufacturing.
The PLI scheme had a disbursement problem: zero funds were disbursed until February 2026 because incentives only release after one year of post-commissioning production. Manufacturers built capacity on the promise of future payments, creating working capital strain.
Comparative Reshoring Scorecard
| Metric | United States | European Union | India |
|---|---|---|---|
| Module capacity (2026) | ~65 GW | ~4–12 GW | ~144–172 GW |
| Cell capacity (2026) | ~3.2 GW | ~2 GW | ~29–30 GW |
| Primary policy tool | IRA Section 45X | NZIA auction criteria | PLI scheme |
| Policy status | Phasing out (2026) | Implementing (2026–27) | Active; disbursement delayed |
| Cost premium vs. China | 23–74% | 30–50% | 10–20% |
| Key strength | Module assembly scale | Regulatory framework | Module export capacity |
| Key weakness | Upstream gaps | Minimal capacity | Cell gap; PLI delays |
India’s cost position is the most competitive outside China. Its module manufacturing costs are estimated at 10–20% above Chinese levels, versus 23–74% for the US and 30–50% for the EU. If India closes its cell gap, it could become the world’s second-largest solar manufacturing hub after China.
Cost Reality: US-Made versus Imported Modules
The cost gap between US-made and imported solar modules is the single most important economic fact shaping reshoring outcomes. Here is the complete cost stack for 2026.
Module Cost Comparison (Q1 2026)
| Module Category | Price per Watt | Premium vs. Import | Typical Use Case |
|---|---|---|---|
| Imported (no tariff exposure) | $0.265/W | Baseline | Non-US markets; some exempt shipments |
| US median market price | $0.28–0.285/W | +6–8% | Blended average across all US transactions |
| US-assembled, imported cells | $0.325–0.36/W | +23–36% | Most “US-made” modules; meets 40% domestic content |
| Fully domestic (US cells) | $0.42–0.46/W | +58–74% | Full domestic content bonus; limited supply |
Source: Anza Q1 2026 Quarterly Pricing & Domestic Content Report.
The Tariff Stack Effect
US module prices are not high because US manufacturing is inherently expensive. They are high because tariffs on imports create a protected price umbrella. The layered duty structure:
| Duty Layer | Rate | Applies To |
|---|---|---|
| Section 301 (Chinese cells/modules) | 50% | Chinese-origin product |
| AD/CVD — Cambodia | ~652% effective | Cambodian cells |
| AD/CVD — Thailand | ~375% effective | Thai cells |
| AD/CVD — Vietnam | ~396% effective | Vietnamese cells |
| AD/CVD — Malaysia | ~34% effective | Malaysian cells |
| Reciprocal duties | 10–49% | Various origins |
The combined effect eliminates Cambodia, Vietnam, and Thailand as economically viable origins for US-bound product. Malaysia and India remain partially viable at lower rates. Chinese product faces 50%+ Section 301 rates plus additional base tariffs.
Developer Decision: Real Numbers
Consider a 100 MW utility-scale project with $100 million in total capital cost:
| Scenario | Module Cost | Module Share of CAPEX | Domestic Content Bonus | Net Module Cost |
|---|---|---|---|---|
| Imported (theoretical, no tariffs) | $26.5 million | 26.5% | $0 | $26.5 million |
| US-assembled, imported cells | $34.3 million | 34.3% | $3.4 million (10% ITC) | $30.9 million |
| Fully domestic (US cells) | $44.0 million | 44.0% | $4.4 million (10% ITC) | $39.6 million |
The domestic content bonus closes roughly half the price gap for US-assembled modules. For fully domestic modules, the bonus is larger in absolute dollars but still leaves a significant premium. Most developers in 2026 choose US-assembled modules with imported cells as the optimal tradeoff between cost and incentive capture.
Pro Tip — Total Project Economics Matter More Than Module Cost
A $0.10/W module premium on a 100 MW project adds $10 million to CAPEX. But the 10% domestic content bonus on a $100 million project adds $3–4 million in tax equity. The net cost increase is $6–7 million, not $10 million. Factor in accelerated depreciation, PPA price escalation, and financing cost differences before making sourcing decisions. Use solar design software with integrated financial modeling to run scenario comparisons.
2027–2030 Outlook: Will the Supply Chain Complete?
The next four years will determine whether US solar manufacturing becomes a permanent industrial base or a temporary subsidy artifact. Three scenarios are plausible.
Scenario A: Policy Extension (30% probability)
Congress extends Section 45X credits for solar components beyond 2026, either through new legislation or through a technical correction. Cell and wafer investments accelerate. US cell capacity reaches 15–20 GW by 2030. Wafer capacity reaches 10–15 GW. The supply chain remains incomplete but meaningfully deepened.
What would need to happen: A post-2026 administration supports manufacturing subsidies, or the economic pain of losing 45X (factory closures, job losses) creates political pressure for extension.
Scenario B: Tariff Protection (50% probability)
45X expires as scheduled, but tariffs on imported cells and modules remain high or increase. US module assembly stays viable because import competition is priced out. Cell and wafer investment stalls because there is no subsidy to cover the capital cost gap. The US remains a module-assembly hub with imported cells indefinitely.
This is the most likely outcome based on current policy trajectories. The Section 232 polysilicon investigation, launched by Commerce Secretary Howard Lutnick in 2025, could add additional tariff layers. The FEOC rules effective January 2026 already block Chinese-linked companies from tax credits.
Scenario C: Partial Retrenchment (20% probability)
45X expires and tariffs are reduced or eliminated in a trade deal. US module assembly becomes uneconomic against imported competition. Smaller, less efficient factories close. Only First Solar (protected by technology differentiation) and Qcells (protected by vertical integration and DOE loan guarantees) survive at scale. US manufacturing capacity falls back toward 20–30 GW.
Capacity Projections by Scenario
| Segment | 2026 (Actual) | 2030 Scenario A | 2030 Scenario B | 2030 Scenario C |
|---|---|---|---|---|
| Module assembly | ~65 GW | ~80 GW | ~60 GW | ~30 GW |
| Solar cells | ~3.2 GW | ~18 GW | ~8 GW | ~5 GW |
| Wafers | ~5 GW | ~15 GW | ~8 GW | ~4 GW |
| Polysilicon | ~20,000 MT | ~50,000 MT | ~30,000 MT | ~20,000 MT |
The IEA’s View
The IEA’s Energy Technology Perspectives 2026 projects US wafer capacity at roughly 5 GW by 2030 — barely above current levels. Module capacity is projected to add another 30 GW by 2030. The IEA notes that the US and India are the only major economies offering explicit financial support for solar PV manufacturing, but both remain far from self-sufficiency.
A Developer’s Perspective
Maria Chen, VP of Procurement at a mid-size US IPP, described her 2026 sourcing strategy: “We model every project three ways — imported modules with no bonus, US-assembled with the 40% content threshold, and fully domestic if Qcells can deliver. The math almost always lands on US-assembled. The fully domestic premium is too high unless the client specifically requires it for ESG reporting. After 2026, if 45X goes away and module prices fall, we will re-evaluate. But the tariff wall is not coming down. That is the floor under US manufacturing.”
Conclusion
US solar manufacturing reshoring in 2026 is a story of partial success and persistent gaps. Module assembly capacity grew from 8 GW to 65 GW in four years — a genuine industrial achievement driven by IRA Section 45X credits. But the upstream supply chain — cells, wafers, ingots, polysilicon — remains largely foreign. The US assembles solar panels at scale. It does not yet make the components that matter most.
The three actions that matter for solar professionals in 2026:
-
Model domestic content scenarios in every proposal. The 10% bonus credit, 45X pass-throughs, and tariff exposure all affect project returns. Run the numbers for US-assembled and fully domestic modules before making sourcing commitments.
-
Watch the policy calendar. December 31, 2026 is the 45X cliff. July 4, 2026 is the construction-start deadline for preserving 48E and 45Y project credits. Projects starting after these dates face fundamentally different economics.
-
Diversify supplier relationships. The US solar manufacturing base is concentrated among a handful of players. First Solar and Qcells together account for roughly half of output. Meyer Burger failed. REC Silicon failed. NorSun halted. Build supplier redundancy into procurement strategy.
For the broader context on how trade policy shapes module costs, see our solar trade tariffs impact analysis. For the full supply chain picture including shipping, polysilicon markets, and global capacity, see solar supply chain trends 2026. For the global demand outlook, see global solar market forecast 2026.
For EPCs and developers modeling domestic content scenarios, solar software with built-in financial tools lets you compare US-made and imported module pricing with real-time tariff and incentive calculations.
Frequently Asked Questions
How much US solar manufacturing capacity exists in 2026?
US solar module assembly capacity reached approximately 65 GW by early 2026 according to SEIA. Solar cell capacity sits at only 3.2 GW, wafer capacity near 5 GW, and ingot capacity is minimal. This means roughly 95% of cells used in US-assembled modules are still imported. The gap between module assembly and upstream manufacturing is the defining feature of US solar reshoring in 2026.
What is IRA Section 45X and how does it support solar manufacturing?
Section 45X of the Inflation Reduction Act provides production tax credits for domestically manufactured clean energy components. For solar, it covers polysilicon ($3/kg), wafers ($12/m²), cells ($0.04/W), and modules ($0.07/W). The credit has driven over $3 billion in announced US manufacturing investments. However, the One Big Beautiful Bill Act accelerated the phase-out, with solar module credits ending after December 31, 2026.
Which companies are manufacturing solar panels in the US in 2026?
Major US solar manufacturers in 2026 include First Solar (thin-film, ~14 GW across Ohio, Alabama, Louisiana), Hanwha Qcells (8.4 GW combined in Georgia — Dalton and Cartersville), Silfab (Washington and South Carolina), Heliene (1.3 GW in Minnesota), Canadian Solar (2.1 GW HJT in Indiana), and Suniva (Georgia). First Solar and Qcells together account for roughly half of US module output.
Why is US solar cell manufacturing so far behind module assembly?
Solar cell manufacturing requires semiconductor-grade clean rooms, precision equipment, and highly skilled labor. A cell factory costs $200–400 million per GW versus $20–40 million for a module assembly line. The technology also evolves rapidly — TOPCon, HJT, and perovskite-tandem cells require different equipment than the PERC lines that dominated through 2023. US investors have prioritized lower-risk module assembly over capital-intensive cell fabrication.
How much more do US-made solar modules cost than imported ones?
US-assembled modules with imported cells cost $0.325–0.36/W according to Anza Q1 2026 data. Fully domestic modules with US-made cells cost $0.42–0.46/W. Imported modules without tariff exposure cost roughly $0.265/W. The domestic premium is 23–36% for assembled and 58–74% for fully domestic. The 10% IRA domestic content bonus credit closes much of this gap for qualifying projects.
What happened to REC Silicon and US polysilicon production?
REC Silicon shut down its Moses Lake, Washington polysilicon plant in January 2025 after failing qualification tests for its sole customer, Hanwha Qcells. The plant had restarted in late 2023 after a five-year idle but could not achieve solar-grade purity. REC Silicon laid off 224 workers and pivoted to silicon gases for the battery anode market. Hemlock Semiconductor in Michigan remains the only meaningful US polysilicon producer.
Is the EU reshoring solar manufacturing faster than the US?
No. The EU’s Net-Zero Industry Act targets 30 GW of domestic solar manufacturing by 2030, but current module capacity is only 4–12 GW. The EU has zero ingot and wafer capacity. SolarPower Europe estimates EU-made modules cost 2.2–5.8 €ct/Wp more than imports. The US has made more progress on module assembly but faces the same upstream gaps. Both regions remain heavily dependent on Chinese supply chains for cells, wafers, and polysilicon.
Will the US solar supply chain be self-sufficient by 2030?
No. Even under optimistic scenarios, US solar cell capacity would reach only 15–20 GW by 2030 against 65+ GW of module assembly and 40–50 GW of domestic demand. Wafer and ingot capacity would remain in single digits. The IEA projects US wafer capacity at roughly 5 GW by 2030. Full vertical integration from polysilicon to modules would require $15–20 billion in additional capital investment beyond what has already been announced.


