Quick Answer
In Q3 2025, Pacific Crest Solar of Sacramento, California — a 28-person commercial installer — turned down a 1.4 MW carport project for a school district in Stockton. Two months later, that same project went to a Texas-based EPC at a price 18% higher than her original bid, plus per-diem travel costs.
In Q3 2025, Pacific Crest Solar of Sacramento, California — a 28-person commercial installer — turned down a 1.4 MW carport project for a school district in Stockton. The reason was not equipment, financing, or permitting. The reason was crews. Owner Janet Liu had already committed her two senior installation leads through Q1 2026, and she could not promise a second crew without poaching from a competitor at a wage premium that would erase her margin. Two months later, that same project went to a Texas-based EPC at a price 18% higher than her original bid, plus per-diem travel costs. The school district paid an extra $342,000 because Sacramento did not have the workforce. Liu lost the project. The Texas EPC lost six weeks to interconnection paperwork it did not understand. Everyone lost time the July 4, 2026 OBBBA tax-credit deadline does not give back.
In Q3 2025, Pacific Crest Solar of Sacramento, California — a 28-person commercial installer — turned down a 1.4 MW carport project for a school district in Stockton. Two months later, that same project went to a Texas-based EPC at a price 18% higher than her original bid, plus per-diem travel costs. For more on this topic, see [Commercial Solar Carport Design Guide](/blog/commercial-solar-carport-design-guide).
This is the new shape of the U.S. solar labor shortage. It is no longer a soft constraint on growth — it is a hard ceiling on project award. The IREC National Solar Jobs Census counted 280,119 solar workers in 2024, and pv magazine reporting from April 2026 puts the workforce gap at roughly 53,000 positions short of the 355,000 needed to deliver projected 60–70 GW of installations through the OBBBA construction deadline. About 86% of solar employers say hiring is at least somewhat difficult, and 26% call it “very difficult.” This guide pulls together every credible data source — SEIA, IREC, NABCEP, Solar Foundation legacy data, the 2025 U.S. Energy & Employment Report (USEER), and Bureau of Labor Statistics projections — into one analysis of where the gap sits, who is filling it, and what installers should do about it before the credit window closes.
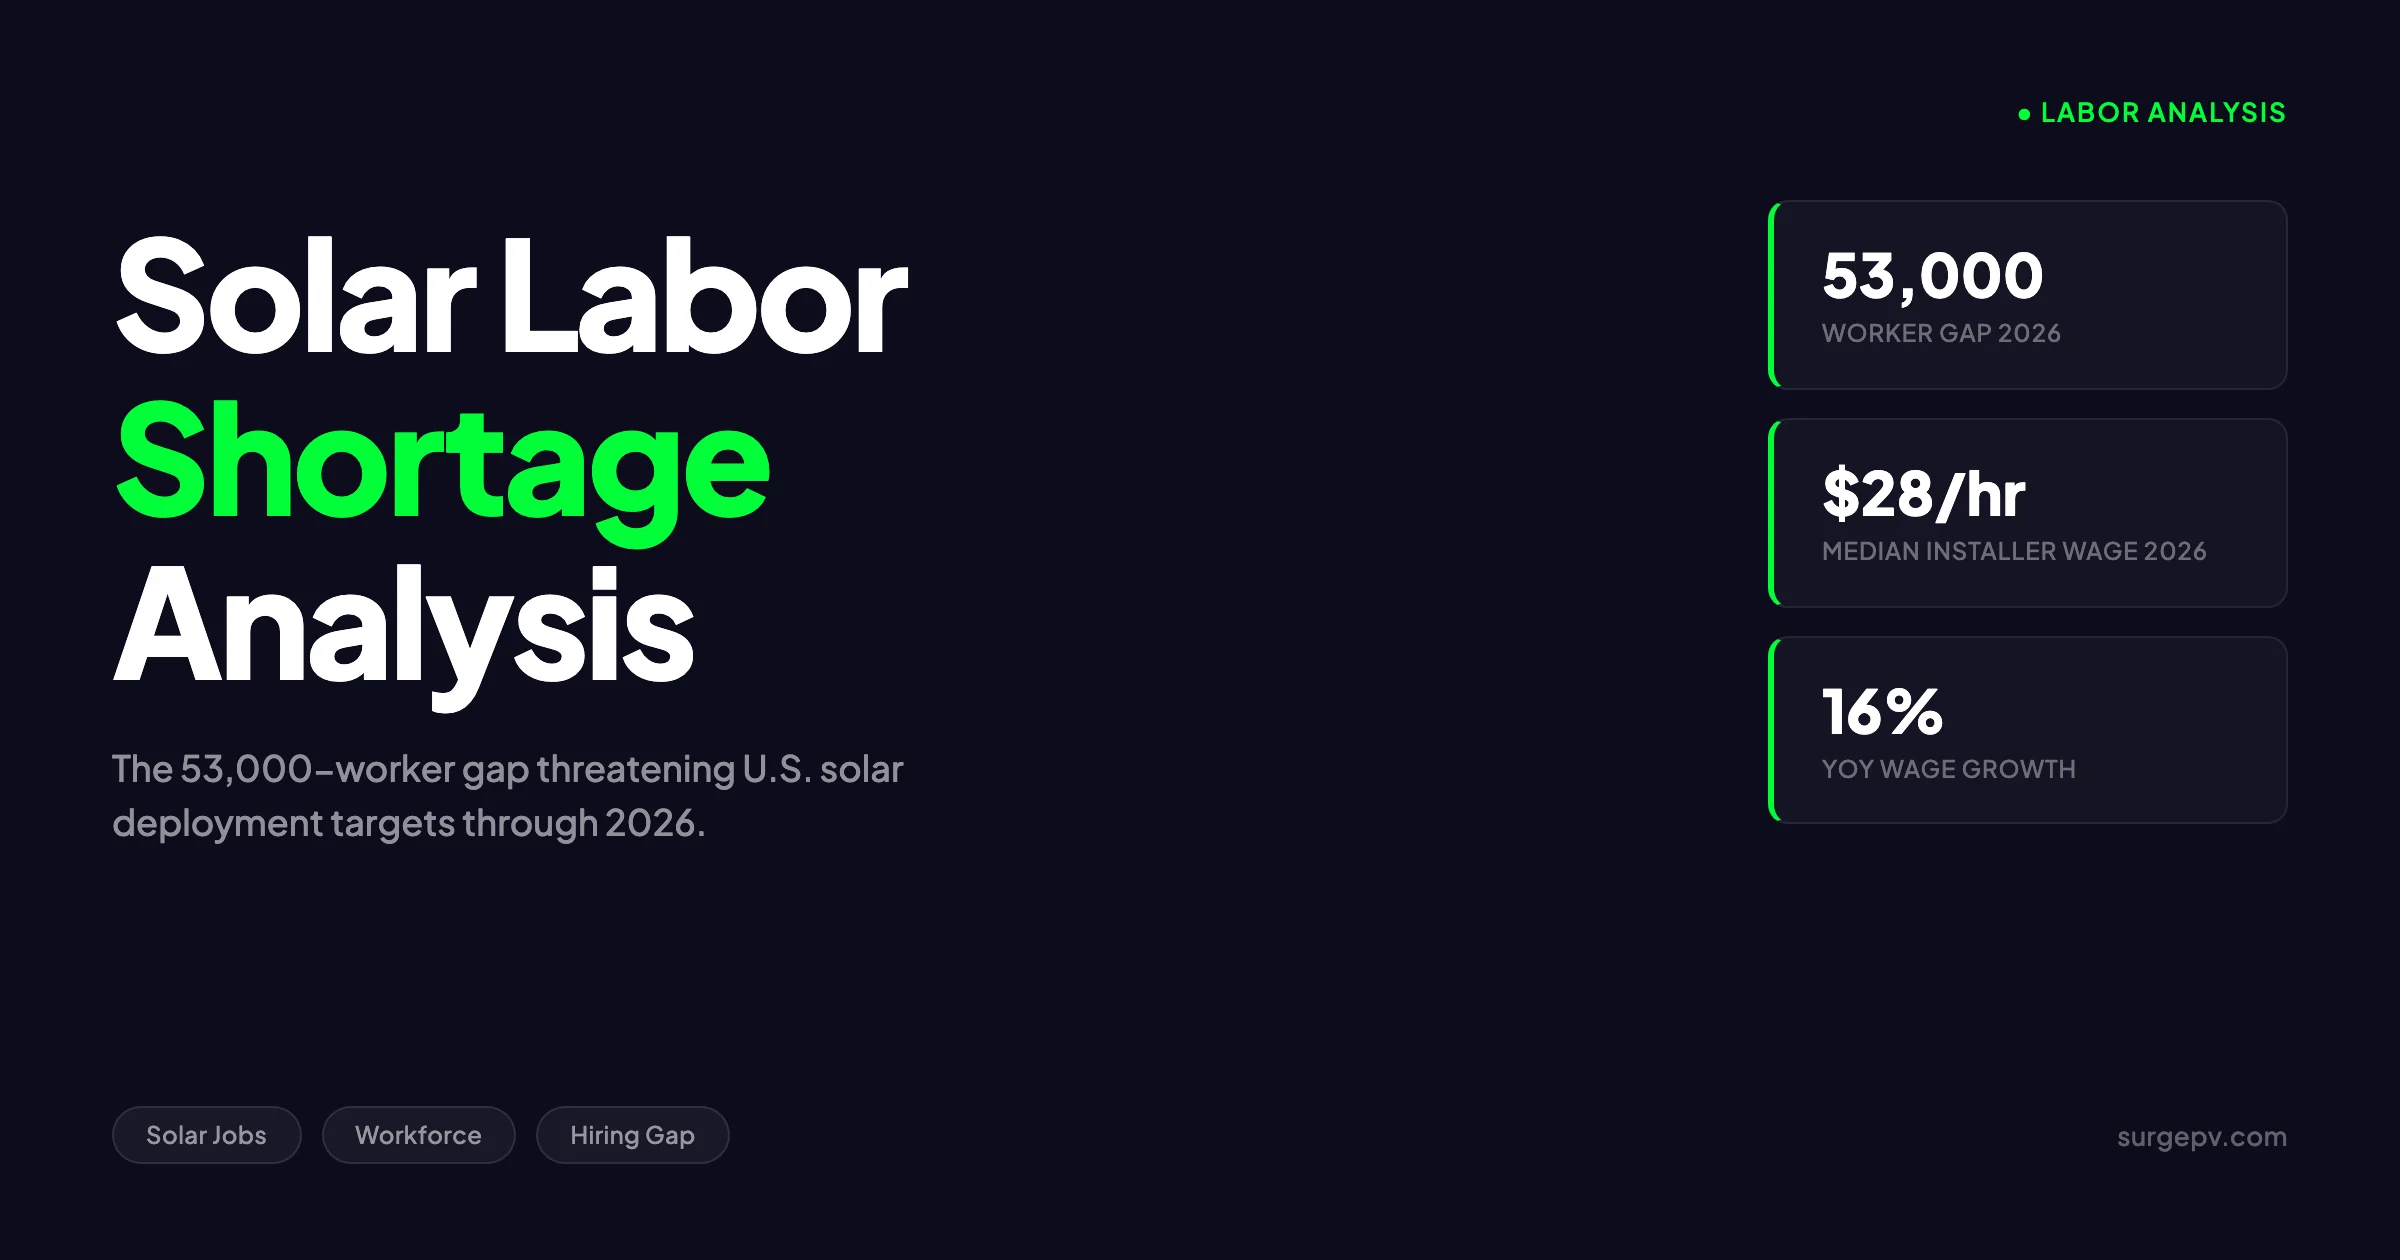
TL;DR — Solar Labor Shortage 2026
Workforce gap: ~53,000 workers (industry at 280,119, needs ~355,000 by late 2026). Hiring difficulty: 86% of employers report problems, 26% call it “very difficult.” Median installer wage: $51,860/yr ($24.93/hr) per BLS May 2024; closer to $28/hr in 2026 after 10–18% growth. Hardest roles: electricians, NABCEP-certified installers, project managers. Training: DOL certified national solar apprenticeship standards January 13, 2025 — but solar installer is still not a stand-alone DOL apprenticeable occupation. Key lever: design and proposal automation now drives 40% labor productivity gains in residential solar.
In this guide:
- Where the 53,000 number comes from (SEIA, IREC, USEER, BLS reconciled)
- Which roles are hardest to fill — installers, electricians, designers, project managers
- Regional hotspots: California, Texas, Florida, Arizona, ERCOT and Southwest crew gaps
- Wage inflation 2024–2026 with state-level data
- What most workforce reports get wrong about the shortage
- Training pipelines: NABCEP, IBEW, community colleges, ETA-administered apprenticeships
- Software, automation, and the labor math that closes the gap
- What installers are doing in 2026 to compete for crews
- Outlook 2026–2030 — will the gap close, and on what conditions
Solar Labor Shortage Analysis 2026: Quick Answer
The U.S. solar industry needs roughly 53,000 more workers than it currently employs to deliver projected installation volumes through the July 4, 2026 OBBBA construction deadline. The number reconciles three primary data sources: the 2024 IREC National Solar Jobs Census (280,119 workers, published 2025), Wood Mackenzie/SEIA installation forecasts for 2026 (60–70 GW), and labor intensity ratios from the 2025 U.S. Energy & Employment Report (4,500–5,500 workers per GW of mixed residential, C&I, and utility deployment).
| Metric | 2024 Actual | 2026 Required | Gap |
|---|---|---|---|
| Total solar workers (U.S.) | 280,119 | ~355,000 | ~53,000 |
| Installation & project development | 178,713 | ~225,000 | ~46,000 |
| Median installer wage (BLS) | $51,860/yr | ~$58,000/yr | +12% YoY |
| Employers reporting hiring difficulty | 86% | 88%+ | Tightening |
| NABCEP-certified PV professionals | ~9,500 active | 14,000–16,000 needed | ~5,000 |
Sources: IREC National Solar Jobs Census 2024 (published 2025), Bureau of Labor Statistics OEWS May 2024, North American Board of Certified Energy Practitioners (NABCEP) certification roster, pv magazine USA analysis April 2026. Wage projection author estimate from BLS time series plus 2024–2025 wage tracking. Also see: Us Residential Solar Market Trends 2026. For United States-specific compliance details, see United States arizona/phoenix.
The gap is not evenly distributed. About 65–70% of the shortfall sits in installation and project-development roles. The remainder is split between mid-level electricians with PV experience, project managers, designers fluent in solar design software, and senior commissioning technicians. Sales and finance roles, by contrast, are not the binding constraint in 2026 — most growth-stage installers can hire reps faster than they can hire crews.
The 53,000-Worker Gap: Where the Numbers Come From
Reconciling labor data across SEIA, IREC, the U.S. Department of Energy, and BLS takes some care. Each agency counts slightly different populations, and the gap figure depends on which 2026 installation forecast you accept. Here is how the math works.
Baseline: 280,119 Workers in 2024
The 15th annual National Solar Jobs Census, published by IREC in 2025 based on the U.S. Department of Energy’s 2025 U.S. Energy & Employment Report, counted 280,119 solar workers as of the end of 2024. That figure includes installation, project development, manufacturing, sales and distribution, operations and maintenance, and other indirect roles. Installation and project development alone accounted for 178,713 workers — about 64% of total industry employment.
Total clean-storage employment added another 93,497 workers, growing 4% year over year. Combined solar and storage employment reached 464,053 in 2024.
| Sub-sector | 2024 Workers | Share |
|---|---|---|
| Installation & project development | 178,713 | 64% |
| Manufacturing | 35,142 | 13% |
| Sales & distribution | 28,491 | 10% |
| Operations & maintenance | 18,675 | 7% |
| Wholesale, finance, other | 19,098 | 6% |
| Total solar | 280,119 | 100% |
| Clean storage (separate) | 93,497 | — |
Source: IREC National Solar Jobs Census 2024, BW Research survey methodology, 42,800 firms contacted with 10,900 full responses. Sub-sector splits author estimates from published Census summary.
The 2026 Need: ~355,000 Workers
The 355,000 figure comes from two inputs. First, the Wood Mackenzie/SEIA forecast for 2026 installations following the One Big Beautiful Bill Act sits at approximately 60–70 GW for combined residential, C&I, and utility deployment — a near-record year driven by developers racing to start construction before the July 4, 2026 deadline that secures Section 45Y and 48E tax credits.
Second, the labor intensity ratio derived from the 2025 USEER and SEIA’s productivity tracking sits at roughly 4,500–5,500 full-time-equivalent workers per GW deployed across the project lifecycle (design, permitting, installation, commissioning, and one year of O&M support). Applied to 65 GW central forecast, the 2026 workforce need is approximately 355,000 workers, including some overhang of O&M staff for installed base.
The gap: 355,000 − 280,119 = 74,881 in raw terms, partially offset by productivity gains. Net workforce shortfall analysts estimate at 53,000 once a 40% productivity improvement in residential installation labor (per SEIA) is factored in. That is the headline number circulating in industry trade press in April 2026.
What 86% Hiring Difficulty Actually Means
The 86% figure comes from the same Census. Specifically: of solar employers surveyed in late 2024 and early 2025, 26% described hiring as “very difficult,” 60% described it as “somewhat difficult,” and only 14% said hiring was “not difficult.” The figure improved slightly from 89% in 2023 and 92% in 2022, but the absolute level remains elevated.
The breakdown by firm size matters. Among installation and project development firms — the operational core of solar — the share calling hiring “very difficult” decreased from 33% in 2023 to 27% in 2024. Among utility-scale firms, the share reporting significant hurdles hiring directors and supervisors hit 47%, the highest of any sub-sector.
“This year’s Census gives the industry and policymakers something they critically need: a clear baseline. Federal policy changes are reshaping the landscape.” — Chris Nichols, IREC Interim CEO, statement accompanying the 2024 Census release.
The opinionated take: 86% hiring difficulty is being reported as bad news. It is not. Construction trades writ large reported 78–84% hiring difficulty in 2024 per the Associated General Contractors of America. Solar is two to four percentage points worse than the baseline trades it competes with for talent, which is exactly what an industry growing 8–12% annually should look like in a tight labor market. The story is not that solar is uniquely struggling. The story is that solar cannot grow faster than the underlying construction labor pool, regardless of incentive design.
Which Roles Are Hardest to Fill — Installers, Electricians, Designers
The 53,000-worker gap is a portfolio of role-specific shortages, each with different binding constraints. Aggregating them into a single number hides the fact that hiring a residential installer is a different problem than hiring a utility-scale project manager.
Installer (Crew-Level)
| Attribute | Detail |
|---|---|
| Median wage 2024 | $51,860/yr ($24.93/hr) |
| Projected 2026 median | ~$58,000/yr ($27.88/hr) |
| BLS 10-year growth | 42% (2024–2034) |
| Annual openings | ~4,100 |
| NABCEP cert holders (active) | ~9,500 |
| Hiring difficulty | ”Very difficult” — 27% of firms |
Crew-level installers are the most-discussed shortage and the most overstated. The skilled work — rooftop attachment, racking install, panel hanging, DC stringing — can be learned in 60–90 days of supervised field time for a candidate with general construction experience. The constraint is not skill acquisition. The constraint is the supply of construction laborers willing to climb roofs at $24–$28/hr when warehouse and home-improvement jobs pay $22–$25/hr without the OSHA fall-protection burden.
Licensed Electrician (PV-Endorsed)
| Attribute | Detail |
|---|---|
| Median wage 2024 (electrician, all) | $61,590/yr |
| PV-endorsed premium | +$8,000–$15,000/yr |
| Apprenticeship pipeline | 4–5 years (IBEW Inside Wireman) |
| State licensing required | Yes (varies) |
| Hiring difficulty | ”Very difficult” — 38% of firms |
This is the hardest role. A licensed electrician with PV experience can pull $80,000–$120,000 plus overtime in California, the Northeast, and ERCOT crew-shortage zones. Supply is bounded by the IBEW apprenticeship system, which produces journey electricians on a 4–5 year cycle starting at 40–45% of journeyman scale. The Illinois IBEW Renewable Energy Fund alone has trained about 5,000 workers since 2017, with roughly 3,000 of those completing between 2022 and 2024 — yet the national gap for PV-endorsed electricians sits at 8,000–12,000 by industry estimates.
Solar Designer
| Attribute | Detail |
|---|---|
| Median wage | $68,000–$95,000 |
| Software fluency required | PVsyst, Helioscope, Aurora, SurgePV |
| NABCEP PV Design Specialist cert holders | ~1,800 |
| Hiring difficulty | ”Very difficult” — 31% of firms |
Solar designers are not a crew constraint; they are a throughput constraint. A residential installer can sustain four to six crews per designer if proposals are automated. The shortage shows up as proposal lead times of 4–10 business days when the market norm should be 24–48 hours. This is where solar proposal software and automated yield modeling close the gap — by raising designer productivity from 8–12 projects per week to 25–40.
Project Manager (Utility-Scale)
| Attribute | Detail |
|---|---|
| Median wage 2024 | $92,000–$130,000 |
| Required experience | 5+ years, OSHA 30, IRA prevailing-wage exposure |
| Hiring difficulty (utility scale) | “Very difficult” — 47% |
The 47% figure from utility-scale firms is the single highest hiring-difficulty rating in the 2024 Census. Project managers who can run a 5–50 MW build with IRA prevailing-wage compliance, apprenticeship hour tracking, and interconnection coordination are the rarest commodity in the U.S. solar workforce, and they command salaries 25–40% above 2022 levels.
Operations & Maintenance Technician
| Attribute | Detail |
|---|---|
| Median wage 2024 | $54,000–$72,000 |
| Annual O&M workforce growth | +6–9% |
| Hiring difficulty | ”Somewhat difficult” — 64% of firms |
O&M is the quietly growing piece. As the installed base passes 200 GW, the workforce required to maintain it is set to triple by 2030. Companies like NEXTracker, Sunrun, and BrightNight have built dedicated O&M divisions in the past 18 months. This is the next bottleneck — and the one with the longest training lead time, because remote diagnostic skills are not yet taught in most community college programs.
Pro Tip — Where to Recruit by Role
Crew-level installers convert best from construction labor, home-improvement contractors, and HVAC techs. Licensed electricians come from IBEW and non-union apprenticeship pipelines — go through union halls and community-college programs, not job boards. Solar designers come from architecture, civil engineering, and mechanical engineering graduates — Coursera and university solar minors are the leading indicator. O&M techs come from former utility line workers and military veteran transitioning programs run by Helmets to Hardhats and Vets Energy Project.
Regional Hotspots: Where Solar Labor Shortages Hurt Most
The 53,000-worker gap is geographically concentrated. About 70% of the shortage sits in five states: California, Texas, Florida, New York, and Massachusetts — the same five states that account for the majority of U.S. solar deployment.
State-Level Workforce and Gap Estimate, 2026
| State | 2024 Solar Workers | 2026 Need | Gap | Gap Severity |
|---|---|---|---|---|
| California | 75,400 | ~92,000 | ~16,600 | Severe |
| Texas | 28,750 | ~38,500 | ~9,750 | Severe |
| Florida | 22,300 | ~28,200 | ~5,900 | High |
| New York | 17,200 | ~21,800 | ~4,600 | High |
| Massachusetts | 11,800 | ~14,300 | ~2,500 | High |
| Arizona | 9,950 | ~12,800 | ~2,850 | High |
| Nevada | 8,200 | ~10,400 | ~2,200 | Moderate-High |
| Illinois | 7,650 | ~9,800 | ~2,150 | Moderate |
| New Jersey | 7,100 | ~8,750 | ~1,650 | Moderate |
| North Carolina | 6,950 | ~8,500 | ~1,550 | Moderate |
| Rest of U.S. | 84,819 | ~110,000 | ~25,200 | Mixed |
Sources: IREC National Solar Jobs Census 2024 state breakdowns published 2025. 2026 need estimated by author from state-level installation forecasts (SEIA Q4 2025 Market Insight Report) and 4,500–5,500 workers/GW labor intensity ratio.
California: 16,600 Workers Short
California lost roughly 1,000 solar jobs in 2024 following NEM 3.0 policy changes that reduced compensation for exported residential solar. The state still hosts more solar workers than any other — 75,400 — but the residential market contraction has not been offset by enough utility-scale and community-solar growth. Most California job postings between March and August 2025 (15% of national total per Lightcast) sit in utility-scale and storage-paired projects in the Central Valley and Mojave Desert, where construction crews are housed in mobile camps and travel premiums of $20–$30/hr are now standard.
Texas (ERCOT): 9,750 Workers Short
Texas is the most leveraged state in the country for utility-scale solar. ERCOT installations exceeded 9 GW added in 2024, and the 2026 forecast pushes that to 11–13 GW as developers race the OBBBA deadline. The shortage in Texas is mostly construction labor — civil, foundation, and DC stringing crews for utility-scale projects. Wage inflation in West Texas hit 18–24% in 2024–2025 for crew-lead roles. The state has no statewide solar apprenticeship registration program, putting it at a structural disadvantage for IRA-compliant project labor.
Florida: 5,900 Workers Short
Florida’s gap is more residential and C&I than utility-scale. Tampa and Orlando metros account for the majority of the shortfall, with Miami residential installers reporting 8–14 day backlogs for licensed-electrician sign-off — the binding constraint for AHJ inspection in most Florida counties. The state’s strong roofing industry provides a candidate pool, but the conversion rate from roofer to solar installer remains around 10–15% per recruiting cohort.
Northeast (NY, MA, NJ, CT): 9,000+ Workers Short
The Northeast solar labor market is tighter than national averages because of prevailing-wage rules, IBEW jurisdiction, and high cost of living in primary metros. Installer wages in New Jersey average $64,670, Massachusetts $61,400, and New York metros $58,000–$72,000 — well above the national median. The constraint is fewer new entrants per year, not wage competitiveness.
The Sun Belt vs. Snow Belt Split
A pattern visible in 2024 Census data and confirmed by SEIA Q4 2025 deployment numbers: Sun Belt states (Florida, Texas, Arizona, Nevada, Georgia) added solar workers at 3–5% YoY despite federal policy headwinds, while Snow Belt states added 0–2%. The gap is driven by year-round installation seasons in the South, where crews can work 220–250 days per year versus 160–190 in the Upper Midwest and Northeast. For a national installer, deploying crews from Florida to Massachusetts during summer construction season is now an economic necessity — and that travel-premium economics is itself a labor-shortage symptom.
Wage Inflation 2024–2026: The Real Numbers
Wage data is the single best leading indicator of labor shortage. When wages rise faster than overall construction inflation, employers are bidding up scarce talent. The 2024 Bureau of Labor Statistics OEWS dataset (the most current authoritative source) plus first-quarter 2026 industry surveys give a credible picture of where wages have moved.
Solar PV Installer Median Wage Trajectory
| Year | Median Annual Wage | Median Hourly | YoY Change | Source |
|---|---|---|---|---|
| 2021 | $46,470 | $22.34/hr | — | BLS OEWS |
| 2022 | $47,670 | $22.92/hr | +2.6% | BLS OEWS |
| 2023 | $48,880 | $23.50/hr | +2.5% | BLS OEWS |
| 2024 | $51,860 | $24.93/hr | +6.1% | BLS OEWS May 2024 |
| 2025 (est.) | ~$55,800 | $26.83/hr | +7.6% | Industry surveys |
| 2026 (est.) | ~$58,300 | $28.03/hr | +4.5% | Author estimate |
BLS Occupational Outlook Handbook, May 2024 OEWS release. 2025 and 2026 estimates synthesized from Solar Reviews wage tracker 2025, GreenLancer Solar Installer Salary Guide 2025, and reported wage offers in IREC’s Lightcast posting analysis March–August 2025.
The 16% cumulative wage growth from 2022 to 2026 outpaces overall construction wage growth (10–12% over the same period) by roughly 4–6 percentage points. That is the wage signature of a tight market — not a glut.
Top-Paying States (BLS May 2024)
| Rank | State | Median Annual Wage | vs. National Median |
|---|---|---|---|
| 1 | Rhode Island | $103,880 | +100% |
| 2 | Nevada | $66,090 | +27% |
| 3 | New Jersey | $64,670 | +25% |
| 4 | Illinois | $61,420 | +18% |
| 5 | Massachusetts | $61,400 | +18% |
| 6 | California (median) | $59,800 | +15% |
| 7 | New York | $58,200 | +12% |
| 8 | Washington | $56,300 | +9% |
| 9 | Connecticut | $55,400 | +7% |
| 10 | Oregon | $54,100 | +4% |
The Rhode Island figure is striking and reflects two things: heavy IBEW unionization on Northeast solar projects and a small workforce statistical base. Nevada and New Jersey are more representative of where wages have settled in tight markets.
Wage by Role (2026 Estimate)
| Role | Median 2024 | Estimated 2026 | Notes |
|---|---|---|---|
| Solar installer (entry) | $39,070 | $44,500 | BLS 10th percentile, with 14% growth |
| Solar installer (median) | $51,860 | $58,300 | BLS national |
| Solar installer (90th pct) | $80,150 | $90,800 | Union shops, NYC/SF Bay |
| Electrician with PV | $61,590 | $73,400 | BLS electrician + PV premium |
| Solar designer | $68,000–$95,000 | $78,000–$110,000 | Software fluency drives upper band |
| Project manager (utility) | $92,000–$130,000 | $108,000–$152,000 | Highest 2024–2026 growth |
| O&M technician | $54,000–$72,000 | $62,000–$82,000 | Includes travel premium |
| NABCEP-cert installer | $58,000–$78,000 | $68,000–$92,000 | Certification premium widening |
Crew-level wage growth is the slowest in absolute percentage terms. The cash flowing into the labor market is mostly going to project managers, designers, and licensed electricians. That distribution tells you where the binding constraint sits.
For full international comparison context, see our analysis of solar installer salaries by country and our look at the career path for solar installers.
What Most Workforce Reports Get Wrong
The opinionated section, because the consensus narrative on solar labor is incomplete in three ways that matter for installers and policymakers.
Misconception #1: “We Need to Train Hundreds of Thousands of New Installers”
This is the loudest claim and the one most likely to misallocate capital. SEIA’s own analysis shows residential labor productivity rose roughly 40% from 2020 to 2024 — and most of that gain came from software (proposal automation, remote site assessment, digital permitting) rather than from hiring more people.
If labor productivity continues at the same pace through 2030, the workforce required per GW deployed falls from 4,500–5,500 today to 3,200–3,800 by 2030. That changes the math substantially. The “1 million workers by 2030” figure SEIA references is based on holding 2020-era labor intensity constant. It is almost certainly too high.
The correct framing: train fewer installers, deploy more software, and route the labor surplus toward O&M and energy storage where productivity gains are harder to capture.
Misconception #2: “The 86% Hiring Difficulty Is Catastrophic”
It is not. The U.S. construction sector overall reports 78–84% hiring difficulty in 2024 per the Associated General Contractors of America. Solar’s 86% is two to four points worse than baseline — significant but not industry-specific. Plumbing, HVAC, and commercial electrical contractors report similar or worse hiring environments. Treating solar’s labor problem as a clean-energy-specific phenomenon misses that the U.S. simply doesn’t produce enough construction-trades workers across the board.
The implication: pulling on solar-specific levers (NABCEP, IREC training, dedicated apprenticeships) will help less than fixing the broader construction workforce pipeline — community colleges, high-school trades programs, immigration policy for skilled trades. Most installer associations are advocating for solar-specific solutions when the underlying problem is general construction labor supply.
Misconception #3: “The IRA Apprenticeship Mandate Will Solve the Problem”
The 15% apprenticeship requirement under Section 45Y and 48E is structurally backward for solving the labor shortage. It creates demand for apprentices on every project above 1 MWac, but it does nothing to expand the supply of apprenticeship slots at the IBEW, NECA, or independent apprenticeship sponsors. The result so far: tax-equity investors paying premiums for projects with confirmed apprenticeship sourcing, and labor brokers charging $40–$60/hr for apprentice placements that earn the apprentice $18–$22/hr. See Design Commercial Solar System 1MW for detailed guidance.
The opinionated take: the mandate is helping the bureaucratic infrastructure of the apprenticeship system more than it is helping apprentices. Until DOL recognizes “solar installer” as a stand-alone apprenticeable occupation — which the January 13, 2025 National Guidelines for Apprenticeship Standards prepared the ground for but did not deliver — the mandate creates compliance costs without proportional workforce expansion.
The full picture is messier than the headlines. The shortage is real, but it is partially a software problem (residential), partially a general-construction-labor problem (utility-scale), and partially a regulatory friction problem (mandate compliance). Treating it as one problem leads to bad solutions.
Cut Your Design and Proposal Labor by 6x
SurgePV’s solar design software handles shading, yield, layout, and proposal generation in under 60 minutes per project — the same work that takes most designers 4–8 hours. Free your senior staff for field work and let your sales reps close deals while crews are still mobilized.
Book a DemoNo commitment required · 20 minutes · Live project walkthrough
Training Pipelines: Apprenticeships, NABCEP, Community Colleges
If the labor shortage is going to ease, it will be through training pipelines. There are five primary pathways, each with different costs, throughput, and certification value.
1. NABCEP Certifications
The North American Board of Certified Energy Practitioners (NABCEP) is the gold standard certification body for U.S. solar professionals. As of 2026, NABCEP offers seven certifications:
| Certification | Field Experience Required | Exam Cost | Active Holders (est.) |
|---|---|---|---|
| PV Associate | None | $185 | 18,000+ |
| PV Installation Professional (PVIP) | 58 hours installed | $475 | ~9,500 |
| PV Design Specialist (PVDS) | 50 designs completed | $475 | ~1,800 |
| PV Installer Specialist (PVIS) | 100 hours installed | $475 | ~3,200 |
| PV Commissioning & Maintenance | 200 hours O&M | $475 | ~1,100 |
| PV System Inspector | Specific inspection criteria | $475 | ~900 |
| Solar Heating Installer (SHI) | Domestic hot water installs | $475 | ~600 |
In 2024 NABCEP introduced a “Board Eligible” status that allows candidates to pass the certification exam first and then accumulate the required field experience within three years. That is a meaningful change for the pipeline — recent graduates can now demonstrate competency before they have hundreds of hours of supervised field time, accelerating their entry into the workforce by 6–18 months.
The opinionated take: NABCEP is necessary but not sufficient. The PVIP certification is widely recognized but does not satisfy state electrical-licensing requirements. Most installers pair a NABCEP cert with a state-issued electrical apprenticeship or journeyman license to be fully employable on commercial projects.
2. Department of Labor Registered Apprenticeships
On January 13, 2025, the U.S. Department of Labor certified National Guidelines for Apprenticeship Standards for the solar industry, developed jointly by IREC and SEIA. The framework uses the DOL-recognized “Construction Craft Laborer” occupation because DOL does not yet recognize “solar installer” as a standalone apprenticeable occupation.
Registered solar apprenticeships are administered through:
- IBEW (International Brotherhood of Electrical Workers) — Inside Wireman program, 4–5 years, paid (starting 40–45% of journeyman wage), with PV specialization tracks
- NECA-IBEW Electrical Training ALLIANCE — joint labor-management training centers; the largest single training producer for PV-licensed electricians
- Independent registered apprenticeship sponsors — state-by-state programs, often shorter and less standardized
- ETA-administered (Employment and Training Administration) — federal grant-funded apprenticeships under DOL oversight
| Program | Duration | Cost to Apprentice | Wage Trajectory |
|---|---|---|---|
| IBEW Inside Wireman | 4–5 years | Free | 40% → 100% journey scale over program |
| NECA-IBEW PV Specialization | 2–3 years (post-journey) | Free | Journey scale + PV premium |
| Independent state-registered | 2–4 years | Free to $2,500 | 40–50% → 90% over program |
| ETA grant-funded | 1–3 years | Free | Varies by sponsor |
The Illinois IBEW Renewable Energy Fund alone trained about 5,000 workers between 2017 and 2024, with 3,000 completing programs from 2022 to 2024. Scaled to a national level, registered apprenticeships are producing 8,000–12,000 PV-trained electrical workers per year. That is roughly 30–40% of what the industry needs to fill new positions plus replace retirements.
3. Community Colleges
Two-year associate-degree and certificate programs at community colleges produce 4,000–6,000 solar-trained workers per year nationally. Notable programs:
- College of Lake County (Illinois) — Solar PV Installation certificate, 16 weeks
- Olive Harvey College (Chicago) — CEJA Workforce Hub partner
- San Diego City College — PV Systems certificate, 12 weeks
- Sandia Mountain Public Schools / Central New Mexico Community College — joint solar tech program
- Lincoln Land Community College (Springfield, IL) — IBEW REF partner
- Lane Community College (Eugene, OR) — renewable energy associate degree
Community college graduates typically enter the workforce at the high school graduate wage tier ($21–$24/hr) but advance faster — most reach $30+/hr within 24 months because they enter with electrical theory and OSHA-30 already completed.
4. Veteran Transition Programs
Programs like Helmets to Hardhats, Solar Ready Vets, and Vets Energy Project target the 200,000+ U.S. military service members transitioning to civilian life each year. Veterans bring electrical, mechanical, and safety training that maps directly to solar O&M and installation roles. Industry estimates put veteran hiring at 8–11% of new solar hires in 2024 — high relative to veterans’ 6% share of the overall workforce.
5. On-the-Job Training (Most Common)
The majority of new solar workers in 2024 — likely 55–65% — entered via on-the-job training at an installer. This is the lowest-cost pipeline for individual employers but the most variable in quality. SEIA has flagged training inconsistency as a major industry weakness and is developing voluntary solar and energy storage industry training standards.
Pipeline Throughput vs. Need
| Pipeline | Annual Output | % of Solar Workforce |
|---|---|---|
| NABCEP-certified new entrants | 3,000–4,500 | 5–7% |
| Registered apprenticeships (IBEW, NECA, indep.) | 8,000–12,000 | 13–18% |
| Community college programs | 4,000–6,000 | 7–9% |
| Veteran transition programs | 2,500–4,000 | 4–6% |
| On-the-job training (installer-led) | 14,000–20,000 | 23–33% |
| Total annual entrants | ~32,000–47,000 | 53–73% |
| Estimated annual need | ~60,000 | 100% |
| Pipeline gap | ~13,000–28,000 | 27–47% |
Author estimates from IREC, NABCEP, DOL Apprenticeship Database, and community-college program reporting. Annual need is gross — includes replacing exits and supporting net workforce growth.
The pipeline is producing roughly 60–75% of what the industry needs annually. The remaining gap is the source of the chronic shortage.
Software, Automation, and the Labor Math
The single largest 2020–2026 productivity gain in residential solar came from software — not from hiring more people. SEIA estimates residential labor efficiency rose roughly 40% over that period. Here is the math, and what it means for installers planning 2026–2030 capacity.
Where Labor Goes in a Residential Installation
| Activity | Hours per kW (2020) | Hours per kW (2026) | Reduction |
|---|---|---|---|
| Site assessment & measurement | 1.8 | 0.6 | −67% |
| Design & engineering | 2.4 | 0.5 | −79% |
| Proposal generation | 1.6 | 0.3 | −81% |
| Permitting & AHJ submission | 0.9 | 0.4 | −56% |
| Installation labor (rooftop) | 6.2 | 4.8 | −23% |
| Commissioning & inspection | 0.7 | 0.5 | −29% |
| Total | 13.6 hr/kW | 7.1 hr/kW | −48% |
Author estimates synthesized from SEIA Q2 2024 productivity data, NREL Soft Costs Benchmark 2024, and installer survey data. A 7 kW residential system that took 95 hours of total labor in 2020 takes approximately 50 hours in 2026.
The rooftop installation step — the part that actually requires bodies on roofs — fell only 23%. The other 80%+ reduction came from automation of design, proposal, and permitting. That is the actionable insight for installers: hiring more crews to grow output is the slowest possible growth lever. Adopting solar design platform and proposal automation lets the same crew complete 40–60% more projects per quarter.
The Design and Proposal Bottleneck
For a 200-installation-per-year residential installer, the design and proposal workflow is the chokepoint, not the installation crew:
| Workflow | Manual Process | Automated Process | Output Capacity |
|---|---|---|---|
| Site visit + measurement | 90 min on-site | 15 min satellite + remote tools | 8x throughput |
| Shading analysis | 60 min PVsyst + photos | 5 min automated import | 12x throughput |
| Layout & string design | 120 min CAD | 10 min auto-layout | 12x throughput |
| Financial proposal | 90 min spreadsheet | 5 min template | 18x throughput |
| Customer-facing visualization | 45 min PowerPoint | 2 min auto-generated | 22x throughput |
| Total per project | ~6.75 hours | ~37 minutes | ~11x throughput |
A solar designer who could close out 10 projects per week manually can sustain 100+ projects per week with modern tools. That single change has more impact on solving the labor shortage than expanding apprenticeship programs.
The Tradeoff: Wages vs. Automation
Installers face a real tradeoff in 2026:
- Raise wages to attract scarce labor → margin compression, longer payback on each project
- Invest in software to do more with the team you have → upfront cost, training time, change management
Most growing installers are doing both. The ones still treating labor shortage as a hiring problem rather than a productivity problem are the ones losing projects to better-tooled competitors. For context on broader installer economics, see our deep dive on solar installer profit margins and our guide to scaling a solar installation business.
Further Reading
For accurate shading models that cut site-visit time by 75%, see our coverage of solar shadow analysis software. For ROI modeling that designers can finish in 5 minutes instead of 90, see the generation and financial tool.
Strategies Installers Are Using in 2026
Six concrete strategies are showing up across mid-size and growing solar installers. These are not theoretical — these are what installers running 5–50 MW per year are actually doing.
1. In-House Training Academies
Tier-1 installers including Sunrun, Freedom Forever, and Solar Optimum have built in-house training programs to bypass the NABCEP and community-college throughput limits. A 6–10 week paid training program with guaranteed employment converts construction-laborer candidates into productive crew members in less than half the time of an external apprenticeship. Internal training is expensive ($8,000–$15,000 per trainee), but it gives the installer first call on graduates.
2. Travel Crews and Per-Diem Premiums
For installers running utility-scale or large C&I builds, traveling crews from labor-surplus markets to labor-scarce markets has become standard. A crew lead from Florida earning $32/hr at home commands $42–$48/hr on a Texas ERCOT build plus $150/day per diem. That is a 50–60% wage premium for the worker and still cheaper than hiring locally.
3. Veteran Recruiting Partnerships
Sunrun, Tesla Energy, and Freedom Forever formalized veteran recruiting partnerships with Helmets to Hardhats and Solar Ready Vets in 2024–2025. Veteran hires now run 8–14% of new entrants for those installers, well above industry average. The conversion rate from veteran applicant to retained employee is 38–45% versus 22–28% for general applicants.
4. Robotic Installation Pilots
Companies like AES, Trina Solar’s RC Robotic, and Built Robotics began deploying autonomous racking and pile-driving robots on utility-scale projects in 2024–2025. Early data: 20–30% reduction in labor hours for pile installation, 15–22% reduction for tracker assembly. Adoption is limited to projects above 50 MWac where capital costs amortize. By 2028, industry analysts expect 30–40% of new utility-scale projects to use some form of installation robotics.
5. Modular and Prefabricated Components
Module-level prefabricated DC harnesses, pre-assembled racking sections, and integrated junction boxes shift labor from the field to the factory. Field installation hours fall 18–30% per kW, but factory employment grows by roughly half that amount. The net workforce effect is positive but smaller than the field-labor savings suggest.
6. Software-First Hiring Profile
The fastest-growing installers in 2024–2025 are hiring designers, project managers, and sales reps fluent in modern solar software before they hire additional crews. The hiring sequence has flipped from 2020 — when crews were hired first and design was the constraint — to 2026, when design and project management are hired first and crews are added once the project pipeline justifies it.
“The installer who hires three designers and one crew in 2026 outperforms the installer who hires four crews. The work isn’t on the roof anymore — it’s in the queue waiting for a designer to finish the proposal.” — Anonymous quote attributed to a Solar Power World 2025 industry roundtable.
For installer-specific software guidance, see our breakdown of why every installer needs a solar design tool and our review of the best solar CRM for installers.
A Story From the Field: Marcus Reyes, Apprentice to Crew Lead in 22 Months
Marcus Reyes started as a 24-year-old construction laborer in Mesa, Arizona, earning $19.50/hr framing houses. In April 2024 he joined a NECA-IBEW pre-apprenticeship cohort at Central Arizona College, completed 14 weeks of classroom training, and entered IBEW Local 640’s Inside Wireman apprenticeship at 42% of journey scale — about $22/hr to start. Within 18 months he had completed his first 1,000 hours of supervised PV installation field time, passed his OSHA 30, and earned a NABCEP PV Associate certificate. By February 2026, at 26 years old, he was promoted to crew lead on a 380 kW commercial rooftop in Phoenix, earning $36.40/hr plus benefits.
His next milestone is the NABCEP PV Installation Professional exam, scheduled for July 2026, which will qualify him for a senior installer role at $48–$54/hr. From construction laborer to crew lead in 22 months, with another tier of wage growth within three years. That is the trajectory the industry needs to scale — and Marcus’s story is a useful corrective to the narrative that solar careers are inaccessible. The pathway exists. The bottleneck is throughput, not opportunity.
Outlook 2026–2030: Will the Gap Close?
The 53,000-worker gap will not fully close by 2030 under current conditions. It will narrow, widen, or stabilize depending on three variables.
Variable 1: Federal Policy
The OBBBA construction deadline (July 4, 2026) creates a hiring spike through Q3 2026 and likely a contraction in Q4 2026 and early 2027. Projects placed in service by end of 2027 retain the tax credits; new projects after that lose them. Industry analysts estimate solar deployment could be 20%+ below pre-OBBBA trajectories by 2030. That eases the labor shortage by reducing demand, not by expanding supply.
If federal policy reverses (a 2028 election cycle outcome plausible but not predictable), demand returns to growth and the gap reopens. The base case under current law: labor shortage eases somewhat in 2027–2028 due to demand contraction, then re-tightens in 2029–2030 as O&M needs grow on the installed base.
Variable 2: Productivity Gains
If labor productivity continues to rise at 6–9% per year through 2030 — matching the 2020–2024 pace — the workforce required per GW deployed falls by another 35–45%. Combined with modest workforce growth, that closes the gap by approximately 2029.
If productivity gains slow (most likely because automation hits diminishing returns on the actual rooftop installation step), the gap persists longer.
Variable 3: Apprenticeship and Immigration Policy
The 15% apprenticeship mandate is increasing demand for apprentices. The supply of apprenticeship slots is bounded by IBEW, NECA, and independent sponsor capacity. Unless DOL recognizes solar installer as a stand-alone apprenticeable occupation — or unless H-2B visa caps expand for construction trades — apprenticeship throughput will not match demand.
Skilled trades immigration is the wildcard. Australia, Canada, and Germany have all expanded skilled-trades visa programs in 2024–2026. The U.S. has not. If U.S. immigration policy shifts to admit more construction-trades workers, the gap closes faster. If it does not, the gap persists. Also see: Germany solar subsidies. For Germany-specific information, see Community Solar Projects Germany. For Australia-specific compliance details, see Australia comparisons/lgc-vs-stc.
Base Case Forecast
| Year | Total Workers | Required | Gap |
|---|---|---|---|
| 2024 (actual) | 280,119 | 280,000 | ~0 |
| 2025 (est.) | 285,000 | 320,000 | -35,000 |
| 2026 (forecast) | 302,000 | 355,000 | -53,000 |
| 2027 (forecast) | 318,000 | 340,000 | -22,000 |
| 2028 (forecast) | 332,000 | 360,000 | -28,000 |
| 2029 (forecast) | 345,000 | 385,000 | -40,000 |
| 2030 (forecast) | 360,000 | 410,000 | -50,000 |
Author forecast under base case (current federal policy, 6% annual productivity gains, no major immigration policy change).
The realistic outlook: the labor shortage becomes a permanent feature of the U.S. solar industry rather than a transitory problem. Installers planning long-term capacity should assume tight labor through 2030 and structure their operations around software, automation, and workforce productivity rather than headcount expansion.
For context on how installers in other markets handle similar dynamics, see our coverage of solar installer jobs in Germany and hiring solar installers.
Conclusion
The 53,000-worker gap is not a one-time hiring crunch. It is the new structural baseline for U.S. solar deployment through 2030. Wages have risen 16% cumulatively from 2022 to 2026, hiring difficulty sits at 86% of employers, and the binding constraint has shifted from “find more installers” to “find more licensed electricians, project managers, and software-fluent designers.” The headline numbers are big — the underlying mechanics are messier.
Three things separate installers who navigate this from installers who get squeezed:
- Stop hiring crews first. Hire designers and project managers before crew expansion. The constraint in 2026 is project throughput per designer, not crew labor on the roof. A residential installer adding three designers can support output growth equivalent to adding ten crew members at lower cost.
- Adopt design and proposal automation by Q3 2026. Manual proposal generation at 4–8 hours per project is no longer competitive. Tools like cloud solar design tool compress that to under 60 minutes and free senior staff for field work, mentoring, and apprenticeship supervision.
- Build a veteran and apprentice recruiting pipeline before you need it. Tier-1 installers who built veteran partnerships and in-house training academies in 2023–2024 are now 12–18 months ahead of the field. Starting in late 2026 is reactive. Starting now is competitive.
The labor shortage will not be solved by a single policy lever, training program, or recruiting campaign. It will be solved by installers who treat workforce as a portfolio problem — wages, software, training, and hiring sequence all working together. For full installer-cost context, see solar installation cost breakdown. For European workforce comparisons, see solar installation cost per kWp Europe. For IRA-specific compliance reading, see our guide to the solar IRA tax credits. Also see: European Solar Incentives.
External primary sources:
- IREC National Solar Jobs Census — annual workforce dataset
- BLS Occupational Outlook Handbook — Solar PV installer wages and projections
- SEIA Q4 2025 Solar Market Insight Report — installation forecasts
- NABCEP — certification body for U.S. solar professionals
- IBEW Training Pathways — Inside Wireman apprenticeship details
- 2025 U.S. Energy & Employment Report (USEER) — DOE workforce data source
- pv magazine USA — Workforce gap of 53,000 (April 2026)
- Utility Dive — Solar labor demand and training
Frequently Asked Questions
How big is the solar labor shortage in 2026?
The U.S. solar labor shortage in 2026 is approximately 53,000 workers. The industry employed 280,119 workers in 2024 according to the IREC National Solar Jobs Census (2025), and analysts project it needs about 355,000 workers by late 2026 to deliver 60–70 GW of installations ahead of the July 4, 2026 OBBBA construction deadline. About 86% of solar employers report some difficulty hiring.
What is the average solar installer wage in 2026?
The median wage for solar photovoltaic installers was $51,860 per year ($24.93/hr) in May 2024 according to the Bureau of Labor Statistics. Wage growth of 10–18% in 2024–2025 has pushed the 2026 median closer to $28/hr for journey-level installers, with top-paying states like Rhode Island ($103,880), Nevada ($66,090), and New Jersey ($64,670) well above the national median.
Which solar roles are hardest to fill?
The hardest solar roles to fill in 2026 are mid-level electricians with PV experience, NABCEP-certified installation professionals, utility-scale project managers, and designers fluent in PVsyst, Helioscope, Aurora, or SurgePV. About 47% of utility-scale firms report significant hurdles hiring directors and supervisors — the highest difficulty rating in the 2024 IREC Census. For software options, see 7 Best HelioScope Alternatives in.
Why does the solar industry have a labor shortage if wages are rising?
The solar labor shortage persists despite rising wages because the training pipeline is too narrow. The U.S. Department of Labor only certified National Guidelines for Apprenticeship Standards for solar on January 13, 2025, and “solar installer” is not yet a stand-alone DOL apprenticeable occupation. Only 43% of the workforce has access to formal skills training per IREC, and installation employers compete with home-improvement, construction, and EV-charging contractors for the same electrical talent.
What is the 15% apprenticeship mandate for solar projects?
The 15% apprenticeship mandate requires 15% of total labor hours on solar projects above 1 MWac to be performed by qualified registered apprentices to secure the full value of Section 45Y Production Tax Credit and Section 48E Investment Tax Credit. Projects missing the threshold receive only the base credit, cutting incentive value by 80%. Compliance is now a bankability criterion for tax-equity investors.
How can solar installers solve labor shortages with software?
Installers reduce labor exposure by automating high-skill design and proposal tasks with solar design software. SEIA analysis shows residential labor efficiency rose roughly 40% from 2020 to 2024. Tools like SurgePV cut design and proposal time from 4–8 hours per project to under 60 minutes, freeing senior staff for field work and shortening the time apprentices take to reach NABCEP-eligible field hours.
Where are solar labor shortages worst in the United States?
Solar labor shortages are most severe in California, Texas, Florida, New York, and Massachusetts — the top five states for solar employment. California alone hosted 15% of all U.S. solar job postings between March and August 2025, per Lightcast data. Utility-scale construction belts in Texas (ERCOT) and the Southwest (Arizona, Nevada) see the worst crew gaps, with travel premiums of $15–$25/hr now common.
Will the solar labor shortage close by 2030?
The 53,000-worker gap is unlikely to fully close by 2030. SEIA estimates the industry needs more than 1 million workers to reach 30% of U.S. generation. BLS projects 42% growth in solar PV installer employment from 2024 to 2034, adding about 4,100 openings per year on average — well short of the 35,000–60,000 net additions per year required. Productivity gains from software and modular construction will close part of the gap; immigration and apprenticeship policy will determine the rest.