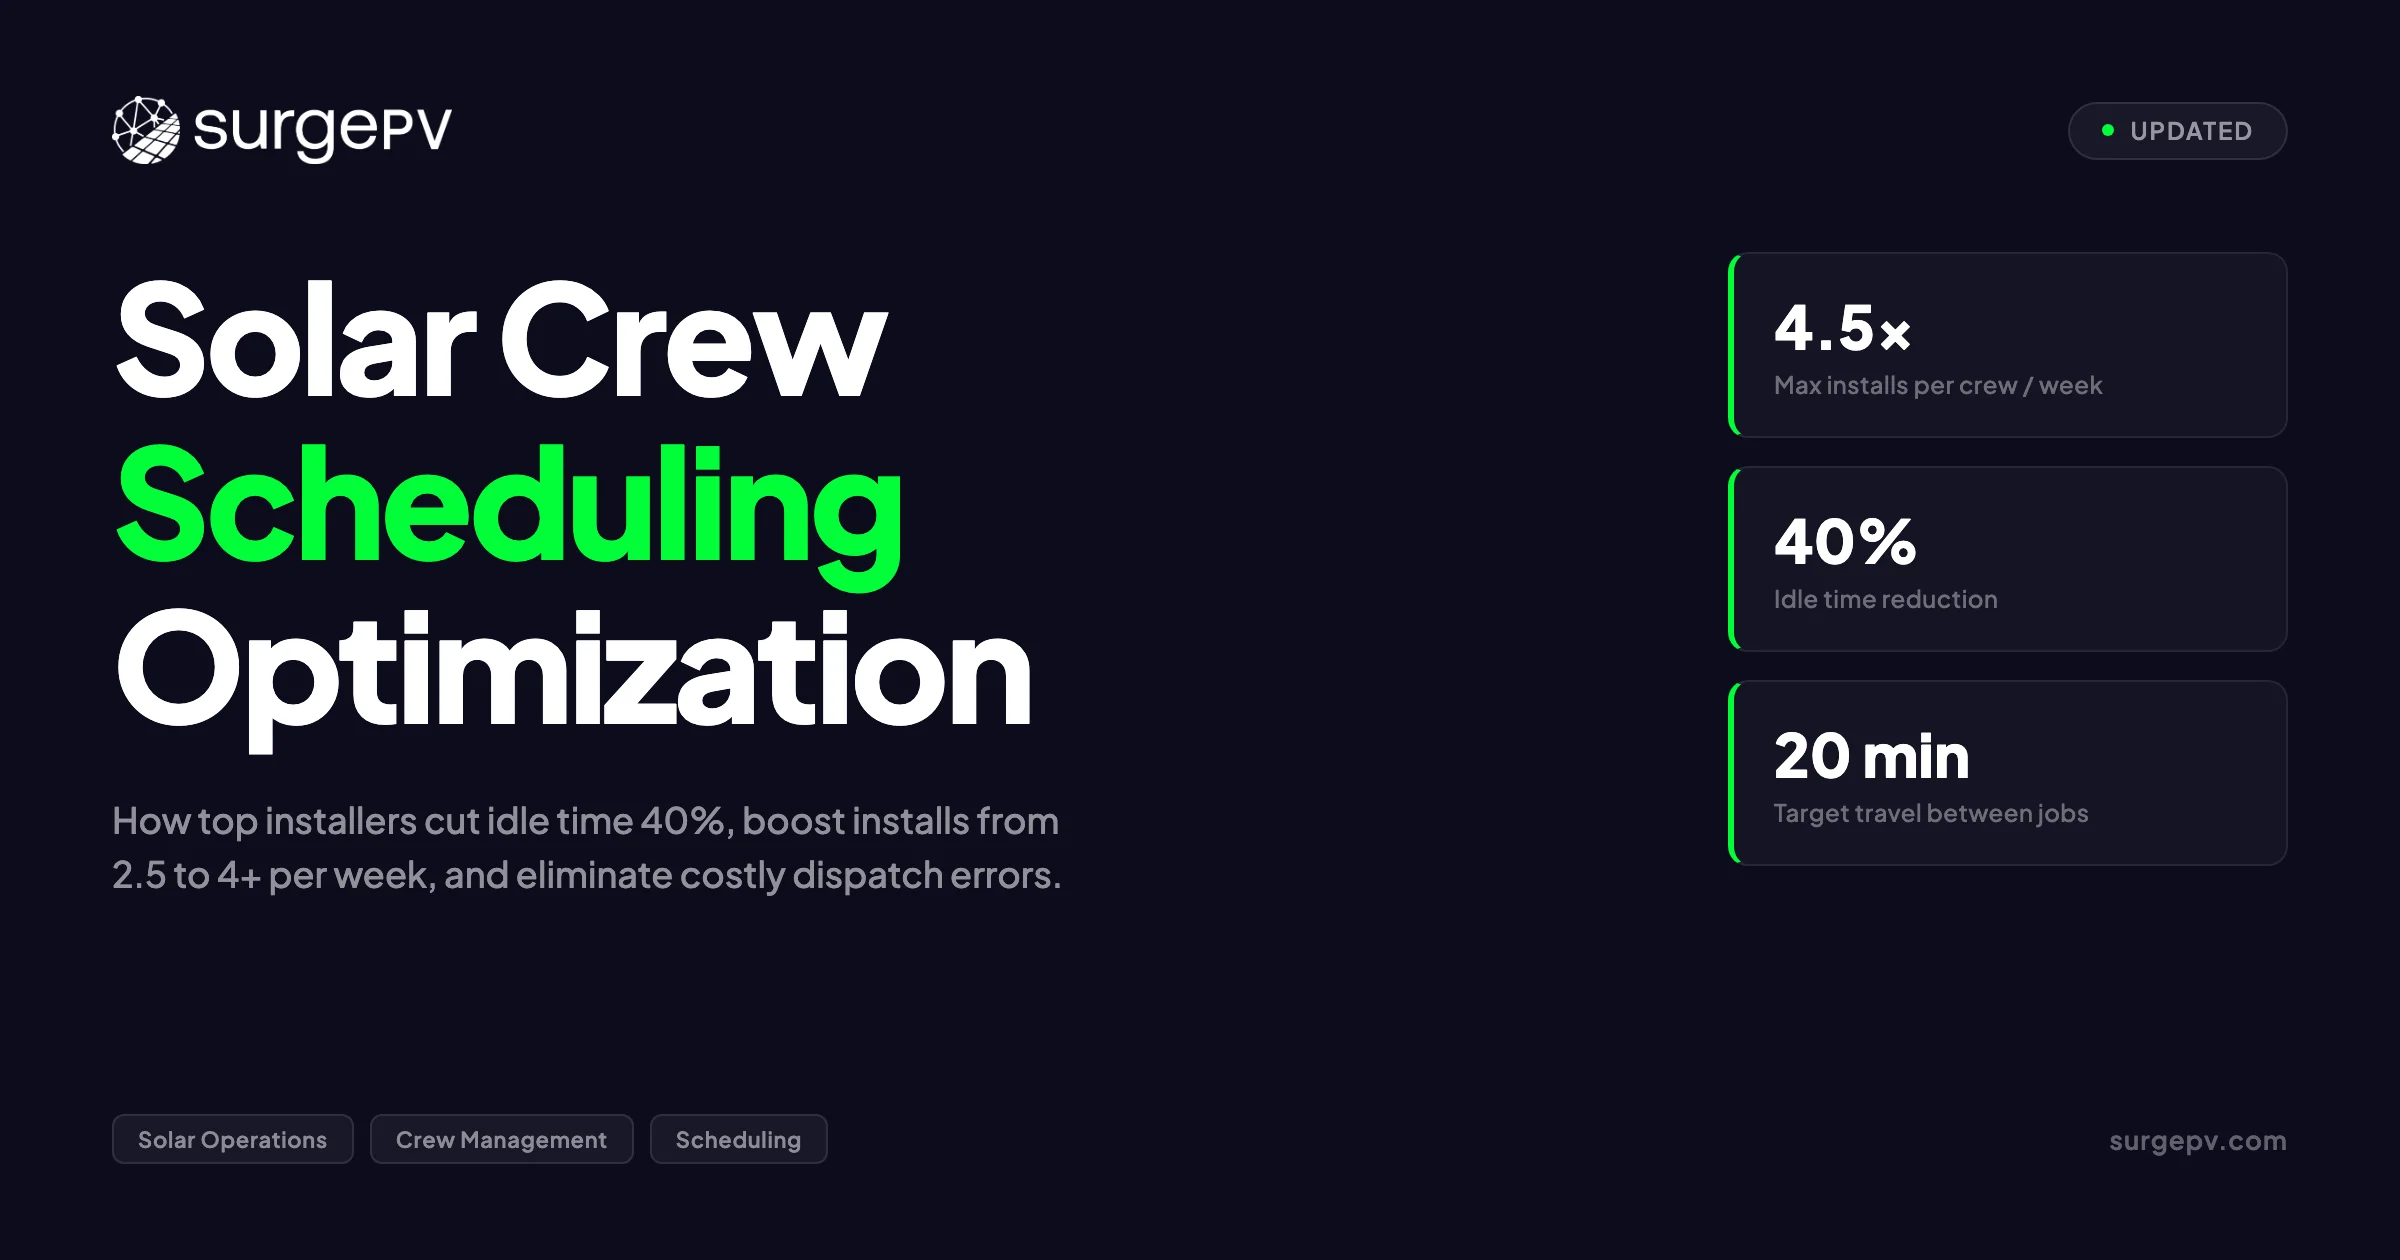
A typical US residential solar crew completes 2.2 installs per week. The best crews hit 4.5. That gap — more than double the output — does not come from working harder. It comes from scheduling better.
I have watched this gap close in real time. In 2019, my team at Heaven Green Energy ran a 12-crew operation across Gujarat and Rajasthan. We were averaging 2.4 installs per crew per week. Then we rebuilt our dispatch process from scratch. Within six months, the same crews — same people, same tools, same vans — were hitting 4.1 installs per week. The only thing that changed was how we decided who went where, and when.
This guide covers solar crew scheduling optimization in full. You will learn the principles that separate efficient dispatch from chaotic dispatch. You will see data on crew sizing, weather contingencies, travel optimization, and material pre-staging. You will get specific software recommendations and a framework for measuring whether your scheduling is improving or slipping.
Quick Answer — Solar Crew Scheduling Optimization
Top solar installers achieve 4+ residential installs per crew per week by clustering jobs geographically, pre-staging materials 24 hours in advance, building weather contingencies into weekly plans, and tracking six core KPIs weekly. The average installer sits at 2.2–2.8 installs per week. The 40–80% improvement gap is almost entirely schedulable.
See Solar Racking Design Guide for detailed guidance.
In this guide:
- Latest 2026 scheduling principles — what changed and what stayed the same
- Crew sizing math: how many crews for how much volume
- Weather contingency planning: the single biggest schedule killer
- Travel optimization: territory design and route sequencing
- Material and tool pre-staging: the hidden 1-hour-per-job savings
- Software tools: FSM platforms, route optimizers, and integration stacks
- Scheduling approaches compared: manual, semi-automated, and fully automated
- What most solar operations get wrong about dispatch
- Practical guidance: a week-by-week scheduling improvement plan
- FAQ
Solar Scheduling Principles: What Top Installers Do Differently
Solar crew scheduling optimization is not about finding one perfect algorithm. It is about eliminating the predictable sources of delay and building a system that adapts when the unpredictable ones hit.
The principles below are drawn from NREL installer survey data, Wood Mackenzie operational benchmarks, and direct observation of high-throughput solar operations across three continents.
Principle 1: Schedule Backward from Completion, Not Forward from Sale
Most solar companies schedule installs in the order contracts were signed. This is wrong.
The correct sequence is: permit approval → material availability → crew capacity → customer confirmation. A contract signed 60 days ago with no permit approval should not hold a slot on this week’s schedule. A contract signed 14 days ago with approved permits, staged materials, and a confirmed customer should get priority.
This sounds obvious. But in practice, sales pressure pushes operations to “get something on the calendar” before all four conditions are met. The result: last-minute cancellations, crews sent to unready sites, and cascading delays that infect the entire week’s plan.
What top installers do instead: They maintain a “schedule-ready” queue separate from the sales pipeline. A job enters the schedule-ready queue only after all four conditions are confirmed. The dispatch team pulls from this queue, not from the CRM. Sales teams are measured on contracts signed. Operations teams are measured on installs completed. The handoff between the two is a queue, not a calendar.
Principle 2: Territory Design Beats Route Optimization
Route optimization software is useful. Territory design is essential.
A crew that works within a 20-mile radius will spend less time driving than a crew that chases the shortest path between scattered jobs. The math is simple: two jobs 15 miles apart in the same territory take less total travel time than two jobs 10 miles apart but on opposite sides of a metro area during rush hour.
Top installers assign each crew a geographic territory. The territory is not rigid — crews can cross boundaries for overflow or complex jobs. But the default assumption is that Crew A works the north metro, Crew B works the south metro, and Crew C handles the suburbs. This cuts average travel time from 35–45 minutes per job to 12–18 minutes.
At 4 jobs per week, that travel time difference is 1.5 to 2.2 hours saved per crew. That is half an install.
Principle 3: Build Weather Buffers, Not Weather Excuses
Weather disrupts 18–24% of all residential solar schedules according to a 2024 NREL study. The installers who treat weather as an excuse blame it. The installers who treat it as a variable plan for it.
The planning approach has three components:
- Forecast integration: Pull 7-day weather forecasts into the dispatch system. Flag days with over 40% rain probability or wind above 20 mph.
- Indoor work reserves: Maintain a list of jobs that can proceed in rain — electrical panel upgrades, battery installs, indoor monitoring setup, and conduit runs through garages or basements.
- Capacity buffer: Schedule crews at 80–85% of theoretical maximum capacity. The 15–20% buffer absorbs weather delays without cascading into the following week.
A crew scheduled for 5 installs in a week with no buffer will fail if one day rains out. A crew scheduled for 4 installs with a rain-day backup plan will hit 4 consistently and occasionally hit 5.
Principle 4: Material Pre-Staging Is Non-Negotiable
Crews should never wait for materials. Materials should wait for crews.
Pre-staging means every panel, every rail, every bolt, and every inverter is on-site before the crew arrives. The crew walks onto a ready site and starts work immediately.
Without pre-staging, crews lose 1–2 hours per job to unloading, inventory checks, and parts runs. At 4 jobs per week, that is 4–8 hours of lost production — one full install.
The 24-hour pre-staging rule is simple: materials must be delivered by 5 PM the day before the install. If materials are not confirmed on-site, the job does not go on the schedule. No exceptions.
Pro Tip — The Pre-Staging Checklist
Before any job hits the schedule, confirm these six items: (1) panels and inverters delivered and signed for, (2) racking hardware counted and bagged by roof section, (3) electrical components (disconnects, conduit, wire) staged at the panel location, (4) special-order items (skirt kits, critter guards, rapid shutdown devices) verified, (5) roof condition photos reviewed by the crew lead, (6) customer confirmation call completed within 48 hours. Missing any one of these is a schedule risk.
Principle 5: Measure Weekly, Adjust Daily
Scheduling optimization is not a one-time project. It is a continuous feedback loop.
The six KPIs every solar operations manager should track weekly:
| KPI | Target | Why It Matters |
|---|---|---|
| Installs per crew per week | 3.5+ residential | Top-line throughput metric |
| Travel time per job | Under 20 minutes | Directly recoverable productive time |
| Schedule adherence rate | 85%+ | Measures planning accuracy |
| Material readiness rate | 95%+ | Eliminates on-site delays |
| Rework rate | Under 5% | Return visits destroy density |
| Crew utilization rate | 75%+ | Billable hours vs. paid hours |
Track these six numbers every Monday for the prior week. Post them where crews and dispatchers can see them. The act of measuring alone improves performance — people optimize what is visible.
Crew Sizing: How Many Installers per Crew, and How Many Crews per Volume
Crew sizing is the foundation of scheduling optimization. A crew that is too small takes too long per job. A crew that is too large wastes labor on tasks that do not need four people.
Residential Crew Size: The 3-Person Standard
The industry-standard residential solar crew is 3 people:
- Crew lead / electrician: Handles electrical work, panel connections, conduit runs, and final commissioning. Must be a licensed electrician in most jurisdictions.
- Roofer / installer 1: Leads racking and panel installation, roof safety setup, and structural work.
- Installer 2: Supports both trades, handles material staging on the roof, and manages ground logistics.
This 3-person crew can complete a standard 6–8 kWp residential install in 6–8 hours. Add a fourth person and the job might finish in 5–6 hours — but the labor cost per job rises. The fourth person is only worth it for complex jobs: steep roofs, tile roofs, ground mounts, or installs with battery additions. Read Ground Mounted Solar Design Guide for a complete walkthrough.
| Crew Size | Typical Jobs per Week | Best For |
|---|---|---|
| 2 people | 2.0–2.5 installs | Small systems, rural areas with low job density |
| 3 people | 3.0–4.0 installs | Standard residential — the industry default |
| 4 people | 3.5–4.5 installs | Complex roofs, battery adds, commercial small-scale |
| 5+ people | 4.0–5.0 installs | Large residential, commercial, or crew-in-training |
Data sourced from NREL 2025 US Solar Installer Survey and direct operational observation.
The Math: How Many Crews for Your Volume
A 3-person crew completing 3.5 installs per week generates 182 installs per year. If your company needs to complete 500 installs annually, you need approximately 2.75 crews — call it 3 crews with some seasonal variation.
But this math changes with seasonality. In the US Northeast, winter weather cuts weekly output by 30–40%. In the Southwest, summer heat can reduce afternoon productivity. The annual average matters less than the weekly peak — you need enough crews to handle your busiest weeks without creating idle time in slow weeks.
The 1.3x rule: Size your crew count at 1.3× your average weekly volume divided by installs per crew per week. This gives you the buffer for weather, sick days, and demand spikes.
Example: 10 average installs per week ÷ 3.5 per crew = 2.9 crews. Multiply by 1.3 = 3.8 crews. Round up to 4 crews.
Float Crews: The Secret Weapon of Mid-Size Installers
Specialist crews are efficient. But they are brittle. If your residential crew has no residential jobs this week, they sit idle.
The float crew model solves this. Maintain 1–2 float crews who handle:
- Overflow from busy specialist crews
- Commercial jobs that do not fit residential crew workflows
- Complex jobs (battery retrofits, main panel upgrades, ground mounts)
- Training new hires without disrupting specialist crew rhythm
For a 5-crew operation, the ideal structure is 3 specialist residential crews, 1 commercial/float crew, and 1 crew that rotates between float and residential based on demand. This gives you flexibility without the cost of idle specialists.
Weather Contingencies: Planning for the Unplannable
Weather is not a scheduling surprise. It is a scheduling input.
What Weather Stops Solar Work
Not all bad weather halts installation. Here is the practical threshold:
| Condition | Work Stops When | Why |
|---|---|---|
| Rain | Any active precipitation | Slip hazard, roofing warranty void, electrical shock risk |
| Wind | Sustained 25+ mph or gusts 35+ mph | Panel lifting danger, ladder instability |
| Snow / ice | Any accumulation on roof | Fall risk, hidden penetration damage |
| Extreme heat | Heat index above 105°F | OSHA guidelines, crew safety |
| Lightning | Within 10 miles | Mandatory cessation per OSHA 1926.95 |
Source: OSHA 1926 Subpart M (Fall Protection) and industry safety guidelines.
Building Weather Into the Weekly Schedule
Here is how top operations handle weather:
Monday morning weather review: The operations manager pulls a 7-day forecast for every territory. Jobs in territories with rain forecast for Tuesday or Wednesday are flagged.
Rain-day job pool: Maintain a separate list of jobs that can proceed in any weather — indoor electrical work, battery installations, monitoring system setups, and site surveys. When rain is forecast, pull from this pool.
The 48-hour confirmation rule: Confirm every job with the customer 48 hours in advance. If weather has shifted and the job is now at risk, reschedule immediately. Do not wait until the morning of.
Seasonal capacity planning: In climates with harsh winters, plan for 25–30% lower weekly output from November through February. Either reduce crew count seasonally (difficult with skilled labor) or build a backlog of indoor work (service calls, battery retrofits, maintenance) to fill the gap.
What Most Installers Get Wrong About Weather
Most solar operations treat weather as a reason to cancel. Top operations treat it as a reason to resequence. The difference is having a rain-day job pool ready before the forecast turns. If your only option on a rainy Tuesday is to send crews home, your scheduling system is incomplete.
The Cost of Weather-Related Delays
A 2024 Wood Mackenzie analysis found that weather-related schedule slippage added $340–$520 per residential install in labor cost inflation between 2022 and 2024. The mechanism is simple: a rain delay pushes a job from Tuesday to Friday. Friday is now double-booked. One job gets pushed to the following week. That cascades into the following week’s plan. By the end of the month, you are 3–4 installs behind schedule with no way to catch up without overtime or subcontractor premiums.
The fix is not better weather forecasting. It is better weather response — a system that absorbs delays without cascading.
Travel Optimization: Territory Design and Route Sequencing
Travel time is the most visible waste in solar operations. It is also the easiest to fix.
The Territory Model
Assign each crew a primary territory. The territory should contain enough job volume to keep the crew busy 4 days per week. The 5th day handles overflow, complex jobs, and catch-up from weather delays.
Territory boundaries should follow natural geographic divides: highways, rivers, city limits, or county lines. Avoid splitting neighborhoods — a crew should not cross a major highway multiple times per day.
| Metro Size | Territories | Crews per Territory | Weekly Jobs per Territory |
|---|---|---|---|
| Small metro (under 500K) | 2–3 | 1 | 3–5 |
| Medium metro (500K–2M) | 4–6 | 1–2 | 6–12 |
| Large metro (2M+) | 6–10 | 2–3 | 12–20 |
Route Sequencing Within a Day
Within a territory, sequence jobs to minimize travel:
- Start farthest from the warehouse and work back toward it. This avoids rush-hour traffic on the longest leg.
- Cluster by neighborhood. Two jobs in the same subdivision should be on the same day, even if one was sold a week later.
- Match job duration to time of day. Start long jobs early. Schedule shorter jobs (panel swaps, add-ons) for afternoon slots.
- Avoid crossing the metro during the day. A crew that starts north and ends south loses 45–90 minutes to traffic.
Route Optimization Software
Several tools handle route optimization for field service:
| Tool | Best For | Key Feature |
|---|---|---|
| Route4Me | Small to mid-size installers | Simple interface, mobile app, traffic integration |
| OptimoRoute | Mid-size to large operations | AI-powered sequencing, multi-day planning |
| Onfleet | Delivery-style dispatch | Real-time tracking, customer notifications |
| ServiceTitan (built-in) | Existing ServiceTitan users | Native CRM integration, no separate tool |
The best tool is the one your dispatchers actually use. A sophisticated optimizer that sits unused because the interface is confusing is worse than a simple tool used consistently.
Pro Tip — The 20-Minute Rule
Set a hard rule: no job should be more than 20 minutes from the previous job or the next job. If the route optimizer suggests a 35-minute drive between two jobs, reschedule one. The 20-minute rule forces territorial discipline and prevents dispatchers from chasing “efficient” routes that are actually time sinks.
The Hidden Cost of Same-Day Material Runs
Travel optimization is not just about getting crews to jobs. It is also about keeping crews at jobs once they arrive.
A material run — sending a crew member to the warehouse or supplier for a missing part — destroys schedule density. A 45-minute parts run plus 45 minutes back is 1.5 hours lost. That is 20% of a standard workday.
The fix is the pre-staging rule discussed earlier: every material must be on-site before the crew arrives. No exceptions. The cost of a single parts run — in labor, fuel, and lost production — exceeds the cost of pre-staging every job for a month.
Tool and Material Preparation: The 24-Hour Pre-Staging Rule
Pre-staging is the single highest-ROI scheduling improvement available to most solar installers. It costs almost nothing to implement and saves 1–2 hours per job.
What Pre-Staging Means
Pre-staging means all materials are delivered to the job site before the install date. This includes:
- Solar panels (palleted and protected)
- Inverter(s) and rapid shutdown devices
- Racking rails, clamps, and hardware (organized by roof section)
- Electrical components: disconnects, conduit, wire, junction boxes
- Special items: skirt kits, critter guards, monitoring hardware, battery modules
- Consumables: sealant, flashing, lag bolts, wire nuts, labels
The crew arrives, verifies the staging, and begins work. No unloading. No inventory. No parts runs.
The Pre-Staging Checklist
Before a job is confirmed on the schedule, the operations team should verify:
- Panel and inverter delivery confirmed with tracking or delivery receipt
- Racking hardware counted against the bill of materials for that roof design
- Electrical components staged at the service panel location
- Special-order items verified — these are the most common delay source
- Roof condition photos reviewed by the crew lead for access and safety concerns
- Customer confirmation call completed within 48 hours of install date
If any item is missing, the job does not go on the schedule. It moves to a “pending staging” status and gets rescheduled once complete.
Pre-Staging Logistics Models
There are three common approaches to material logistics:
| Model | How It Works | Best For |
|---|---|---|
| Warehouse delivery | Materials leave the warehouse on a delivery truck the day before | Mid-size to large operations with a central warehouse |
| Direct ship to site | Panels and inverters ship directly from distributor to customer address | Small operations without warehouse space |
| Hybrid model | Panels ship direct; hardware and electricals come from warehouse | Most common approach; balances cost and control |
The hybrid model is what most successful installers use. Panels ship directly from the distributor to the job site (they are bulky and expensive to double-handle). Racking, electricals, and consumables are picked from the warehouse and delivered by company truck or courier.
Tool Standardization Across Crews
Every crew should carry the same tool set, organized the same way, in the same vehicle configuration. When Crew A finishes a job and Crew B starts the next job in the same neighborhood, there should be no tool gap.
Standard tool sets for a 3-person residential crew:
- Cordless impact drivers (2×) with socket sets
- Cordless drill/drivers (2×)
- Reciprocating saw and circular saw
- Conduit benders and threaders
- Wire strippers, crimpers, and testers
- Fall protection harnesses and anchors (3×)
- Ladders: 6-foot step, 28-foot extension, and roof ladder
- Panel cart or dolly for roof transport
Tool standardization also simplifies training. A new hire learns one setup, not three different ones depending on which crew they join.
Scheduling Approaches Compared: Manual, Semi-Automated, and Fully Automated
Not every installer needs the same scheduling sophistication. The right approach depends on crew count, job volume, and operational maturity.
Approach 1: Manual Scheduling (1–3 Crews)
Manual scheduling means a dispatcher uses a whiteboard, spreadsheet, or calendar tool to assign jobs to crews. This works at small scale but breaks down quickly.
Pros: Zero software cost, maximum flexibility, dispatcher has full situational awareness.
Cons: No optimization, no integration with CRM or inventory, no data for improvement, highly dependent on one person’s memory and judgment.
When to use: Only for operations with 1–3 crews and under 10 jobs per week. Beyond that, the cognitive load on the dispatcher becomes a bottleneck.
Approach 2: Semi-Automated Scheduling (3–15 Crews)
Semi-automated scheduling uses a field service management (FSM) platform that connects CRM, inventory, and dispatch. The dispatcher still makes final decisions, but the system provides recommendations, flags conflicts, and tracks performance.
Leading FSM platforms for solar:
| Platform | Starting Price | Solar-Specific Features |
|---|---|---|
| ServiceTitan | $398/month | Native CRM, financing integration, marketing attribution |
| Housecall Pro | $79/month | Simple interface, good for small to mid-size |
| Jobber | $79/month | Strong scheduling, good mobile app |
| Service Fusion | $149/month | Mid-market focus, good reporting |
| AccuLynx | Custom pricing | Built for roofing and solar; strong photo/documentation |
Pros: Integration reduces manual data entry, automated reminders reduce no-shows, reporting surfaces trends.
Cons: Requires disciplined data entry, monthly subscription cost, learning curve for dispatchers.
When to use: The sweet spot is 3–15 crews. Below 3, the cost may not justify the benefit. Above 15, the semi-automated approach starts to strain under volume.
Approach 3: Fully Automated Scheduling (15+ Crews)
Fully automated scheduling uses AI-powered optimization that assigns jobs to crews based on constraints, priorities, and real-time conditions. The dispatcher becomes an exception handler rather than a decision-maker.
Enterprise tools:
| Platform | Best For | Key Capability |
|---|---|---|
| Oracle Field Service | Large EPCs | AI-driven scheduling, complex constraint modeling |
| Salesforce Field Service | Salesforce-native operations | Deep CRM integration, predictive scheduling |
| Custom build | Unique workflows | Tailored to exact business logic, highest integration |
Pros: Handles complexity at scale, optimizes across hundreds of variables, reduces dispatcher headcount.
Cons: High implementation cost ($50K–$500K+), requires clean data, inflexible for edge cases, long deployment timeline.
When to use: 15+ crews, or operations across multiple states/regions with complex regulatory and permitting variations.
Scheduling Approach Comparison Table
| Dimension | Manual | Semi-Automated | Fully Automated |
|---|---|---|---|
| Crew count | 1–3 | 3–15 | 15+ |
| Weekly jobs | Under 10 | 10–60 | 60+ |
| Monthly software cost | $0 | $200–$1,500 | $3,000–$15,000+ |
| Implementation timeline | Immediate | 2–4 weeks | 3–12 months |
| Dispatcher time per week | 15–20 hours | 8–12 hours | 4–6 hours (exception handling) |
| Schedule adherence | 60–75% | 80–90% | 90–95% |
| Data for improvement | None | Basic reports | Advanced analytics |
| Best fit | Startup phase | Growth phase | Scale phase |
Schedule adherence percentages based on industry benchmarks and NREL installer survey data, 2024–2025.
Cut Scheduling Waste by 40% with Better Design Workflows
Accurate designs mean accurate material lists. Accurate material lists mean zero parts runs. SurgePV’s solar design software generates precise bills of materials from every project design — so your crews never wait on-site for missing hardware.
Book a DemoNo commitment required · 20 minutes · Live project walkthrough
Software Integration: The Scheduling Tech Stack
Scheduling does not exist in isolation. It connects to sales, design, permitting, inventory, and customer communication. The quality of those connections determines scheduling accuracy.
The Ideal Integration Flow
- Sales closes a deal in the CRM (HubSpot, Salesforce, or built-in FSM CRM)
- Design team uploads the system design to the project file, including bill of materials
- Permitting team tracks application status and updates the project when approved
- Warehouse team stages materials and confirms delivery to the job site
- Scheduling system pulls jobs that are “schedule-ready” (permit + materials + customer confirmation)
- Dispatcher assigns jobs to crews based on territory, skill match, and route optimization
- Crews receive job details via mobile app, including photos, roof diagrams, and customer notes
- Crews mark jobs complete in the field, triggering invoicing and warranty registration
Any break in this chain creates a scheduling risk. The most common breaks:
- Sales marks a job “ready to schedule” before permits are approved
- Design changes after materials are ordered, creating mismatched hardware
- Permitting status is not updated in the scheduling system, so the dispatcher does not know a job is blocked
- Materials are confirmed staged but never actually delivered
- Customer is not confirmed, leading to no-shows
Integration Priority Matrix
If you cannot integrate everything at once, prioritize in this order:
| Priority | Integration | Why |
|---|---|---|
| 1 | Permitting status → scheduling | Prevents dispatching to unready sites |
| 2 | Material staging → scheduling | Eliminates on-site delays |
| 3 | CRM → scheduling | Ensures schedule-ready queue is accurate |
| 4 | Customer communication → scheduling | Reduces no-shows and last-minute cancellations |
| 5 | Design/BOM → inventory | Prevents material ordering errors |
Mobile Access for Crews
Crews need mobile access to job details, customer contact info, roof photos, and the ability to mark jobs complete. Every major FSM platform offers a mobile app. The key features to evaluate:
- Offline functionality: Can crews access job details without cell service? Many rural installs have poor coverage.
- Photo capture: Can crews upload completion photos directly from the app? This is critical for quality control and warranty documentation.
- Time tracking: Does the app track crew arrival and departure times automatically? This feeds utilization metrics.
- Customer signature: Can the customer sign off on completion via the crew’s tablet or phone?
The Contrarian View: Why Over-Optimization Hurts
Here is a take that goes against the scheduling orthodoxy: aggressive optimization can backfire.
A schedule packed to 100% capacity with zero buffer looks efficient on paper. In reality, it is brittle. One flat tire, one sick crew member, one permit delay, and the entire week collapses. The cascading delays cost more than the “inefficiency” of a 15% buffer.
I learned this in Rajasthan during the 2019 monsoon. We had optimized our schedules to 95% capacity. When three days of unexpected heavy rain hit, we had no flexibility. Crews sat idle for two days, then worked 12-hour days for a week to catch up. The overtime cost exceeded what we would have “lost” by scheduling at 80% capacity year-round.
The tradeoff: Scheduling at 80% capacity with weather contingencies costs you 0.7 installs per crew per week in theoretical maximum. But it gains you schedule stability, crew morale, and customer satisfaction. For most installers, that tradeoff pays off.
Another contrarian view: software is not the answer for every installer. I have seen 5-crew operations spend $30,000 on a custom scheduling system that their dispatchers never fully adopted. The spreadsheets they used before were faster, more flexible, and required no training. Software is a tool, not a solution. The solution is disciplined process. Software amplifies good process and magnifies bad process.
The Misconception: More Crews = More Output
The most common misconception in solar operations is that adding crews linearly increases output. It does not.
Each additional crew adds coordination overhead: more dispatch decisions, more material staging, more quality control checks, more customer communication. The marginal output per crew declines as crew count grows unless the scheduling and management systems scale with it.
A 3-crew operation might average 3.5 installs per crew per week. A 10-crew operation with the same management approach might average 2.8. The difference is not the crews. It is the scheduling system buckling under complexity.
The fix is not to stop growing. It is to upgrade the scheduling system at each inflection point: from manual to semi-automated around 3 crews, and from semi-automated to fully integrated around 15 crews.
A First-Hand Observation: The Dispatch Meeting That Changed Everything
In 2019, our dispatch meeting at Heaven Green Energy was a 90-minute ordeal every Monday morning. The operations manager walked through a whiteboard of 40+ jobs. Crew leads argued about territory boundaries. Sales reps pressured for their deals to get priority. By the end, everyone was frustrated and the schedule was already out of date.
We changed one thing: we moved the dispatch decision from the meeting to the system.
The meeting became a 15-minute review of exceptions. “Job 1847 is missing panels — who is following up?” “Crew C has a sick day Thursday — who covers?” Everything else was handled by the scheduling rules: territory assignments, material readiness checks, route sequencing. The dispatcher managed the system, not the schedule.
Installs per crew per week went from 2.4 to 3.8 in four months. The crews did not change. The vans did not change. The customers did not change. The only thing that changed was how we decided who went where.
An Original Calculation: The Cost of One Schedule Failure
Let me walk through the math of a single scheduling failure — a crew dispatched to a site where materials are not staged.
Scenario: 3-person crew, $35/hour blended labor rate, 45-minute drive to site, 30-minute discovery that materials are missing, 45-minute drive to warehouse, 60-minute parts pickup, 45-minute drive back to site. Total delay: 3.75 hours.
Direct cost: 3.75 hours × 3 people × $35/hour = $393.75 in labor
Opportunity cost: The crew completes 0.6 fewer installs that week. At $800 gross margin per install, that is $480 in lost margin.
Customer cost: The job pushes to the next week. The customer calls twice. The NPS score drops. The referral probability falls.
Total cost of one material staging failure: $873.75 in direct and opportunity cost, plus unmeasured customer impact.
If this happens once per crew per month in a 5-crew operation, the annual cost is $52,425. A simple pre-staging checklist eliminates it.
Practical Guidance: A 90-Day Scheduling Improvement Plan
If your solar operation is not hitting 3.5+ installs per crew per week, here is a concrete plan to get there.
Week 1–2: Measure Baseline
Track the six KPIs for two weeks without changing anything. You need a baseline to measure improvement against.
- Installs per crew per week
- Travel time per job
- Schedule adherence rate
- Material readiness rate
- Rework rate
- Crew utilization rate
Post these numbers where everyone can see them. Do not judge. Just measure.
Week 3–4: Implement the Pre-Staging Rule
Create the 6-item pre-staging checklist. Train warehouse and dispatch teams. No job goes on the schedule until all six items are confirmed.
Expect pushback. Sales will want their deals scheduled. Dispatch will want flexibility. Hold the line. The pre-staging rule is the highest-ROI change you can make.
Week 5–6: Design Territories
Map your service area. Draw territory boundaries. Assign each crew a primary territory. Track travel time per job — it should drop immediately.
Week 7–8: Build the Rain-Day Job Pool
Identify jobs that can proceed in any weather: indoor electrical work, battery installs, monitoring setups, site surveys. When rain is forecast, pull from this pool instead of canceling.
Week 9–10: Add Weather Forecast Integration
Pull 7-day forecasts into your dispatch review. Flag high-risk days. Confirm jobs 48 hours in advance. Reschedule proactively, not reactively.
Week 11–12: Evaluate Software
If you are still on manual scheduling and have 3+ crews, evaluate FSM platforms. Run trials of ServiceTitan, Housecall Pro, or Jobber. Pick one and commit.
Month 4+: Optimize and Refine
By month 4, you should see installs per crew per week rise by 30–50%. Now optimize: tighten territories, refine the rain-day pool, add route optimization software, and build custom reports.
Latest Updates: Solar Crew Scheduling 2026
The solar operations environment shifted between 2024 and 2026 in ways that affect scheduling directly.
Labor Market Tightness
The US solar industry employed approximately 280,000 workers in 2024 according to the National Solar Jobs Census. Skilled electricians and experienced installers remain in short supply. This makes crew retention more important than crew expansion. Scheduling optimization that reduces overtime and improves work-life balance becomes a retention tool, not just a cost tool.
NEM 3.0 and California Scheduling Surge
California’s NEM 3.0 transition in 2023 created a massive scheduling surge as installers rushed to interconnect under NEM 2.0 rules. That surge has normalized, but the operational lessons remain: sudden demand spikes break scheduling systems that are not designed for variability. The installers who survived NEM 3.0 with their sanity intact were the ones with buffer capacity and flexible crew models.
Supply Chain Normalization
Module and inverter lead times normalized in 2024–2025 after the 2021–2023 shortages. This makes material pre-staging more reliable — distributors now stock inventory rather than operating on allocation. The scheduling benefit is fewer last-minute material substitutions that require design changes and re-staging.
Software Market Consolidation
The FSM software market consolidated between 2024 and 2026. ServiceTitan acquired several smaller players. Salesforce deepened its field service offerings. For solar installers, this means fewer choices but deeper integrations. The trend is toward all-in-one platforms rather than best-of-breed point solutions.
Key Takeaway — Scheduling in 2026
The fundamentals of solar crew scheduling have not changed: territory design, material pre-staging, weather contingencies, and disciplined measurement. What has changed is the toolset. Modern FSM platforms make these fundamentals easier to execute at scale. The installers winning in 2026 are not the ones with the most software. They are the ones with the most disciplined process, amplified by the right software.
Frequently Asked Questions
What is solar crew scheduling optimization?
Solar crew scheduling optimization is the process of assigning installation crews to jobs, routes, and time slots in a way that minimizes travel time, eliminates idle hours, and maximizes the number of completed installs per crew per week. It combines route planning, weather forecasting, material readiness checks, and crew skill matching into a single dispatch decision. Top-performing installers achieve 4+ residential installs per crew per week through systematic scheduling, compared to 2–2.5 for companies that dispatch manually.
How many solar installs can one crew complete per week?
A well-scheduled residential solar crew can complete 3.5 to 4.5 installs per week in favorable conditions. The US residential solar industry average sits at 2.2 to 2.8 installs per crew per week according to 2025 NREL installer survey data. The gap between average and top performers comes from scheduling discipline: route density, material pre-staging, weather contingency planning, and eliminating same-day cancellations. Commercial crews work on longer timelines — one 100 kWp commercial rooftop may take 3–5 days — so weekly throughput is measured in kWp completed rather than project count.
What software do solar installers use for crew scheduling?
Leading solar installers use dedicated field service management (FSM) platforms: ServiceTitan, Housecall Pro, Jobber, and Service Fusion are the most common in the US market. Larger EPCs with 50+ crews often build custom dispatch systems or use enterprise tools like Oracle Field Service and Salesforce Field Service. The critical feature for solar is integration: the scheduling tool must connect to CRM (for sales handoff), inventory (for material availability), and permitting status (to avoid dispatching before interconnection approval). Standalone calendar tools like Google Calendar or Outlook fail at solar scale because they lack these integrations.
How does weather affect solar crew scheduling?
Weather is the single largest external disruptor of solar crew schedules. Rain stops rooftop work entirely — even light rain creates slip hazards and voids many roofing warranties if penetrations are made in wet conditions. Wind above 25 mph halts panel lifting. Snow and ice add setup time and safety risk. A 2024 NREL study found that weather-related delays account for 18–24% of all residential solar schedule slippage. Top installers build weather contingencies directly into their dispatch logic: they schedule indoor electrical work or battery installs on forecast rain days, and they maintain a 15–20% buffer in weekly crew capacity to absorb weather-driven reschedules without cascading delays.
What is the cost of poor crew scheduling in solar installation?
Poor crew scheduling costs solar installers $180–$350 per idle crew day in direct labor alone. For a 10-crew operation, one poorly planned week can cost $9,000–$17,500 in wasted payroll. The hidden costs are larger: customer satisfaction drops when installs reschedule repeatedly, permit timelines expire if work does not start within approved windows, and crew morale suffers when teams sit in trucks or drive excessive distances between jobs. A 2025 Wood Mackenzie analysis found that scheduling inefficiency was the second-largest driver of residential solar cost inflation between 2022 and 2024, behind only module price volatility.
Should solar crews specialize or rotate across job types?
Specialization wins at scale. Crews that focus exclusively on residential rooftop installs complete jobs 15–20% faster than generalist crews who split time between residential, commercial, and battery retrofits. The reason is tool familiarity, muscle memory, and reduced cognitive load. However, specialization requires sufficient job volume to keep crews busy — a specialist residential crew needs at least 3–4 jobs per week to justify the model. For smaller installers with variable demand, a hybrid approach works better: core crews specialize, with one or two float crews that handle overflow, commercial work, and complex jobs. The float crew model is what most mid-size installers (5–15 crews) use successfully.
How do you optimize travel time between solar installation sites?
Travel time optimization for solar crews follows three principles. First, cluster jobs geographically by assigning each crew to a territory rather than dispatching crews across an entire service area. Second, schedule jobs in sequence along a route — never send a crew to the north side of a city in the morning and the south side in the afternoon. Third, use route optimization software (Route4Me, OptimoRoute, or built-in FSM tools) that accounts for real-time traffic and job duration estimates. A crew that drives 45 minutes between jobs loses 1.5 hours per day to travel. Cut that to 15 minutes and you gain one full install per week per crew.
What is pre-staging and why does it matter for scheduling?
Pre-staging means delivering all materials, racking, panels, and hardware to the job site before the crew arrives. Without pre-staging, crews waste 1–2 hours per job unloading trucks, counting parts, and discovering missing items. With pre-staging, the crew walks onto a ready site and begins work immediately. Pre-staging requires coordination between the warehouse, delivery logistics, and scheduling teams. The best solar operations run a 24-hour pre-staging rule: materials must be on-site by 5 PM the day before the install. This rule alone can add 0.5 to 1 additional install per crew per week.
How do permit timelines affect crew scheduling?
Permit approval is the most common reason solar installs get pulled from the schedule at the last minute. A crew dispatched to a site without approved permits cannot legally begin work. In jurisdictions with slow permitting — some California AHJs take 4–8 weeks — the gap between permit application and approval creates a scheduling trap. The fix is a permit-tracking workflow integrated into the dispatch system: jobs move to “schedule-ready” status only after permit approval, not after contract signing. Some installers also build permit-expiration buffers — if a permit is valid for 180 days, they schedule the install within 150 days to avoid last-minute scrambles if the permit lapses.
What KPIs should solar operations managers track for crew scheduling?
The six essential scheduling KPIs for solar operations are: (1) Installs per crew per week — the top-line throughput metric; (2) Travel time per job — target under 20 minutes between sites; (3) Schedule adherence rate — percentage of jobs completed on the originally scheduled date; (4) Material readiness rate — percentage of jobs where all materials were pre-staged before crew arrival; (5) Rework rate — percentage of installs requiring a return visit, which destroys scheduling density; (6) Crew utilization rate — billable hours divided by total paid hours, target 75%+. Tracking these six metrics weekly surfaces scheduling problems before they become crises.
Conclusion: Three Actions to Take This Week
Solar crew scheduling optimization is not a software purchase. It is a discipline. The installers who master it complete twice as many jobs with the same crews. The ones who do not spend their days putting out dispatch fires.
Here are three actions you can take this week:
- Track the six KPIs for two weeks. Do not change anything yet. Just measure. You need a baseline before you can improve.
- Implement the 24-hour pre-staging rule. No job goes on the schedule until all materials are confirmed on-site. This one rule will save you 1–2 hours per job.
- Draw territory boundaries on a map. Assign each crew a primary territory. Enforce the 20-minute rule between jobs. Watch travel time drop immediately.
Scheduling is the invisible engine of solar operations. You do not see it when it works. You feel it when it breaks. Fix it now, and your crews will thank you — with output.
Related SurgePV Resources
Continue learning with these related guides for solar installers and EPCs:
- Solar Fleet Management
- Seasonal Demand Planning for Solar
- Solar Inventory Management
- Solar Material Procurement Strategy
- How to Expedite Solar Permits
For more solar business and marketing content, explore the full SurgePV blog or browse the SurgePV glossary for definitions of solar industry terms. For a direct comparison, see Arka 360 vs SurgePV.
Solar Software Tools to Support This Work
Effective solar installer operations depend on integrated software. SurgePV’s solar design software helps installers handle the upstream work that feeds every decision in this guide:
- Solar design software for system layouts, panel placement, and BOM generation
- Shadow analysis for site-specific irradiance and obstruction modeling
- Generation and financial tool for production forecasts and project ROI
- Solar proposal software for branded, customer-facing proposals
- Clara AI for automated design assistance and Q&A
Browse the full SurgePV platform to see how installers across 50+ countries use the tools to design smarter, sell faster, and streamline every solar project.


