Quick Answer
Solar cell efficiency has grown from 6% (Bell Labs, 1954) to 47.6% (NREL, six-junction concentrator, 2020). Commercial silicon panels reached 23.2% (Jinko Tiger Neo, 2025). Perovskite-silicon tandems hit 33.9% in 2024. The theoretical Shockley-Queisser limit for single-junction silicon is 33.7%.
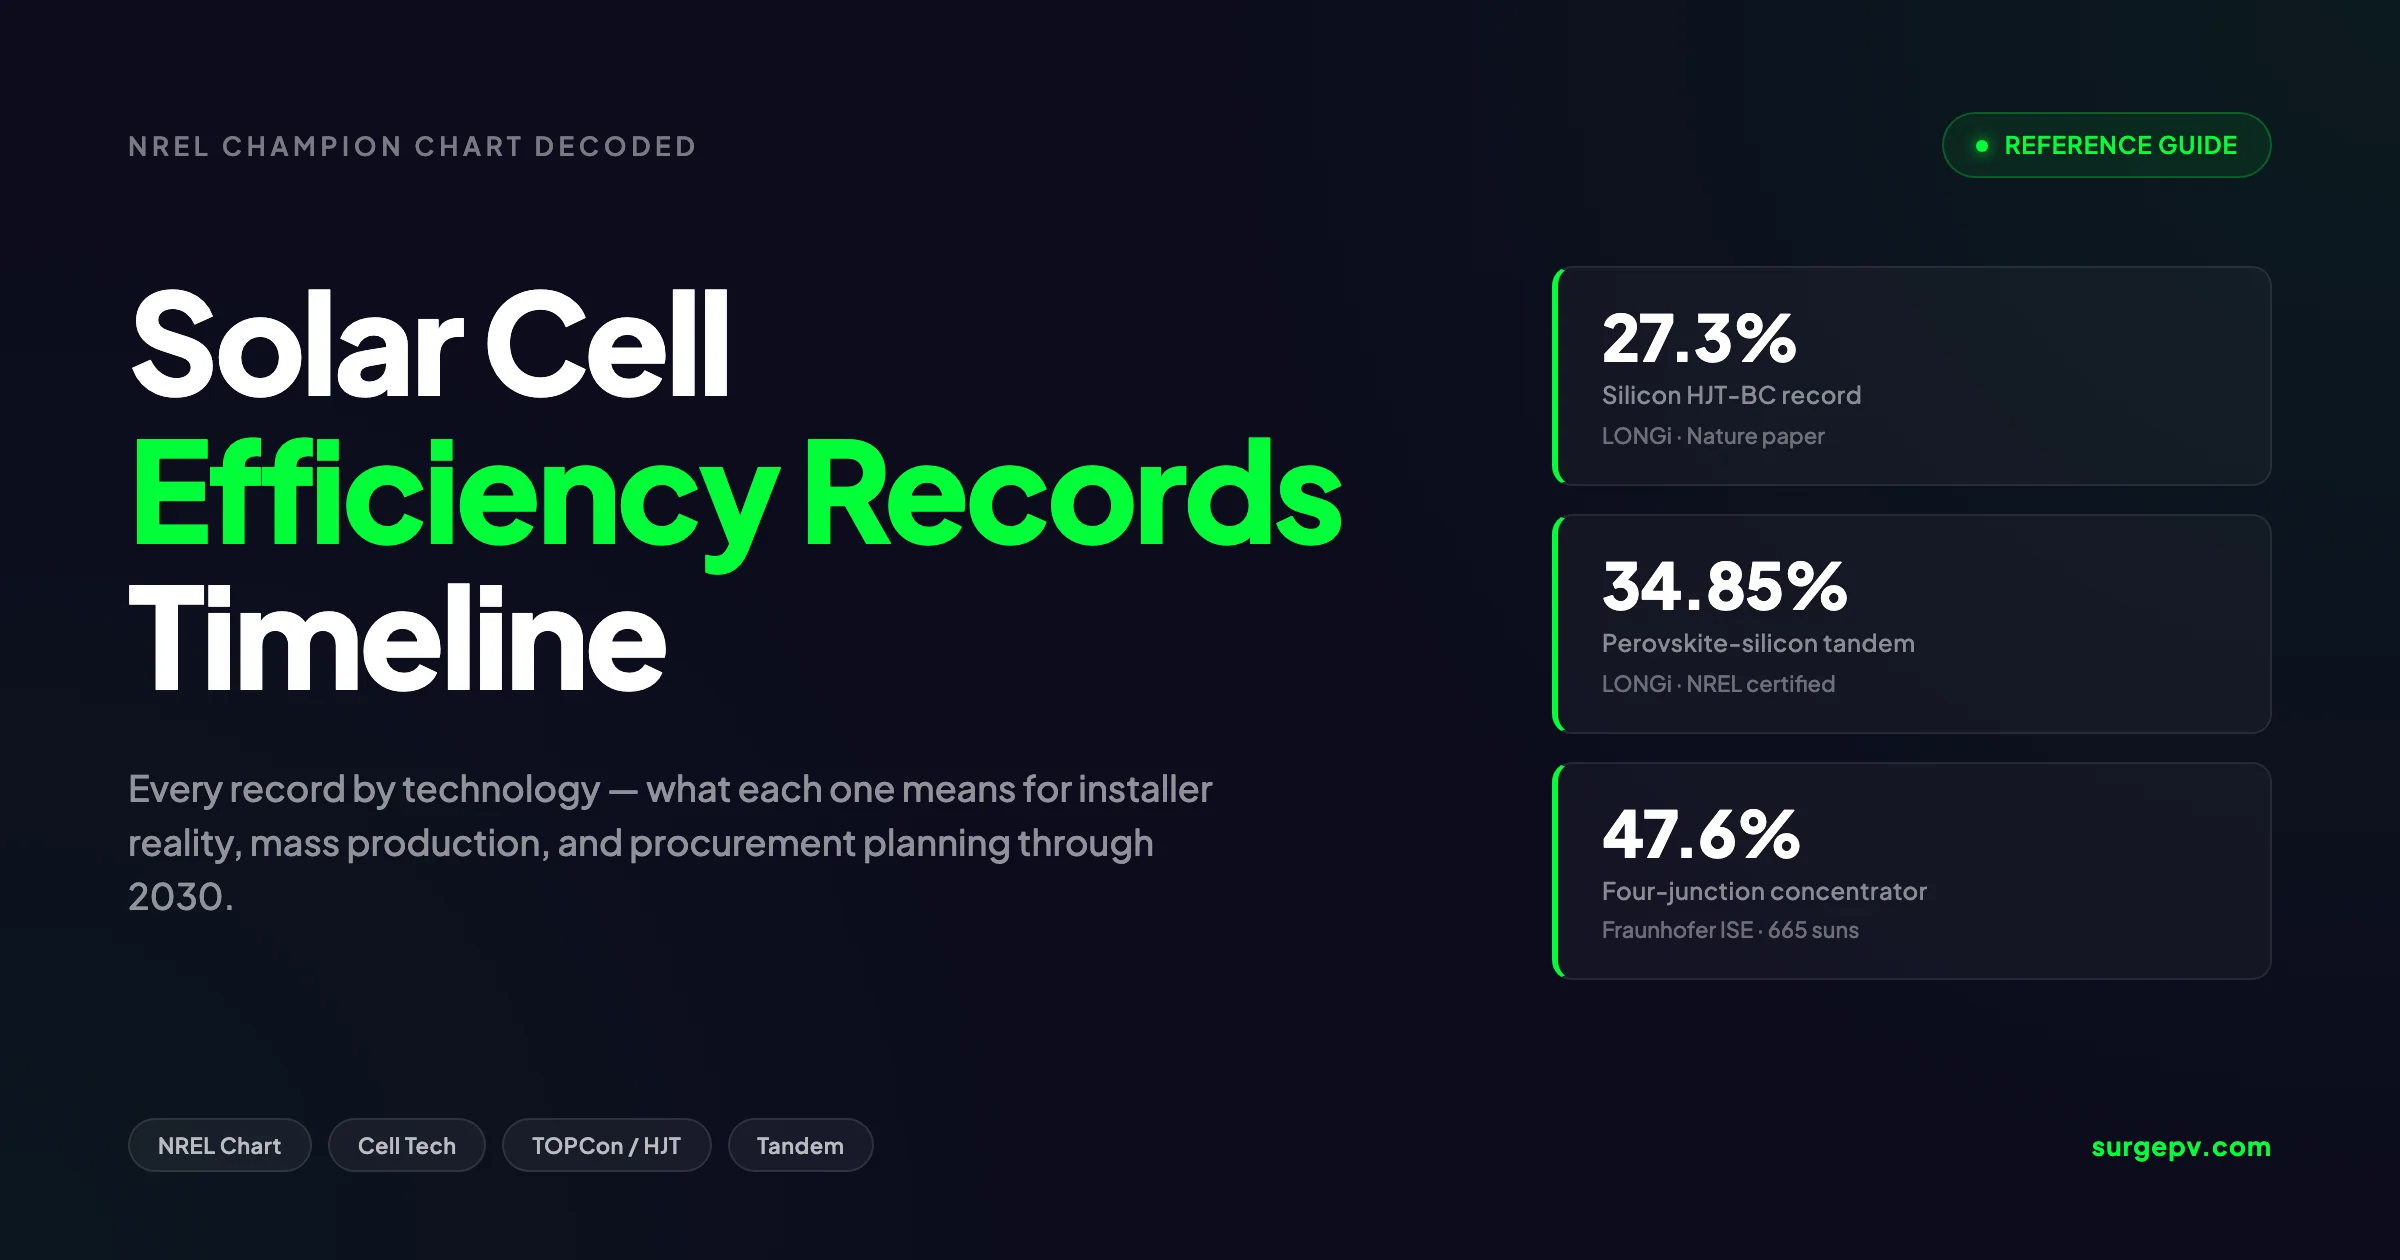
On 18 April 2025, LONGi shattered a number that the solar industry treated as untouchable for 64 years. Their perovskite-silicon tandem cell measured 34.85% conversion efficiency, certified by the US National Renewable Energy Laboratory. That figure crosses the Shockley-Queisser limit of 33.7%, the theoretical ceiling published by Bell Labs physicists William Shockley and Hans Queisser in 1961.
Solar cell efficiency has grown from 6% (Bell Labs, 1954) to 47.6% (NREL, six-junction concentrator, 2020). Commercial silicon panels reached 23.2% (Jinko Tiger Neo, 2025). Perovskite-silicon tandems hit 33.9% in 2024. The theoretical Shockley-Queisser limit for single-junction silicon is 33.7%.
For installers, this matters less as physics trivia and more as a procurement signal. Record cells today predict factory floors in five to seven years. If you are quoting commercial projects out to 2030, the technology mix on the NREL chart is your supply roadmap.
This guide decodes the NREL Best Research-Cell Efficiency Chart for working installers. We cover every record by technology, the gap between records and mass production, and what to specify in 2026 versus what to wait for. Use this as a permanent reference and build it into your solar design software workflow when scoping high-energy-density sites.
TL;DR — Solar Cell Efficiency Records 2026
The current research-cell record is 47.6% (Fraunhofer ISE, four-junction concentrator at 665 suns). The flat-plate record is 34.85% (LONGi, perovskite-silicon tandem). The best silicon-only record is 27.81% (LONGi, HIBC). Mass-production cells trail records by 4 to 7 percentage points. TOPCon dominates 2026 production at 25 to 26% cell efficiency. Tandem modules enter commercial supply in 2027.
What this guide covers:
- How to read the NREL Champion Cell Chart in 60 seconds
- The Shockley-Queisser limit and why tandems break it
- Full timeline of records by technology family (silicon, thin-film, perovskite, multi-junction)
- The 2026 mass-production efficiency ladder
- The cell-to-module efficiency gap and how installers should reason about it
- What records mislead installers about
- 2026 to 2030 roadmap for procurement planning
Latest Updates: Solar Cell Efficiency Records 2026
The NREL chart was revised on 19 March 2026, and several records moved in the last 18 months. Here is the current state of the leaderboard.
| Technology | Record Efficiency | Holder | Date | Source |
|---|---|---|---|---|
| Four-junction concentrator (III-V) | 47.6% | Fraunhofer ISE | May 2022 | Confirmed by Fraunhofer ISE CalLab |
| Perovskite-silicon tandem (2-terminal) | 34.85% | LONGi | Apr 2025 | NREL certified |
| Perovskite-CIGS tandem | 35.0% | HZB | 2025 | Verified on NREL chart |
| Single-junction GaAs | 29.1% | LG Electronics / Alta | 2018 | NREL chart |
| Silicon HIBC | 27.81% | LONGi | 2025 | ISFH certified |
| TOPCon (research cell) | 27.79% | JinkoSolar | Dec 2025 | TÜV SÜD certified |
| Silicon HJT-BC | 27.30% | LONGi | 2024 | Nature paper, ISFH certified |
| Single-junction perovskite | 27.3% | Soochow U / UNSW | 2025 | NREL chart |
| Heterojunction (HJT) | 26.81% | LONGi | 2022 | ISFH certified |
| CIGS (thin film) | 23.64% | First Solar / Uppsala | Feb 2024 | Fraunhofer ISE certified |
| CdTe (thin film) | 22.4% | First Solar | 2023 | NREL chart |
| Organic PV | 20.1% | Soochow U / UNSW | 2025 | NREL chart |
| Quantum dot | 18.1% | IoP/CAS | 2025 | NREL chart |
| Dye-sensitised | 13.0% | EPFL | 2023 | NREL chart |
Two records were broken in the 12 months before publication. Both came from LONGi, and both pushed the perovskite-silicon tandem ceiling. JinkoSolar took the pure-silicon TOPCon record from Trina Solar’s 26.58% to 27.79% in December 2025, narrowing the gap between TOPCon and HJT to roughly 0.5 percentage points.
What the NREL Champion Cell Chart Actually Shows
The NREL chart, originally maintained by the US National Renewable Energy Laboratory and now hosted under the National Laboratory of the Rockies domain, plots the highest confirmed cell efficiency for each major photovoltaic technology from 1976 to today. Updates happen approximately quarterly.
Three rules govern what makes the chart:
- Independent certification. Records must be measured by NREL, AIST (Japan), JRC-ESTI (Europe), Fraunhofer ISE CalLab, or ISFH (Germany). A manufacturer cannot self-certify onto the chart.
- Standard Test Conditions. Cells are measured at AM1.5G spectrum, 1000 W/m² irradiance, and 25°C cell temperature. Concentrator cells use the AM1.5D direct spectrum.
- Total cell area or aperture area. Efficiency is calculated against the full active surface. Records on 0.05 cm² lab devices are noted separately from records on industrial-size wafers. Also see: Germany solar subsidies. Also see: European Solar Tax Credits.
The chart uses six colour-coded technology families: multi-junction cells, single-junction GaAs, crystalline silicon, thin-film, emerging photovoltaics, and the newly added hybrid tandems category. Each technology has a champion line — the highest verified efficiency over time.
Pro Tip — Reading the Chart
Look at the slope of each line, not just the latest value. A flat line means a technology has stalled. A steep line means rapid lab progress, which usually predicts a manufacturing push within five years. Perovskite tandem lines are the steepest on the chart since 2018.
The chart does not show: durability, levelised cost, manufacturability, or temperature behaviour. Those are separate factors and partly explain why a 47.6% concentrator cell powers almost no rooftops in 2026.
The Shockley-Queisser Limit Explained
Before reviewing the records, you need the physics ceiling. In 1961, William Shockley and Hans Queisser, working at Shockley Semiconductor, calculated the maximum theoretical efficiency for a single-junction solar cell using detailed balance arguments. Their answer: 30% at a 1.1 eV bandgap, based on the 6000 K black-body solar spectrum approximation.
Modern recalculation using the AM1.5G global solar spectrum gives a refined limit of 33.7% at an optimal 1.34 eV bandgap. Three loss mechanisms drive the limit: For Global-specific compliance details, see Global net-metering-by-country. For Global-specific compliance details, see Global solar-permitting-speed-by-country.
- Sub-bandgap losses. Photons with energy below the cell’s bandgap pass through without generating an electron-hole pair. Silicon at 1.1 eV cannot absorb infrared photons below 1100 nm wavelength, which accounts for about 19% of the AM1.5G spectrum.
- Thermalisation losses. Photons with energy above the bandgap generate carriers that quickly thermalise to the band edge, dissipating the excess energy as heat. This accounts for roughly 33% of incident sunlight for silicon.
- Radiative recombination. Even an ideal cell loses some power to spontaneous photon emission from electron-hole recombination, set by detailed balance with the surroundings.
For silicon specifically, Auger recombination — a non-radiative process where one carrier transfers energy to another carrier rather than emitting a photon — drops the practical ceiling to 29.4%, calculated by Richter, Hermle, and Glunz at Fraunhofer ISE in 2013.
The record HJT-BC silicon cell at 27.3% sits 2.1 percentage points below this Auger-limited ceiling. The industry has roughly two percentage points of silicon improvement left before fundamental physics blocks further gains.
How tandems break the limit
A two-junction tandem with bandgaps of 1.7 eV (top, perovskite) and 1.1 eV (bottom, silicon) has a theoretical limit near 42 to 43% at standard sunlight. A four-junction concentrator under 665 suns has a theoretical limit above 60%.
LONGi’s 34.85% tandem in April 2025 became the first flat-plate, single-cell device certified above the single-junction S-Q limit. That milestone, more than the absolute number, is why the cell-tech world reorganised in 2024 to 2025.
Crystalline Silicon Records: The Workhorse Timeline
Crystalline silicon dominates 95% of all module shipments in 2026. Within silicon, four sub-architectures matter: PERC, TOPCon, HJT, and IBC/BC.
Silicon record timeline
| Year | Record | Architecture | Holder |
|---|---|---|---|
| 2014 | 25.6% | IBC | Panasonic |
| 2017 | 26.7% | HJT-IBC | Kaneka |
| 2022 | 26.81% | HJT | LONGi |
| 2023 | 26.81% | TOPCon | LONGi |
| Apr 2024 | 27.09% | HPBC (Hybrid Passivated Back Contact) | LONGi |
| Nov 2024 | 27.30% | HJT-BC (back contact) | LONGi |
| Dec 2025 | 27.79% | TOPCon | JinkoSolar |
| 2025 | 27.81% | HIBC (Hybrid Interdigitated Back Contact) | LONGi |
The Kaneka record at 26.7% held for five years from 2017 to 2022. Since 2022, LONGi has broken the silicon record at least eight times. JinkoSolar’s December 2025 entry shows TOPCon has more headroom than the industry assumed two years ago.
What each silicon architecture does
PERC (Passivated Emitter and Rear Cell) — The mainstream technology from 2015 to 2023. A dielectric layer on the rear surface reflects light back into the cell. Mass production: 23 to 23.5% cell efficiency. Theoretical ceiling: ~24%.
TOPCon (Tunnel Oxide Passivated Contact) — N-type silicon with a thin tunnel oxide and doped polysilicon layer that reduces recombination at the rear contact. Mass production: 25 to 26% cell efficiency in 2026. Took 60% of new module capacity by end of 2026.
HJT (Heterojunction with Intrinsic Thin-layer) — Amorphous silicon passivation layers on both sides of a c-Si wafer. Lower temperature coefficient (-0.24%/°C) and better bifaciality than TOPCon. Mass production: 25.5 to 26% cell efficiency. Premium-priced. For more on this topic, see Bifacial Solar Panel Design Guide.
IBC / BC (Interdigitated Back Contact) — All contacts move to the rear. No front-side metallisation shading. Higher efficiency but harder to manufacture. LONGi’s HPBC is the commercial variant. Mass production: 25.5 to 26.5% cell efficiency. Shadow analysis software identifies shading issues before installation.
Key Takeaway
Silicon technology in 2026 sits 1.5 to 2 percentage points below its Auger-limited ceiling of 29.4%. The remaining headroom is real but expensive. Each 0.1 percentage point of cell gain now requires major process and equipment changes, which is why module manufacturers have shifted research budgets to perovskite tandems instead of pushing silicon higher.
When designing rooftop systems with solar design software, the practical implication is that the choice between TOPCon and HJT in 2026 represents roughly 0.5 to 1 percentage point of module efficiency difference, but HJT delivers 1.5 to 3% higher annual yield in hot climates due to its temperature coefficient. The choice is climate-driven, not nameplate-driven.
Thin-Film Records: CdTe and CIGS
Thin-film technology represents about 4% of global shipments in 2026, dominated by First Solar’s CdTe in utility-scale US projects.
CdTe (Cadmium Telluride) — First Solar
CdTe efficiency has improved in nine documented updates since 2011. The cell record sits at 22.4% in 2026. First Solar’s commercial Series 7 modules reach approximately 19.7% module efficiency at the time of writing.
The 1.5 eV bandgap of CdTe is close to the optimum for single-junction terrestrial cells. The theoretical ceiling for CdTe is 32 to 33%, leaving more than 10 percentage points of theoretical headroom. In practice, the rate of progress has slowed since 2017.
Strengths: Best temperature coefficient on the market (-0.28%/°C), lowest energy payback time of any silicon or thin-film technology, manufactured in Ohio for ITC bonus credit eligibility. Used by commercial solar installers and utility-scale developers for projects with low albedo and high ambient temperatures.
CIGS (Copper Indium Gallium Selenide)
CIGS held a stagnant 23.35% record from 2019 (Solar Frontier) until February 2024, when First Solar’s Uppsala unit, in collaboration with Uppsala University, published a 23.64% certified result in Nature Energy. The breakthrough used a silver-alloyed absorber, hockey-stick gallium grading, and rubidium fluoride post-deposition treatment.
Commercial CIGS modules from the few remaining manufacturers (mainly Avancis and Solar Frontier) reach 16 to 18% module efficiency. The technology dominates BIPV (building-integrated PV) applications because of its uniform black appearance and flexibility on curved substrates.
| Thin-film record | Year | Holder | Mass-production module efficiency |
|---|---|---|---|
| CdTe | 22.4% (2023) | First Solar | ~19.7% (Series 7) |
| CIGS | 23.64% (2024) | First Solar / Uppsala | ~17.5% (Avancis) |
| Amorphous Si | 14.0% (2009) | Oerlikon | ~10% (legacy) |
Perovskite Records: The Steepest Curve on the Chart
Perovskite solar cells, first demonstrated at 3.8% efficiency in 2009 by Tsutomu Miyasaka’s group, have climbed to 27.3% in 2025 — the fastest efficiency rise of any PV technology. The slope of the perovskite line on the NREL chart is steeper than crystalline silicon was during its first 40 years.
Single-junction perovskite timeline
| Year | Record | Holder |
|---|---|---|
| 2009 | 3.8% | Miyasaka (Toin University) |
| 2014 | 17.9% | KRICT |
| 2019 | 25.2% | KRICT |
| 2022 | 25.7% | UNIST |
| 2023 | 26.1% | NREL |
| 2024 | 26.7% | NREL |
| 2025 | 27.3% | Soochow U / UNSW |
The theoretical limit for a 1.55 eV perovskite single-junction cell is approximately 31%. The technology sits 3.7 percentage points below its ceiling, with roughly two-thirds of the headroom remaining.
Perovskite stability — the missing ratio
Cell efficiency tables do not record durability. Most certified perovskite cells degrade more than 20% within 1000 hours of accelerated testing. The IEC 61215 standard for silicon modules requires less than 5% degradation after roughly 25 years of equivalent stress. No single-junction perovskite has passed full IEC 61215 testing as of 2026.
This stability problem, not efficiency, is why pure perovskite panels are not on the commercial solar procurement menu for installers in 2026. Every major commercial perovskite product (Oxford PV, Caelux, Tandem PV, Swift Solar) builds tandems on silicon rather than pure perovskite modules.
Tandem Records: Where the Industry Is Heading
The tandem category exploded between 2018 and 2025. The architecture stacks a high-bandgap perovskite top cell over a low-bandgap silicon (or CIGS) bottom cell. Each subcell harvests a different portion of the solar spectrum, breaking the single-junction Shockley-Queisser limit.
Perovskite-silicon tandem timeline
| Year | Record | Holder | Notes |
|---|---|---|---|
| 2018 | 25.2% | Oxford PV | First commercial-targeted tandem |
| 2020 | 29.15% | HZB (Helmholtz Berlin) | First above 29% |
| 2022 | 31.25% | EPFL/CSEM | First above 31% |
| 2023 | 33.9% | LONGi | First above S-Q limit on small area |
| Jun 2024 | 34.6% | LONGi | 2 V open circuit voltage |
| Apr 2025 | 34.85% | LONGi | NREL certified |
| Nov 2025 | 33.35% | LONGi | Flexible substrate, 1 cm² |
| Mar 2026 | 36.1% (provisional) | Fraunhofer ISE / AMOLF | NREL chart 2026 entry |
LONGi alone broke the perovskite-silicon tandem record at least four times in 18 months. The pace reflects both research velocity and a deep capital pool aimed at commercialisation. Trina Solar has partnered with Oxford PV to industrialise tandems and has demonstrated a 30.6% efficient shingled tandem module — the first commercial-scale tandem above 30%.
Other tandem architectures
| Tandem type | Record | Holder |
|---|---|---|
| Perovskite-perovskite (all-perovskite) | 28.7% | Nanjing U / Renshine |
| Perovskite-CIGS | 35.0% | HZB / Empa |
| Perovskite-organic | 26.3% | UCLA |
| GaInP-Si | 32.5% | NREL |
The all-perovskite tandem is interesting because it sidesteps silicon’s manufacturing complexity entirely. The architecture remains laboratory-only because the narrow-bandgap perovskite bottom cell is even less stable than its wide-bandgap counterpart.
Pro Tip — Tandem Watch List for Installers
Oxford PV’s commercial tandem panel reached 26.9% module efficiency in 2024 and entered limited US residential supply in 2025. LONGi expects mass production tandems at 28 to 30% module efficiency by 2028. Add tandems to your spec sheets in 2027 for projects commissioning in 2028 and beyond, especially space-constrained commercial roofs where panel area is the binding constraint.
Multi-Junction and Concentrator Records
The Fraunhofer ISE four-junction concentrator cell at 47.6% efficiency (measured at 665 suns) remains the highest-efficiency solar cell ever built. The cell uses GaInP, AlGaAs, GaInAsP, and GaInAs subcells in a wafer-bonded stack. The architecture costs hundreds of times more per watt than silicon and powers satellites, not rooftops.
Why concentrator records do not appear on rooftops
Concentrator photovoltaic (CPV) systems use lenses or mirrors to focus sunlight 500 to 1000 times onto small high-efficiency cells. The architecture requires:
- Dual-axis tracking (every minute, sub-degree accuracy)
- Direct beam sunlight only (no diffuse light contribution)
- Low DNI losses, limiting deployment to high-DNI deserts
- Cooling for the concentrated cells
Globally, CPV represents less than 0.1% of installed capacity in 2026, down from a 2012 peak of about 350 MW. The 47.6% record matters as a physics demonstration, not as a procurement option.
| Multi-junction record | Year | Configuration |
|---|---|---|
| Four-junction concentrator | 47.6% | Fraunhofer ISE, 665 suns |
| Six-junction concentrator | 47.1% | NREL, 143 suns |
| Six-junction one-sun | 39.5% | NREL |
| Triple-junction one-sun (III-V) | 37.9% | Sharp |
| GaAs single-junction | 29.1% | LG / Alta Devices |
GaAs (gallium arsenide) single-junction cells at 29.1% remain the highest-efficiency single-junction PV ever built. The material is too expensive for terrestrial use but dominates space solar and high-altitude long-endurance aircraft.
Mass Production vs Record: The 4 to 7 Percentage Point Gap
This is the most important section for working installers. The headline record is not what arrives at your warehouse. There are three distinct efficiency tiers, and the gap between them tells you when a technology becomes specifiable.
The three tiers
- Record cell. Best lab device, often under 10 cm². Independent certification. Examples: 27.3% HJT-BC, 34.85% tandem.
- Champion mass-production cell. Best wafer-scale cell off a real production line, typically M10 (~182 mm) or G12 (~210 mm). Examples in 2026: 26.66% industrial TOPCon (Jinko-CAS, Nature Energy Feb 2026), 26.6% HJT (LONGi).
- Average production cell. Median efficiency of all cells leaving a manufacturer’s binning. Examples in 2026: 25.4% TOPCon, 25.0% HJT, 23.5% PERC.
The gap from record to average production for any mature silicon technology is typically 1.5 to 2 percentage points. For an immature technology like tandems, the gap is 6 to 8 percentage points and shrinking.
2026 mass production efficiency ladder
| Technology | Record cell | Mass production cell | Mass production module |
|---|---|---|---|
| PERC | 24.5% | 23.3% | 21.0% (Tier 1 mono) |
| TOPCon | 27.79% | 25.4% | 22.5–24.0% |
| HJT | 27.30% | 25.5% | 23.0–24.5% |
| HPBC / BC | 27.81% | 26.0% | 23.5–25.0% |
| Tandem (perovskite-Si) | 34.85% | ~27% (limited) | ~26.9% (Oxford PV) |
| CdTe | 22.4% | 19.0% | 19.7% (First Solar S7) |
Stop guessing which panel to spec on your next bid
SurgePV pulls live module datasheets, temperature coefficients, and bifaciality into a single design view. Compare TOPCon, HJT, and BC modules on actual annual yield, not nameplate efficiency.
Book a DemoNo commitment required · 20 minutes · Live project walkthrough
For a direct comparison, see Arka 360 vs SurgePV.
The Cell-to-Module Efficiency Gap
Cell records measure one tiny device. Modules contain 60 to 144 cells plus glass, encapsulant, ribbons, frame, junction box, and gaps. Putting cells into modules costs efficiency. The industry calls the loss the cell-to-module (CTM) ratio.
What drives CTM loss
Four mechanisms account for 1 to 3 percentage points of CTM efficiency loss in 2026:
| Loss mechanism | Magnitude | Description |
|---|---|---|
| Geometric (inactive area) | 0.5 to 2% | Cell gaps, frame border, junction box footprint |
| Resistive (ribbons, busbars) | 0.3 to 0.7% | I²R losses in interconnections |
| Optical (reflection, absorption) | 0.4 to 1.0% | Glass reflection, EVA absorption, AR coating gain |
| Mismatch (cell binning) | 0.3 to 1.0% | Lowest cell sets module current |
Modern designs (half-cut cells, multi-busbar, shingled cells, anti-reflective glass) have compressed CTM losses from 8 to 10% in 2010 to 1 to 3% in 2026. Some shingled designs achieve CTM ratios above 100%, where the module produces more power than the sum of its cells thanks to coupling gains in the encapsulant.
Worked example
A 27% record HJT cell becomes:
- 25.5% champion mass-production cell (LONGi’s published champion HJT line)
- 22.5% module after CTM losses on a 144-half-cell M10 layout
- 21.0% AC system efficiency after inverter losses (~3 to 4%)
- 18 to 20% effective annual yield at site after temperature, soiling, and shading
A 34.85% tandem record cell follows the same arithmetic and lands at roughly 27% module efficiency in production, which matches Oxford PV’s commercial module datasheet.
When you size systems in solar design platform, the relevant number is module efficiency at STC plus the temperature coefficient at your site, not the cell record.
What the NREL Chart Misleads Installers About
Records sell newspapers. The chart hides several details that matter more than peak efficiency for working installers.
1. Records ignore degradation
Most records measure power output on day zero. They say nothing about how the cell performs after one year, five years, or 25 years. Silicon TOPCon and HJT degrade 0.4 to 0.5% per year. Perovskite single-junction cells, in current laboratory form, lose 20% in months. A 27% silicon cell and a 27% perovskite cell are not equivalent assets.
2. Records ignore temperature
NREL records sit at 25°C cell temperature. Real rooftop cells in summer reach 55 to 70°C. HJT loses 0.24% per degree above 25°C. PERC loses 0.34% per degree. At 60°C ambient cell temperature, a nominal 22% HJT module outperforms a nominal 22% PERC module by roughly 4% in instantaneous output. The chart shows neither value.
3. Records ignore bifaciality
A bifacial HJT cell at 26% front efficiency produces 5 to 25% additional output from albedo, depending on ground reflectance and mounting height. Bifacial gain is usually invisible on the chart, which records monofacial illumination.
4. Records ignore cost per watt
The 47.6% Fraunhofer concentrator cell costs roughly $300 per watt at the cell level. A mainstream TOPCon module in 2026 costs about $0.10 per watt at the cell level. Efficiency without cost context is a marketing metric, not a procurement metric.
5. Records use cells far smaller than commercial wafers
Many perovskite records use 1 cm² or smaller devices. M10 silicon wafers are 33000 mm² (~330 cm²). Scaling a perovskite cell from 1 cm² to 330 cm² loses 2 to 5 percentage points of efficiency due to current collection, uniformity, and edge effects. The chart marks small-area records separately, but the popular press rarely does.
6. Records do not survive third-party field testing
Independent field testing by RETC, PVEL, and DNV regularly finds 5 to 12% performance gaps between datasheet and field for new technology classes. The gap closes after three to five years of manufacturing maturity. Installers who specify a brand-new architecture immediately after the record is set typically eat the gap.
Key Takeaway
Use the NREL chart to predict procurement availability in three to five years. Use bankability lists (PV ModuleTech, BloombergNEF Tier 1, Kiwa-PVEL Top Performer) to spec what to install today. The two answers are different.
Translating Records into Procurement: A 2026 Decision Framework
Working installers face a procurement question at every quote: which cell architecture should the module on this site use? Here is a framework that maps record-level data onto installer-level decisions.
Step 1 — Match cell technology to climate
| Climate | Recommended technology | Why |
|---|---|---|
| Hot (peak ambient >35°C) | HJT or HPBC | Temperature coefficient -0.24 to -0.28%/°C |
| Temperate / cool | TOPCon or PERC | Cost-efficiency optimum |
| High albedo (snow, sand, concrete) | Bifacial HJT or bifacial TOPCon | Captures rear-side gain |
| High humidity / coastal | TOPCon with frameless or anti-PID rated | Better PID resistance |
| Utility scale low-DNI | First Solar CdTe Series 7 | ITC bonus + temperature coefficient |
| Space-constrained commercial roof | Tandem (from 2027) or HPBC today | Maximum W/m² |
Step 2 — Match module efficiency to system constraint
If roof space is the binding constraint (typical for commercial flat roofs and constrained residential), pay the premium for HPBC or tandem. If cost per watt is the binding constraint (typical for ground-mount and utility), pay for TOPCon in volume.
You can model this trade-off in any modern cloud solar design tool by comparing yield-per-roof-area at the project level instead of cost-per-watt at the cell level.
Step 3 — Match degradation curve to project tenor
| Project tenor | Primary specification |
|---|---|
| 5 to 10 years (commercial PPA) | First-year degradation under 1.5%, linear thereafter |
| 15 to 25 years (residential, utility) | Cumulative degradation under 12% over 25 years |
| 25 to 35 years (long-term IPP) | Cumulative degradation under 15% over 30 years, frame durability rated |
HJT and TOPCon datasheets in 2026 typically guarantee 1% first-year degradation and 0.4% annual thereafter for 25 to 30 years, ending at 87 to 89.4% of nameplate. PERC typically guarantees 80 to 84% at year 25.
Step 4 — Validate against independent field data
Cross-check the datasheet against PVEL’s most recent Module Reliability Scorecard and RETC’s Module Index. Field performance data from large fleets is the only meaningful test for a new architecture.
Roadmap to 2030: What to Spec When
Three forces will reshape the procurement menu between 2026 and 2030.
1. TOPCon plateaus, BC takes premium share
JinkoSolar, JA Solar, and Trina have publicly stated TOPCon will saturate at 26.5 to 27% mass production cell efficiency. The architecture has 12 to 18 months of incremental gain left.
LONGi and Aiko are accelerating BC (back contact) ramp. By 2028, BC will hold 25 to 30% of new module shipments at a premium price for the highest W/m² requirements. The solar proposal software market will need to handle three to four module architectures per quote by 2028.
2. Tandem modules enter commercial supply 2027 to 2029
Oxford PV ships limited residential volumes in 2026. LONGi’s first tandem mass production line is scheduled for 2027. Trina, JinkoSolar, and Hanwha Q CELLS have all announced tandem pilot lines for 2027 to 2028. Expect commercial tandem modules at 26 to 28% module efficiency by 2027 and 29 to 30% by 2030.
The transition will follow the same shape as PERC-to-TOPCon: premium pricing on early volume, rapid price decline as volume scales, and a 3 to 5 year crossover period when both architectures coexist on installer spec sheets.
3. Perovskite single-junction stalls
Single-junction perovskite will continue to set lab records but will not reach commercial scale in this decade. Stability remains unsolved. The industry capital has moved to tandems.
Procurement timeline by year
| Year | What to spec |
|---|---|
| 2026 | TOPCon (mainstream), HJT (hot climates), HPBC (premium residential) |
| 2027 | Add tandem to high-end residential and commercial quotes |
| 2028 | Tandem capacity reaches 50 to 100 GW globally |
| 2030 | Tandem at price parity with premium silicon; default architecture for premium tier |
Real-World ROI Implications
Cell efficiency improvements translate directly into project economics on space-constrained sites. Three quick examples for European installers.
Example 1 — Residential 50 m² roof, Berlin
A 19% PERC module fills 50 m² with 9.5 kW. A 22.5% HJT module fits 11.25 kW on the same area. Annual yield at Berlin’s 1100 kWh/kWp specific yield: 10,450 kWh vs 12,375 kWh. With self-consumption + feed-in at €0.30/kWh average effective value, the HJT system generates €577 more per year. Over 25 years, the additional revenue exceeds €14,000. Read more about Community Solar Projects Germany. Read Community Solar Business Model for a complete walkthrough.
For more detailed financial modelling on residential projects, see our solar panel ROI Italy analysis and the European solar incentives guide. Also see: solar panel ROI in Italy.
Example 2 — Commercial flat roof 2000 m², Milan
A 19% PERC module fills the roof with 380 kW. A 23.5% HPBC module fits 470 kW on the same area. At Milan’s 1300 kWh/kWp, the HPBC system generates 117 MWh more per year. With behind-the-meter consumption at €0.18/kWh, the additional savings are €21,060 per year. The HPBC premium of roughly €0.06/W on the 90 kW differential is recovered in less than three years. For the latest details on Italy, see Commercial Rooftop Solar Case Study Italy.
Example 3 — Utility ground mount 50 MW, southern Spain
A 22% TOPCon module covers 45 hectares for 50 MW. A 23% HJT module covers 43 hectares for the same 50 MW. The temperature coefficient difference (-0.28 vs -0.34%/°C) yields roughly 2.5% higher annual specific yield at Spanish summer cell temperatures. On 50 MW at €0.05/kWh PPA, the difference is €175,000 per year. The HJT premium is recovered in five to seven years on a 25-year asset. Read more about Hotel Solar + EV Charging Case Study.
Authoritative Sources and Further Reading
Every number in this guide is traceable to a primary source. The most useful canonical references for working installers:
- NREL Best Research-Cell Efficiency Chart — the master chart, updated quarterly
- Fraunhofer ISE Photovoltaics Report — annual deep dive on cells and modules
- Progress in Photovoltaics — Solar Cell Efficiency Tables — Martin Green’s quarterly publication, the academic record of record
- pv magazine — daily industry news on cell records
- PV-Tech — manufacturing and supply chain coverage
- PVEL Module Reliability Scorecard — third-party field test results
For the underlying physics, see the original 1961 paper: Shockley, W., & Queisser, H. J. (1961). Detailed balance limit of efficiency of p-n junction solar cells. For modern silicon limits, see Richter, Hermle, and Glunz at Fraunhofer ISE on Auger-limited efficiency.
Conclusion: Three Action Items for Installers
- Bookmark the NREL chart and check it quarterly. New records signal which technologies will be on factory floors in 2028 to 2030. Use them to predict supply, not to spec today’s quotes.
- Spec by climate and project tenor, not by record headline. A 22.5% HJT module beats a 23% PERC module in any hot climate. A 27% record is irrelevant to a 2026 quote.
- Add tandems to your 2027 spec list. Oxford PV is shipping now. LONGi mass production starts 2027. Whichever installer trains on tandem solar proposal software workflows first will own the high-end commercial market through 2030.
The NREL chart is a 50-year record of incremental physics breakthroughs. The slope from 2018 to 2025 is the steepest it has ever been. For working installers, that means the procurement menu in 2030 will look fundamentally different from 2026 — and the time to start tracking the curve is now.
Frequently Asked Questions
What is the highest solar cell efficiency record in 2026?
The highest single-cell efficiency in 2026 is 47.6%, held by Fraunhofer ISE for a four-junction III-V concentrator cell measured at 665 suns. For flat-plate (non-concentrator) cells, the record is 34.85% held by LONGi for a perovskite-silicon tandem. The highest commercial silicon record is 27.81% by LONGi for its HIBC architecture.
What is the theoretical maximum efficiency of a silicon solar cell?
The Shockley-Queisser limit caps single-junction silicon at about 29.4% once Auger recombination is included, with 33.7% as the absolute theoretical maximum for any single-junction cell at the optimum 1.34 eV bandgap. Silicon’s 1.1 eV bandgap places its practical ceiling near 29%. Tandems break this limit by stacking different bandgap materials.
What is the difference between cell efficiency and module efficiency?
Cell efficiency is measured on a small research device, typically 1 cm² to 4 cm². Module efficiency averages the cell area plus inactive gaps, glass, encapsulant, and backsheet across the full module aperture. Modern cell-to-module losses run 1 to 3 percent, so a 27% cell typically yields a 23 to 24% module.
Why do solar cell records matter to installers?
Records signal what is technically possible. Mass production efficiency typically trails record cells by 4 to 7 percentage points and arrives 5 to 10 years later. Installers who track records can predict which modules will dominate 2027 to 2030 procurement and which technologies will still be undersized for high-energy-density commercial projects.
What is the Shockley-Queisser limit?
The Shockley-Queisser limit is the maximum theoretical efficiency for a single-junction solar cell. It was calculated in 1961 at 30% for a 1.1 eV bandgap, later refined to 33.7% at the optimum 1.34 eV bandgap. The limit accounts for thermalisation losses, sub-bandgap photon losses, and radiative recombination. Tandem and multi-junction cells exceed it by absorbing different parts of the spectrum.
Will perovskite solar panels replace silicon?
Perovskite single-junction cells have reached 26.7% research efficiency but face severe stability challenges, with most prototypes degrading within months under field conditions. The mainstream path is perovskite-on-silicon tandems, which combine silicon’s durability with perovskite’s high-energy photon harvesting. Oxford PV and LONGi expect mass production tandems to reach 28 to 30% module efficiency by 2028.
What efficiency can I expect from a 2026 commercial solar panel?
In 2026, premium back-contact modules approach 25% efficiency, mainstream TOPCon modules sit between 22.5 and 24%, HJT modules cluster around 23 to 24.5%, and budget PERC modules deliver 20.5 to 22%. Thin-film CdTe modules from First Solar reach 19.7% with strong temperature performance. Real-world annual yield depends more on degradation curves and temperature coefficient than peak efficiency.


