Nine out of ten solar startup business plans die in the first investor meeting. Not because the founder is wrong about the market, but because the financial model has a hole, the unit economics do not work, or the capital ask is disconnected from the milestones. The US installed 43.2 GW of solar in 2025, according to SEIA’s 2025 Year in Review, and another 43 GW is forecast for 2026. That is a $50 billion installation market every year. The opportunity is real. The challenge is turning that opportunity into a fundable plan. This guide gives you the exact template, the financial model structure, and the pitch deck format that solar founders use to raise capital in 2026.
Quick Answer
A solar business plan template is a structured document with 8 sections: executive summary, market analysis, services, marketing and sales, operations, management team, 5-year financial projections, and capital ask. Most successful solar plans run 25 to 40 pages, include a separate 12-slide pitch deck, and project EBITDA margins of 8 to 15 percent for installers by Year 3.
Key Takeaways
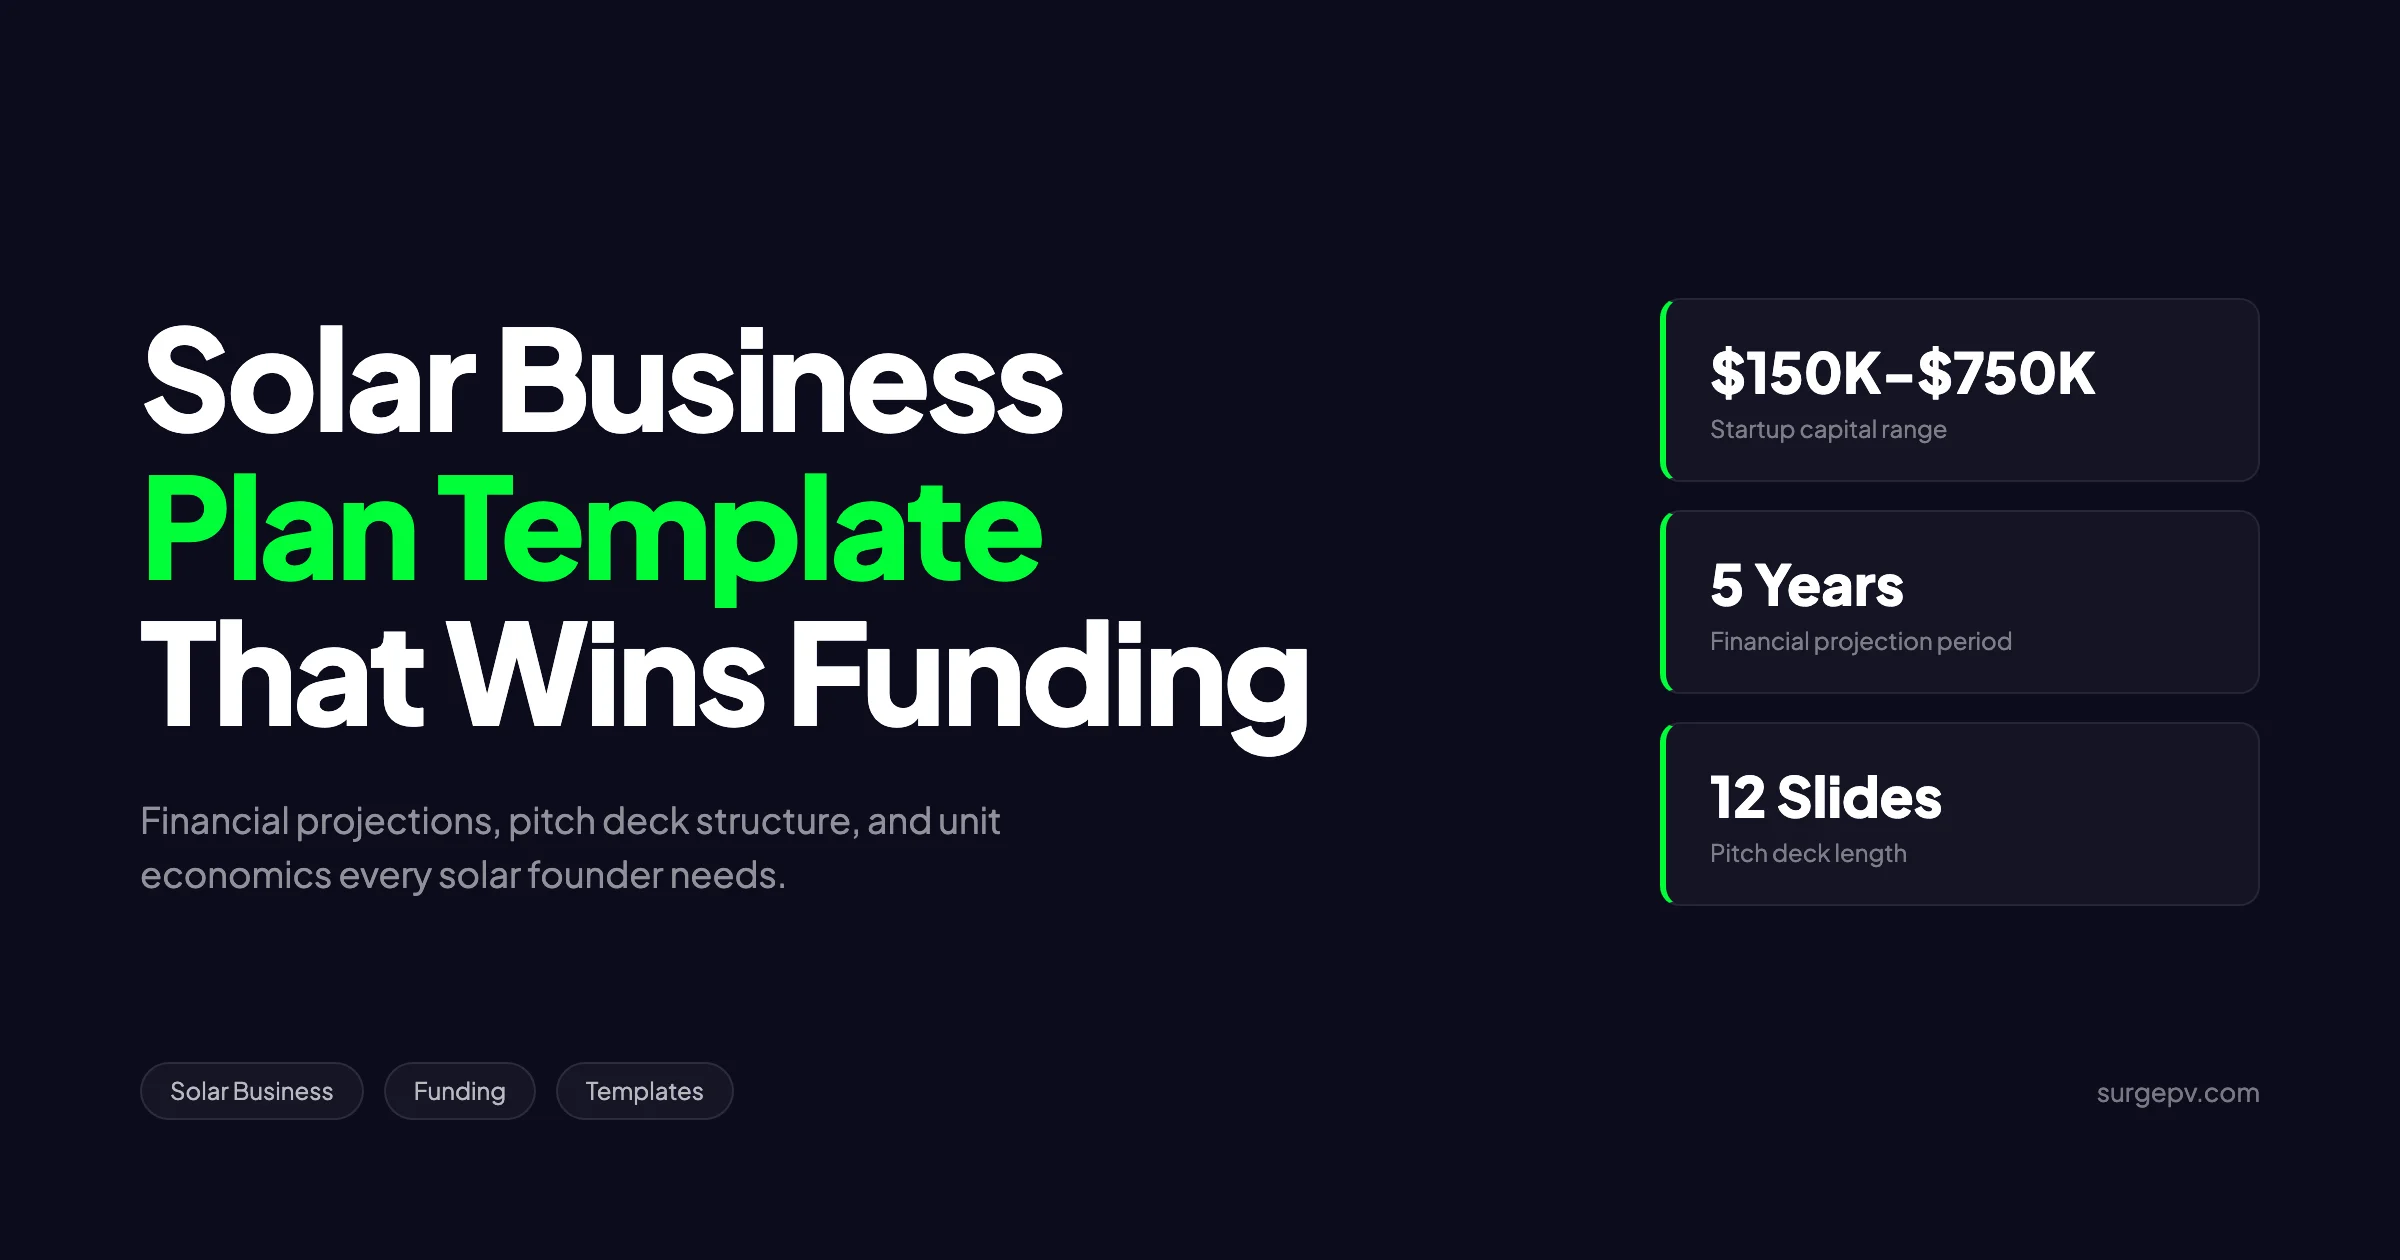
1. Solar founders need $150K to $750K in startup capital depending on residential vs. commercial focus.
2. The standard pitch deck is 12 slides: problem, solution, market, product, traction, business model, GTM, competition, team, financials, ask, and exit.
3. Target gross margin is 28 to 35 percent residential and 18 to 25 percent commercial.
4. Customer acquisition cost averages $1,200 to $2,500 per residential customer in 2026.
5. LTV-to-CAC ratio must exceed 3:1 to attract serious investors.
6. SBA 504 Green Loans cover up to $5.5 million per project for solar equipment and real estate.
In this guide you will learn:
- The exact 8-section structure of an investor-ready solar business plan
- A 5-year P&L template with sample numbers for a $2M Year 1 installer
- The 12-slide pitch deck investors expect in seed and Series A meetings
- Unit economics every solar founder must know before raising
- Typical funding rounds and dilution for solar startups in 2026
- The most common mistakes that kill solar business plans in diligence
- How to model revenue, COGS, and OpEx with realistic assumptions
Solar Business Plan Template: What It Includes
A solar business plan is a written document that defines your business model, market, operations, and financial path to profitability. Investors and lenders use it to decide whether to back you. You use it to align your team and track progress.
Most successful solar business plans share the same skeleton. The order changes, but the content does not.
The 8 core sections
- Executive summary (1 to 2 pages)
- Company description (1 page)
- Market analysis (3 to 5 pages)
- Services and operations (3 to 5 pages)
- Marketing and sales strategy (2 to 4 pages)
- Management team and organization (1 to 2 pages)
- Financial projections (5 to 8 pages)
- Capital ask and use of funds (1 to 2 pages)
Add an appendix with permits, licenses, insurance certificates, sample proposals, and reference customer letters. Total length lands at 25 to 40 pages.
Pro Tip
Write the financial model first, then write the narrative to match the numbers. Most founders do the opposite and end up with a story their model cannot support. Build the spreadsheet, stress-test it, then write the words.
A modern solar plan also includes a technology stack section. Investors want to see that you use solar design software like SurgePV instead of manual CAD work. They want to see CRM systems, e-signature tools, and a clear path to scale without doubling headcount. For a direct comparison, see Arka 360 vs SurgePV.
Executive Summary: The 1-Page Pitch That Opens Doors
The executive summary is the most important page in the entire plan. Most investors read it and decide whether to keep reading. Write it last, after every other section is complete.
A strong solar executive summary has 6 paragraphs:
- The hook: Open with a market stat and your company’s unique angle.
- The problem: What does the customer pain look like today?
- The solution: How does your business solve it?
- The market: Size, growth rate, and your target slice.
- The traction: Revenue, customers, pipeline, or LOIs to date.
- The ask: How much capital you need and what you will do with it.
Sample executive summary opening
“BrightPath Solar is a residential solar installer based in Phoenix, Arizona. We sell, design, and install rooftop solar systems for homeowners across Maricopa County. The Arizona residential solar market grew to 1.8 GW of installed capacity by year-end 2025, with 5.4 percent year-over-year growth despite the federal residential ITC expiration. BrightPath generated $2.1M in revenue in our first 18 months with a 31 percent gross margin. We are raising $1.2M in seed equity to expand to 3 trucks, hire 6 installers, and reach $7M in annual revenue by month 24.”
That is 105 words. Every sentence carries a number or a fact. No marketing fluff.
What Most Guides Miss
The executive summary is not a teaser. It is a complete miniature version of the entire plan. An investor should be able to make a yes/no/maybe decision from this single page. Include the capital ask, the use of funds, and the milestones. Do not save the punchline for slide 11.
Market Analysis Section: Sizing the Solar Opportunity in 2026
The market analysis proves three things: the market is large, the market is growing, and you can capture a defensible slice of it.
Sizing methodology
Use the TAM-SAM-SOM framework.
- TAM (Total Addressable Market): The entire US solar market. SEIA reported 43.2 GW installed in 2025 at an average price of $2.55/W for residential. That is a $43 billion installation market in 2025.
- SAM (Serviceable Available Market): Your geography and segment. A Phoenix-only residential installer’s SAM is the Arizona residential solar market, roughly $4.5 billion in 2025.
- SOM (Serviceable Obtainable Market): What you can realistically capture in 3 years. A new entrant might target 0.5 to 2 percent of SAM, or $22M to $90M in Phoenix.
Current US solar market data (cite these)
SEIA’s 2025 Year in Review reports the US installed 43.2 GW of solar capacity in 2025, a 14 percent decrease from 2024 but still 54 percent of all new electricity-generating capacity. Texas led with 11 GW. The residential segment ended 2025 virtually flat as installers rushed projects ahead of the Section 25D credit expiration.
Wood Mackenzie projects residential customer acquisition cost will rise from $0.60/W in 2025 to $0.84/W in 2026, a 40 percent jump driven by the ITC expiration and a contracting market. This single data point reshapes every CAC assumption in a 2026 business plan.
NREL’s 2024 Solar Installed Cost report finds soft costs account for 64 percent of total residential system cost. That includes customer acquisition, permitting, installation labor, sales tax, and overhead. Hardware is only 36 percent.
Segment breakdown to include
| Segment | 2025 US installs | Average system size | Average revenue per project |
|---|---|---|---|
| Residential | 5.2 GW | 8 kW | $20,000 to $35,000 |
| Commercial rooftop | 2.3 GW | 250 kW | $375,000 to $625,000 |
| Community solar | 1.0 GW | 3.5 MW | $5.2M to $7.8M |
| Utility-scale | 34.7 GW | 80 MW | $80M to $120M |
Source: SEIA Solar Market Insight 2025 Year in Review.
Pick one segment as your focus. Investors discount plans that try to serve every segment at once.
Services & Operations: Defining Your Business Model
This section answers a simple question. What do you sell, and how do you deliver it?
The 5 core solar business models
- Full-service installer: You sell, design, permit, install, and service the system. Highest margin per project, highest complexity.
- Sales and design only: You generate leads, design, and sell. You subcontract installation. Lower capex, lower margin per project.
- EPC for developers: You install for solar developers under contract. Lower CAC, lower margin, predictable pipeline.
- Solar-as-a-service: You finance and own the system, sell power via PPA or lease. Long payback, recurring revenue.
- O&M services: You service existing systems for performance fees. Recurring revenue, no install capex. See Solar Lead Generation Strategies for detailed guidance.
Most new solar companies start as full-service residential installers because the per-project economics are best for a small team. Learn more in our solar business profitability guide.
Operations narrative
Walk the investor through one complete project, from lead to commissioning. Use the 8-step workflow: For more on this topic, see Solar Sales Commission Structure.
- Lead intake from website, referral, or paid channel
- Phone qualification and remote site assessment
- In-home or virtual sales appointment with proposal
- Contract signature and 10 percent deposit
- Engineering design and permit submission
- Material procurement and crew scheduling
- Installation (1 to 3 days residential, 1 to 4 weeks commercial)
- Inspection, utility interconnection, and final payment
Show how long each step takes and which software you use. SurgePV’s solar design software handles steps 5 and 6, including shadow analysis software and engineering-grade solar proposals. Clara AI handles lead qualification.
Capex requirements for a 2-truck residential installer
| Line item | Cost (USD) | Notes |
|---|---|---|
| 2 work trucks with ladder racks | $80,000 | Used commercial vans, 2018 to 2022 model years |
| Installation tools and equipment | $25,000 | Drills, fall protection, conduit benders, meters |
| Design and CRM software (annual) | $12,000 | SurgePV, HubSpot, or equivalent |
| Office and warehouse lease (6 months) | $24,000 | 2,000 sq ft small commercial space |
| Initial materials inventory | $50,000 | Panels, racking, inverters for first 4 projects |
| Insurance and bonding (annual) | $18,000 | GL, workers comp, auto, surety bond |
| Licensing, permits, and incorporation | $8,000 | Contractor license, NABCEP exams, LLC fees |
| Marketing launch budget | $35,000 | Website, paid search, sample door hangers |
| Working capital reserve (3 months) | $180,000 | Payroll, fuel, rent, software, contingency |
| Total startup capital | $432,000 |
This is a mid-range figure. A truly lean subcontractor model can launch under $150,000. A 5-truck operation needs $750,000 to $1.2M.
Common Mistake
Most founders underestimate working capital. They focus on trucks and tools, then run out of cash at month 4 because customers pay 30 to 60 days after install, but payroll runs every 2 weeks. Always model 3 to 6 months of operating expenses as a separate cash reserve line.
Financial Projections: 5-Year Forecast Template
This is the section that decides funding. Investors and lenders read every line. Sloppy numbers kill deals.
Build 3 connected statements: P&L, cash flow, and balance sheet. Show monthly detail for Year 1 and annual detail for Years 2 through 5.
Sample 5-year P&L for a residential solar installer
| Line item | Year 1 | Year 2 | Year 3 | Year 4 | Year 5 |
|---|---|---|---|---|---|
| Installs completed | 65 | 145 | 240 | 360 | 480 |
| Average revenue per install | $28,000 | $29,000 | $30,000 | $31,000 | $32,000 |
| Revenue | $1,820,000 | $4,205,000 | $7,200,000 | $11,160,000 | $15,360,000 |
| COGS (panels, racking, inverters) | $836,000 | $1,892,000 | $3,168,000 | $4,800,000 | $6,451,000 |
| Installation labor (direct) | $382,000 | $841,000 | $1,368,000 | $2,009,000 | $2,611,000 |
| Gross profit | $602,000 | $1,472,000 | $2,664,000 | $4,351,000 | $6,298,000 |
| Gross margin % | 33.1% | 35.0% | 37.0% | 39.0% | 41.0% |
| Sales and marketing | $273,000 | $546,000 | $864,000 | $1,228,000 | $1,536,000 |
| G&A and admin | $195,000 | $336,000 | $504,000 | $703,000 | $922,000 |
| Software and tools | $42,000 | $78,000 | $115,000 | $145,000 | $170,000 |
| Insurance and licenses | $32,000 | $55,000 | $82,000 | $110,000 | $138,000 |
| EBITDA | $60,000 | $457,000 | $1,099,000 | $2,165,000 | $3,532,000 |
| EBITDA margin % | 3.3% | 10.9% | 15.3% | 19.4% | 23.0% |
These numbers reflect a focused residential installer in a tier-1 solar state with mature processes. Your numbers will vary by geography, segment, and team size. Use SurgePV’s generation and financial tool to validate per-project revenue and margin assumptions before locking the model.
Revenue build methodology
Do not pluck a revenue number out of the air. Build it from the bottom up:
- Start with monthly install capacity per crew
- Multiply by number of crews
- Multiply by 12 months
- Apply ramp factor for Year 1 (typically 40 to 60 percent capacity utilization)
- Multiply by average revenue per install
- Add growth factor for Years 2 through 5 (typically 50 to 100 percent in Year 2, declining to 30 to 50 percent by Year 5)
Show the assumptions clearly. Investors stress-test the inputs. If you cannot defend each input with a market data point, the whole model loses credibility.
Pro Tip
Build 3 scenarios in your model: conservative, base, and stretch. Use the conservative case for cash flow planning. Use the base case for the pitch. Use the stretch case to show upside. Investors trust founders who model downside risk.
COGS build methodology
For a residential 8 kW system, typical COGS at 2026 prices:
- Panels (8 kW at $0.28/W): $2,240
- Inverter (8 kW string or 24 microinverters): $2,400
- Racking and balance of system: $1,800
- Permit and interconnection fees: $800
- Direct installation labor (2 days, 3-person crew): $2,400
Total per-install COGS: $9,640. At $28,000 retail, that is a 65.6 percent COGS ratio and a 34.4 percent gross margin. Read more on cost composition in our solar installation cost breakdown.
Model your installer P&L in 30 minutes
SurgePV’s design and financial tools generate per-project revenue and COGS data you can drop straight into your business plan model.
Book a DemoNo commitment required · 20 minutes · Live walkthrough
Funding Pitch Deck: The 12 Slides Investors Expect
The pitch deck is the visual version of the business plan. Keep it to 12 slides for a seed round, 14 for a Series A.
The standard 12-slide structure
- Title slide: Company name, tagline, founder name, date.
- Problem: The pain point you solve, with a specific customer quote or stat.
- Solution: Your product or service in one sentence and one image.
- Market size: TAM, SAM, SOM with a single chart.
- Product: 2 to 4 screenshots or photos of what you actually do.
- Traction: Revenue, customers, contracts signed, pipeline value.
- Business model: How you make money. Unit economics in one box.
- Go-to-market: Marketing channels, sales process, CAC, payback.
- Competition: 2x2 matrix or feature table. Honest map of who you compete with.
- Team: Founder bios with relevant solar and finance experience.
- Financials: 5-year revenue and EBITDA chart plus key KPIs.
- The ask: How much you want, what valuation, how you will spend it.
Slide design rules
- One idea per slide
- Maximum 30 words on any slide
- 24-point minimum font size
- Use real numbers, not placeholder text
- Charts beat tables, tables beat paragraphs
- Match brand colors and typography
What goes on the ask slide
Spell out the round size, valuation, instrument, lead investor target, and use of funds. A clean example:
“We are raising $1.2M seed equity at a $5M pre-money valuation, structured as a SAFE with 20 percent discount and $6M cap. Lead investor target: solar-focused angel or family office. Use of funds: 40 percent crew expansion, 30 percent marketing, 20 percent working capital, 10 percent product and software.”
That is 56 words. Specific enough to start a real conversation.
Real-World Example
A Phoenix-based residential installer raised a $1.2M seed in Q3 2025 from 4 angels and one family office. The founders pitched 23 investors over 11 weeks. They closed in 14 weeks total. Key elements that worked: $2.1M in trailing revenue, 31 percent gross margin, 2,800-customer waitlist generated by a free shadow analysis tool, and an experienced operator from a national solar EPC as the co-founder.
Unit Economics: The Numbers Every Solar Founder Must Know
Unit economics is the single project view of your business. If unit economics do not work, the company does not work, regardless of how big the market is.
The 6 unit economic metrics investors track
| Metric | Definition | Target for residential installer |
|---|---|---|
| Average revenue per install (AOV) | Total project revenue | $25,000 to $35,000 |
| Gross profit per install | Revenue minus direct cost of materials and install labor | $7,500 to $12,000 |
| Customer acquisition cost (CAC) | Total sales and marketing spend divided by new customers | $1,500 to $2,500 |
| CAC payback period | CAC divided by gross profit per install | Less than 1 install |
| Lifetime value (LTV) | Gross profit from initial install plus referrals plus service revenue over 25 years | $10,000 to $18,000 |
| LTV-to-CAC ratio | LTV divided by CAC | 3:1 or higher |
Customer acquisition cost reality check
Per Wood Mackenzie’s 2026 residential solar outlook, CAC will rise from $0.60/W in 2025 to $0.84/W in 2026. For an 8 kW system, that translates to $6,720 in CAC. Most installers cannot absorb that and stay profitable.
Winning installers will pull CAC down through 3 levers:
- Internal lead generation: Local SEO, free solar calculator tools, content marketing
- Referral programs: $500 to $1,000 customer referral bonus pays back at 3:1
- Sales process efficiency: Virtual site assessments, AI lead scoring, single-visit close
Read the full breakdown in our solar customer acquisition cost guide.
Worked unit economics example
| Metric | Value |
|---|---|
| Revenue per install | $28,000 |
| Material COGS | $7,240 |
| Direct labor | $2,400 |
| Gross profit | $18,360 |
| Gross margin | 65.6% before SG&A allocation |
| CAC | $2,200 |
| Sales commission (3% of revenue) | $840 |
| Permit and admin allocation | $650 |
| Fully-loaded contribution margin | $14,670 |
| Contribution margin % | 52.4% |
Note: gross margin in this view is calculated before allocating sales, marketing, and overhead. The 33 percent gross margin in the P&L includes those allocations. Many founders confuse the two and get caught in diligence.
Pro Tip
Track unit economics monthly, not quarterly. CAC, gross margin per install, and average revenue per install are leading indicators. A 5 percent CAC creep at month 3 becomes a 20 percent profit hole by month 9 if you ignore it.
For deeper margin analysis, see our solar installer profit margins breakdown.
Solar Funding Rounds: Capital Structure and Dilution
Solar startups raise capital differently than pure software startups. The capex needs are higher, but so are the cash-flowing revenues. Investors price that mix into the structure.
Typical funding rounds for a US solar installer
| Round | Stage | Typical size | Dilution | Use of funds |
|---|---|---|---|---|
| Friends and family | Pre-launch | $50K to $200K | 5 to 10% | First truck, license, initial marketing |
| Seed equity | $0 to $2M revenue | $500K to $1.5M | 15 to 25% | 2 to 3 crews, hire ops manager, software stack |
| SBA 7(a) loan | $1M+ revenue, 2+ years | $500K to $5M | 0% (debt) | Working capital, equipment, building |
| SBA 504 Green Loan | $2M+ revenue | Up to $5.5M per project | 0% (debt) | Real estate, large equipment, solar on owned property |
| Series A equity | $5M+ revenue | $3M to $10M | 20 to 30% | Geographic expansion, regional hub |
| Asset-backed debt | $10M+ revenue | $5M to $50M facility | 0% (debt) | Project financing, lease portfolio |
| Strategic acquisition | $25M+ revenue | Buyer-led | 100% (exit) | Founder exit or rollup combination |
Most installers blend equity and debt. A typical capital stack at Year 3 might look like: $1.5M seed equity raised, $2M SBA 7(a) drawn, $3M asset-backed lease facility, $500K founder cash.
SBA loans deserve special attention
The SBA 504 Green Loan program is purpose-built for renewable energy projects. Per SBA guidelines, small businesses can access unlimited SBA 504 Green Loans up to $5.5M per project, as long as the project produces at least 15 percent renewable energy or reduces energy consumption by 10 percent. Solar installers buying their first warehouse with rooftop solar qualify. So do solar developers building project portfolios.
SBA 7(a) loans up to $5M work for general working capital, equipment, and acquisitions. Most lenders require a credit score of 680 or higher, 2 years of business history, and a written business plan with 3-year projections.
What Most Guides Miss
Equity is the most expensive capital you can raise. A $1M seed at 20 percent dilution implies your company is worth $5M post-money. If you grow that to $25M revenue and exit at 1x revenue, the investor’s 20 percent is worth $5M. They made 5x in 5 years. You gave up control of 20 percent of your life’s work. Debt is almost always cheaper if you can service it.
Marketing and Sales Strategy: How You Acquire Customers
The marketing section often gets less attention than financials. That is a mistake. Investors know that CAC drives the entire model. Show them you have a real plan.
The 4-channel marketing mix for solar installers
| Channel | CAC range | Volume capacity | Lead quality |
|---|---|---|---|
| Local SEO and organic | $400 to $900 | 5 to 50 leads/month | High |
| Paid search (Google Ads) | $1,200 to $2,400 | 20 to 200 leads/month | High |
| Door-to-door canvassing | $1,800 to $2,800 | 50 to 300 leads/month | Medium |
| Referrals | $200 to $500 | 2 to 30 leads/month | Very high |
A balanced installer aims for 60 percent of revenue from referrals and organic, 40 percent from paid channels. Investors penalize plans that rely entirely on paid acquisition because CAC is volatile.
Sales funnel benchmarks
- Lead-to-appointment rate: 25 to 40 percent
- Appointment-to-proposal rate: 70 to 85 percent
- Proposal-to-contract rate: 25 to 40 percent
- Contract-to-install rate: 80 to 92 percent
Blended lead-to-install conversion lands at 5 to 12 percent for residential installers. That number drives every CAC calculation. Reduce friction at any step and CAC improves immediately.
A modern solar sales process uses solar proposal software to generate engineering-accurate proposals in under 30 minutes. Faster proposals close more deals because customer urgency is highest in the first 48 hours after the appointment.
Management Team: The Section Investors Read First
After the executive summary, investors flip straight to the team page. They ask one question: can these people execute this plan?
What to include for each founder
- Full name and title
- 3-sentence bio with solar industry experience
- Notable accomplishments with numbers (revenue managed, installs completed, capital raised)
- LinkedIn URL
Sample founder bio
“Sarah Patel, CEO and Co-founder. Sarah spent 8 years at SunPower as a regional sales director, where she grew a 12-state territory from $4M to $47M in annual revenue. She holds a B.S. in Mechanical Engineering from Arizona State University and a NABCEP PV Installation Professional certification. Sarah personally closed 1,200+ residential solar contracts at SunPower before founding BrightPath.”
That bio answers the unspoken investor question: has she done this before? Yes. With specific numbers.
Advisory board and key hires
Name 2 to 4 advisors with relevant experience. A good solar advisory board includes:
- A former operator from a top-10 national installer
- A solar finance expert (project finance or asset-backed lending)
- A local commercial real estate broker (for sales pipeline)
- An attorney with renewable energy regulatory experience
Show planned hires with title and timing. Investors want to know that key roles are mapped, even if not yet filled.
Common Mistakes in Solar Business Plans
Most plans fail in diligence for the same reasons. Here are the 8 mistakes that kill solar deals.
1. Citing the federal residential ITC as available
The 30 percent residential investment tax credit expired December 31, 2025. Any business plan that still cites it as a customer incentive in 2026 loses credibility immediately. Some state credits remain. The federal commercial ITC remains. The residential 25D credit is gone for new installations.
2. Confusing gross margin and contribution margin
Gross margin in your P&L is revenue minus COGS. Contribution margin is revenue minus all variable costs including sales commissions and CAC. Investors ask for both. Mixing them up signals weak financial literacy.
3. Top-down market sizing
Writing “the solar market is $500 billion and if we capture 0.01 percent we are a $50M business” is the kiss of death. Build bottom-up from monthly install capacity. Show every input.
4. Hockey-stick revenue with no operations to support it
A plan that goes from $2M to $50M in 3 years needs to show how. How many crews? How many trucks? Where does the inventory come from? Where do you find 60 NABCEP-certified installers in a labor shortage? If the operations narrative does not match the revenue line, the plan dies.
5. Ignoring working capital
Solar installers have brutal cash cycles. Customers pay 10 percent at signing, 50 percent at material delivery, 40 percent at commissioning. Materials are paid upfront to suppliers. Labor is paid every 2 weeks. Net working capital can run 60 to 90 days of revenue. A $5M revenue installer might need $1M in working capital permanently tied up.
6. Underestimating customer acquisition cost
Plans that show CAC at $400 in a residential market are not credible. Wood Mackenzie’s data puts industry CAC at $0.84/W in 2026, or $6,720 for an 8 kW system before any sales commissions. Even efficient installers run $1,500 to $2,500. Plans below that range get torched in diligence.
7. No churn or warranty modeling
Solar systems have 25-year performance warranties. Roof leaks, inverter failures, and panel defects happen. Most plans model 0 percent warranty cost. Realistic warranty reserve is 1.5 to 3.5 percent of revenue for the first 10 years.
8. Missing competitive analysis
“We have no competitors” is the worst sentence in any business plan. You have competitors. SunPower, Tesla Solar, local installers, and DIY are all options for the customer. Show the 2x2 matrix. Explain where you win and where you lose.
For more on common operational pitfalls, see our scale solar installation business guide.
Operations: Permits, AHJs, and the Soft Cost Reality
The operations section is where most plans hand-wave through the hardest part of the business. Soft costs are 64 percent of installed cost per NREL’s 2024 residential cost benchmark. Manage soft costs or die.
The 5 soft cost categories
- Customer acquisition: 8 to 15 percent of revenue
- Permitting and interconnection: 4 to 8 percent of revenue
- Installation labor (loaded): 12 to 18 percent of revenue
- Sales and overhead: 10 to 15 percent of revenue
- Profit margin: balance
Permitting timeline by state
Permitting speed varies wildly. SolarAPP+ has reduced residential permit time to under 1 day in 130+ jurisdictions. In slow markets, permits can take 6 to 12 weeks.
| State | Average permit time | Average interconnection time |
|---|---|---|
| Arizona | 5 to 10 days | 15 to 30 days |
| California | 1 to 14 days (SolarAPP+) | 20 to 45 days |
| Florida | 7 to 21 days | 21 to 45 days |
| Texas | 5 to 14 days | 15 to 30 days |
| Massachusetts | 14 to 35 days | 30 to 75 days |
| New York | 14 to 28 days | 30 to 60 days |
Model permit time conservatively. A 30-day permit delay on a 65-install Year 1 plan shifts $1.8M of revenue into Year 2. The cash flow impact is severe.
Insurance and bonding requirements
Standard residential installer insurance package in 2026:
- General liability: $2M occurrence, $1,200 to $2,400 per year
- Workers compensation: state-mandated rates, 6 to 14 percent of payroll
- Commercial auto: $1M combined single limit, $4,800 to $9,600 per year
- Inland marine (tools and materials): 0.5 to 1 percent of insured value
- Surety bond (varies by state): $5,000 to $50,000 face value, premium 1 to 5 percent
Total insurance load runs 2.5 to 4 percent of revenue. Build it into your model.
How to Use the Business Plan After You Write It
Most founders write the plan, raise money, then never look at it again. That is a waste.
The 4 ongoing uses
- Quarterly board reviews: Compare actuals to plan for revenue, gross margin, CAC, and EBITDA. Variance triggers action.
- Bank line renewals: SBA lenders want updated projections every 12 to 18 months.
- New hire briefings: Every senior hire reads the plan in week 1. Aligns vision faster than 100 meetings.
- Next-round prep: When you raise Series A, the seed plan becomes the track record. Did you hit your numbers?
A living business plan beats a dead one. Update the financial model monthly. Update the narrative annually. Read our solar business growth strategies for tactics to actually hit the plan once you have it.
Templates and Tools to Speed Up Your Plan
You do not need to start from a blank page. Several free and paid resources help:
- SBA business plan templates: Free traditional and lean canvas templates from the Small Business Administration.
- SCORE business plan templates: Free templates plus volunteer mentor matching.
- SurgePV’s design and financial tools: Generate per-project revenue and COGS data for the operations and financial sections. Try the generation and financial tool or browse our solar software feature set.
Solar-specific financial models are also worth buying. A good template costs $200 to $800 and saves 20 to 40 hours of modeling work. Just make sure the model is fully editable and shows formulas, not just outputs.
What Comes After the Business Plan
The business plan is the start, not the finish. After you write it:
- Build the pitch deck (4 to 8 hours after the plan is done)
- Practice the pitch with 5 friendly listeners before the first real meeting
- Build a target investor list of 30 to 60 names
- Track every meeting in a CRM with status, feedback, and next steps
- Update the model monthly with actuals to keep it credible
Founders who execute these 5 steps close their seed rounds in 12 to 16 weeks. Founders who skip them often spend 9 to 18 months chasing the round.
Conclusion: 3 Action Items for This Week
- Build a 5-year financial model in Google Sheets with monthly Year 1 detail. Use the P&L template in this guide as a starting point.
- Write a 100-word executive summary that includes a stat, a problem, a solution, a market number, your traction, and the capital ask.
- Map 10 potential investors or SBA lenders. Find a warm intro to 3 of them this month.
The 2026 solar market is harder than 2025. CAC is up 40 percent. The residential ITC is gone. But 43 GW of solar will still be installed in 2026. Founders with disciplined plans and tight unit economics will win that market.
Learn more on the operations side in our how to start a solar company guide. The full picture covers product, capital, team, and execution.
Frequently Asked Questions
What should a solar business plan include?
A complete solar business plan includes an executive summary, market analysis, services and operations plan, marketing and sales strategy, management team bios, 5-year financial projections, capital ask, and an appendix with permits, licenses, and reference customers. Most investor-ready plans run 25 to 40 pages with a separate 12-slide pitch deck.
How much capital do I need to start a solar company?
A lean residential solar installer needs $150,000 to $250,000 to launch with a 2-person crew. A mid-size operation with two trucks, full inventory, software, and 6 months of working capital needs $400,000 to $750,000. Commercial-focused installers often need $1 million or more due to project bonding and longer payment cycles.
How do I project revenue for a solar startup?
Multiply your monthly install capacity by your average revenue per install. A 2-crew residential installer can complete 4 to 8 jobs per month at $25,000 to $35,000 average revenue per job. That gives $100,000 to $280,000 monthly revenue, or $1.2M to $3.4M in Year 1. Always show a conservative case, a base case, and a stretch case.
What financial KPIs do solar investors look for?
Investors check gross margin (target 25 to 40 percent), EBITDA margin (target 8 to 15 percent for installers, higher for software), customer acquisition cost (under $2,500 per residential customer), payback period under 12 months, LTV-to-CAC ratio above 3:1, and revenue growth of 80 percent or more year over year for the first 3 years.
Where can I get funding for a solar business?
Common funding sources include SBA 7(a) loans up to $5 million, SBA 504 Green Loans for equipment and real estate up to $5.5 million per project, angel investors for seed rounds of $250,000 to $1.5 million, equipment financing for trucks and tools, and project finance debt facilities for commercial pipelines. Many founders blend 2 or 3 of these sources.
How long does it take to write a solar business plan?
Plan for 40 to 80 hours of focused work spread over 3 to 5 weeks. The financial model takes the most time at 15 to 25 hours. Market research takes 10 to 15 hours. Writing and editing the narrative takes 15 to 25 hours. Pitch deck design adds another 8 to 15 hours.
What’s the difference between a solar business plan and a pitch deck?
The business plan is a 25 to 40-page document with full operational and financial detail used for SBA loans, banks, and serious investor diligence. The pitch deck is a 10 to 14-slide visual summary used for the first investor meeting and email outreach. Both pull from the same financial model, but the deck shows only the headline numbers.
Do I need a business plan to get an SBA loan for a solar company?
Yes. SBA 7(a) and SBA 504 lenders require a written business plan, 3 years of financial projections, personal financial statements, business and personal tax returns, and proof of industry experience. Many banks reject solar applications that lack a detailed permit and AHJ approval process narrative.
What gross margin should a solar installer target?
Target a 28 to 35 percent gross margin on residential installs and 18 to 25 percent on commercial. Residential gives higher percentage margins, but commercial jobs deliver larger absolute dollar margins per install. A balanced installer running 70 percent residential and 30 percent commercial typically holds a blended 28 to 32 percent gross margin.


