Quick Answer
In 2018 a 12 megawatt utility-scale plant in Queensland came online with monocrystalline PERC modules from a Tier 1 supplier. The energy yield in year one came in 4.2 percent below the P50 projection. Unchanged, confirmed by multiple test labs TOPCon LeTID. 0.5 to 1 percent observed in commercial cells under aggressive test conditions.
In 2018 a 12 megawatt utility-scale plant in Queensland came online with monocrystalline PERC modules from a Tier 1 supplier. The energy yield in year one came in 4.2 percent below the P50 projection. The owner blamed soiling and the inverter EPC blamed dispatch curtailment. The independent engineer who eventually opened the books found the real culprit. The modules had lost 1.8 percent to classical boron-oxygen LID in the first month and another 2.6 percent to LeTID over the next eight months. The combined 4.4 percent power loss was a near-perfect match for the missing energy. The project finance model had budgeted 0.5 percent total. The cash flow shortfall pushed the debt service coverage ratio under the threshold in the loan agreement, and the equity sponsor wrote down the project the following quarter.
In 2018 a 12 megawatt utility-scale plant in Queensland came online with monocrystalline PERC modules from a Tier 1 supplier. The energy yield in year one came in 4.2 percent below the P50 projection. Unchanged, confirmed by multiple test labs TOPCon LeTID. Read TOPCon vs HJT vs Perovskite Solar Panels for a complete walkthrough.
LID and LeTID are not academic curiosities. They are the two metastable degradation mechanisms that have shaped silicon module reliability for the last 25 years, written warranty curves at every major manufacturer, and driven the industry’s pivot from p-type PERC to n-type TOPCon and heterojunction cells. This guide unpacks both mechanisms, the test standards that gate procurement decisions, and what 2026 looks like for project finance teams reading data sheets.
TL;DR
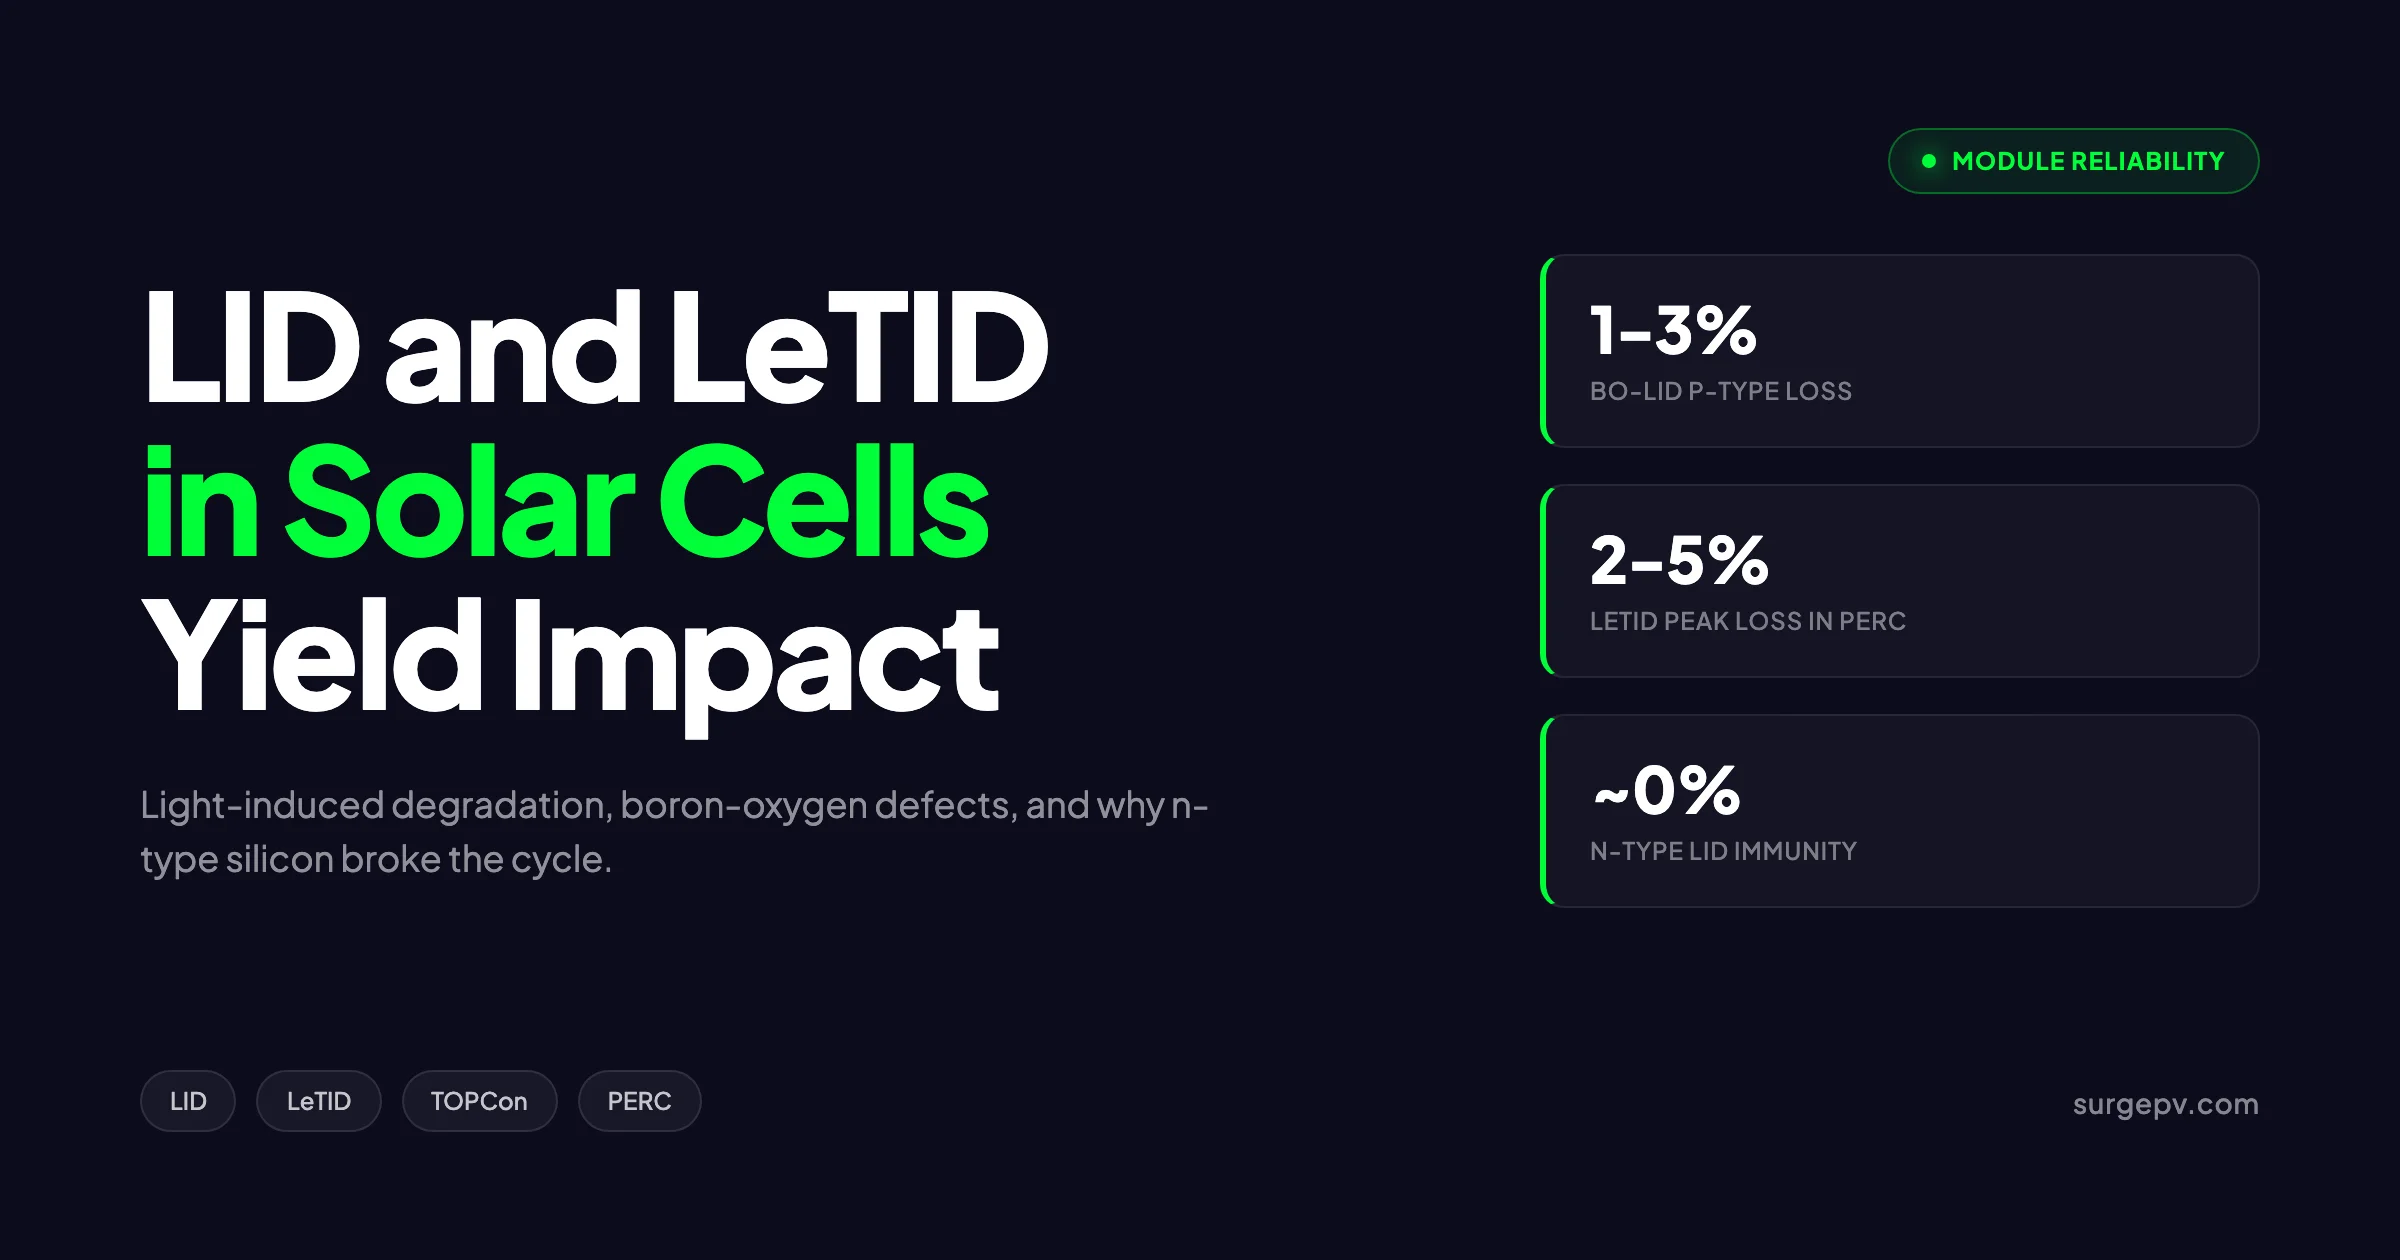
BO-LID is a fast 1 to 3 percent power loss in the first 100 hours of sun exposure, caused by boron-oxygen complexes in p-type silicon. LeTID is a slower 2 to 5 percent loss that develops over months at operating temperature, mainly in PERC. N-type TOPCon and HJT cells avoid classical BO-LID because their base contains no boron, and they show roughly an order of magnitude less LeTID. In 2026, n-type modules represent more than 70 percent of new shipments, which means the LID and LeTID conversation is shifting from “how bad is it” to “how do we model the residual 0.5 to 1 percent loss in n-type fleets.”
What this guide covers:
- The physics of the boron-oxygen defect and why it took 25 years to nail down the LeTID mechanism
- The two main flavors of degradation, side-by-side in numbers and timescales
- Why n-type cells are essentially immune to BO-LID and largely immune to LeTID
- IEC 63202, IEC TS 63342, and the PVEL scorecard methodology
- Mitigation strategies, regeneration kinetics, and bankability implications
- How to derate yield models for p-type and n-type fleets in 2026
Latest Updates: LID and LeTID in 2026
The headline change between 2023 and 2026 is that n-type cells now dominate global shipments, but emerging research has complicated the simple narrative that n-type is degradation-free. For Global-specific compliance details, see Global net-metering-by-country. For Global-specific compliance details, see Global solar-permitting-speed-by-country.
| Status Item | 2026 Position | What Changed Since 2023 |
|---|---|---|
| n-type market share | About 75 percent of new module shipments | Up from 27 percent in 2023 |
| TOPCon BO-LID | Below 0.3 percent in commercial cells | Unchanged, confirmed by multiple test labs |
| TOPCon LeTID | 0.5 to 1 percent observed in commercial cells under aggressive test conditions | New finding from 2024-2025 research |
| HJT BO-LID and LeTID | Essentially zero, below detection limit | Unchanged |
| PERC LeTID | 2 to 5 percent typical first-year loss | Better understood, BH2 defect model dominant |
| IEC TS 63342 | Stable second-edition LeTID test protocol | First edition published 2022, revised through 2024 |
| IEC 63202-1 | Cell-level LID test, published 2019 | LeTID cell-level test still in draft |
| Warranty implications | First-year warranty haircut typically 2 to 3 percent for PERC, 1 percent for n-type | Tightening as field data accumulates |
| Project finance | LID and LeTID now line items in independent engineer reports | Was hidden in general degradation rate before |
The other shift is in physical understanding. The BH2 defect model, which proposes that a boron-dihydrogen complex is the primary LeTID active center in boron-doped silicon, has gained broad acceptance through density functional theory work and Hall effect measurements published between 2023 and 2025. This explains why gallium-doped silicon shows weaker LeTID, why hydrogen-rich silicon nitride passivation amplifies LeTID, and why firing recipe matters.
What LID Actually Is
Light-induced degradation is the umbrella term for any metastable power loss in a silicon solar cell that is triggered by light exposure. In 2026 the term is usually narrowed to two specific mechanisms.
The classical mechanism is boron-oxygen LID, often written as BO-LID or just LID without qualifier. It affects boron-doped Czochralski silicon, which is the standard p-type wafer used in PERC modules. The loss is 1 to 3 percent of nameplate power, develops within the first 100 hours of sun exposure, and then saturates. After saturation, the cell sits in a stable degraded state that the warranty curve takes as its starting point.
The plain analogy is breaking in a new pair of running shoes. The first 50 kilometers wear them down to a slightly softer baseline, and after that the wear rate is much slower. A solar module loses its first chunk of performance in the first hundred hours of sun, then settles into the linear degradation curve that the warranty quotes.
Modern module warranties guarantee 97 to 97.5 percent of nameplate at the end of year one and a linear curve thereafter. The 2.5 to 3 percent gap between nameplate and year-one power is the warranty’s pre-emptive haircut for LID. If a specific module has lower LID than the warranty assumes, you collect a small windfall. If LID plus LeTID together exceed 3 percent, you have a warranty claim, but only if you can document the loss in field data, which most asset owners cannot.
Pro Tip
Flash test reports on the module data sheet are taken on the production line before any sun exposure. They report the annealed, pre-LID power. The first time a module is energized at the project site, it begins its LID degradation curve immediately. If the EPC measures string IV curves at commissioning and then again 30 days later, the delta is almost entirely BO-LID.
The Boron-Oxygen Defect Mechanism
A Czochralski silicon ingot is grown by dipping a seed crystal into a quartz crucible holding molten silicon at 1414 degrees Celsius. The crucible is fused silicon dioxide. At those temperatures, oxygen dissolves into the melt and is incorporated into the growing crystal at concentrations between 5 and 20 parts per million atomic. Boron is added as a dopant, typically at 1 to 5 parts per million atomic, to make the wafer p-type.
Once the crystal is sliced into wafers and processed into solar cells, the boron sits on regular lattice sites where silicon atoms would otherwise be. The oxygen sits in interstitial positions between lattice sites. Both impurities are individually fine. The problem starts when they cluster.
Two interstitial oxygen atoms can form a mobile oxygen dimer. The dimer drifts through the lattice until it encounters a substitutional boron atom. The dimer is captured, forming a metastable boron-oxygen complex. In the dark, this complex sits in a state where it captures and releases electrons in roughly equal proportions and does not strongly affect cell performance.
Light exposure changes everything. Photogenerated electrons interact with the boron-oxygen complex and flip its charge state. The new charge state is a deep recombination center. Carriers that should reach the cell’s electrodes are instead captured at the defect, where they recombine with holes and release their energy as heat. The result is a drop in minority carrier lifetime, a drop in short-circuit current, and a drop in open-circuit voltage. Module power falls.
The kinetics matter. The activation energy for forming the boron-oxygen complex is roughly 0.42 eV. At room temperature under one sun illumination, the formation timescale is hours to days. At 50 to 80 degrees Celsius, formation is faster and saturation is reached within 24 hours. The defect can also be regenerated by combined illumination and elevated temperature, which slowly converts the complex into a third metastable state that is benign.
| Defect State | Carrier Lifetime Impact | Trigger | Reversible |
|---|---|---|---|
| Annealed (initial) | None | Heat above 200°C in dark | Yes, by light |
| Degraded | Strong reduction, 1 to 3 percent power loss | Light at moderate temperatures | Yes, by regeneration |
| Regenerated | Near-initial lifetime | Light plus heat at 60 to 80°C for hours | Yes, by annealing |
The three-state cycle is well established but mostly academic for fielded modules. In the field, the regeneration kinetics are too slow to outrun the daily formation rate, so the cell sits permanently near the degraded state with minor diurnal swings. This is why every accelerated test protocol in IEC 63202 starts with a deliberate dark anneal step, to force the cell into a known initial state before measurement.
The dependency on boron and oxygen together is the key engineering lever. Reduce either species and BO-LID drops sharply. Gallium-doped p-type silicon eliminates boron from the bulk and shows under 0.5 percent BO-LID. Magnetic Czochralski silicon reduces oxygen incorporation in the melt and also shows reduced LID. N-type silicon eliminates substitutional boron entirely, since the dopant is phosphorus, and is effectively LID-free.
How LeTID Was Discovered
For decades, LID and BO-LID were synonymous. The story changed in 2012 when Ramspeck and colleagues at SolarWorld noticed an additional, slower degradation in multicrystalline PERC modules being tested under thermal stress. The losses appeared over hundreds of hours, were temperature-accelerated, and were too large to attribute to BO-LID alone. They named the new phenomenon Light- and elevated-Temperature-Induced Degradation, abbreviated to LeTID.
The early years of LeTID research were chaotic. Different groups reported different magnitudes of loss depending on cell architecture, firing temperature, hydrogen content of the silicon nitride passivation, and even the metallization paste used. By 2016 the consensus was that LeTID was a real and reproducible mechanism, that it primarily affected PERC architecture in both multicrystalline and monocrystalline silicon, and that it could exceed 6 percent in worst-case modules.
The mechanism debate ran from 2016 to roughly 2023. Several models competed, including a copper-related defect, a hydrogen-vacancy complex, and a boron-hydrogen complex. By 2025 the field had largely converged on a boron-dihydrogen complex, called BH2, as the dominant LeTID active center in boron-doped silicon. Density functional theory work published across 2024 and 2025 supports this assignment. Gallium-doped silicon shows much weaker BH2 activity because the gallium-hydrogen analog has shallow energy levels rather than mid-gap recombination centers, which is why gallium-doped wafers also suppress LeTID.
The reason LeTID showed up specifically in PERC is architectural. The PERC rear is passivated by an aluminum oxide layer capped with silicon nitride. The silicon nitride is hydrogen-rich by design, because hydrogen passivates surface and bulk defects during the firing step that completes the cell. The firing step is fast, lasting only a few seconds at peak temperatures above 700 degrees Celsius, and it drives hydrogen from the silicon nitride into the silicon bulk. Some of this hydrogen passivates defects and improves cell efficiency. Some of it remains as free hydrogen atoms or hydrogen-vacancy complexes that sit dormant at room temperature.
The trouble starts at operating temperature in the field. Under combined light and elevated temperature, the hydrogen mobilizes. Some of it pairs with boron or with other defects to form new recombination centers, of which BH2 is the leading candidate. The total trapped hydrogen in a PERC cell can exceed 10 to the 17 atoms per cubic centimeter, far more than enough to create the observed defect density.
LID vs LeTID, Side by Side
| Property | BO-LID | LeTID |
|---|---|---|
| Triggering species | Boron plus oxygen | Hydrogen plus boron (BH2 model dominant) |
| Affected cell types | All p-type boron-doped silicon | Mostly PERC, also some n-type TOPCon at low levels |
| Power loss range | 1 to 3 percent of nameplate | 2 to 5 percent typical, up to 7 percent worst case |
| Onset timescale | First 100 hours of sun | Weeks to months in the field |
| Saturation timescale | Roughly 100 hours | 1000 to 3000 hours, sometimes longer |
| Temperature dependence | Mild, faster above 50°C | Strong, requires temperatures above 50°C |
| Recovery in field | None practical, slow regeneration possible | Slow recovery over years, partial |
| Lab test standard | IEC 63202-1 (cell), IEC 61215 (module) | IEC TS 63342 (module), draft TS 63202-4 (cell) |
| Mitigation route | Gallium doping, n-type silicon, magnetic Cz | Pre-deployment hydrogenation, low-hydrogen firing |
| 2026 status | Designed out of mainstream products | Largely solved in n-type, mitigated in latest PERC |
The two mechanisms can occur in the same module. A 2020-era PERC module from a Tier 1 supplier will typically show 2 percent BO-LID stabilizing in the first week, followed by 2 to 3 percent LeTID developing over the first year. The combined loss can erode the 3 percent warranty haircut and push the module under the year-one warranty curve, which is why the issue became material for project finance.
Why N-Type Cells Are LID-Free
The shift from p-type PERC to n-type TOPCon and HJT between 2022 and 2026 is the single largest technology transition in modern PV manufacturing. Multiple factors drove it, including higher cell efficiency, better temperature coefficients, lower light-induced degradation, and better behavior under bifacial deployment. The LID immunity is the cleanest story. See Bifacial Solar Panel Design Guide for detailed guidance.
In an n-type wafer, the majority carriers are electrons, and the bulk is doped with phosphorus at lattice sites. There is no substitutional boron in the base, so no boron-oxygen complex can form. Oxygen is still present at the usual Czochralski levels, but oxygen alone is benign. The minority carriers in n-type silicon are holes, which have inherently longer lifetimes than minority electrons in p-type silicon. This gives n-type cells a baseline efficiency advantage on top of the LID immunity.
| Cell Architecture | Base Doping | BO-LID Susceptibility | LeTID Susceptibility | Typical First-Year Loss |
|---|---|---|---|---|
| Al-BSF (legacy) | Boron (p-type) | Yes, 1-3% | No, was not observed | 1.5-3% |
| PERC monocrystalline | Boron (p-type) | Yes, 1-3% | Yes, 2-5% | 3-5% |
| PERC gallium-doped | Gallium (p-type) | Negligible | Reduced, under 1% | 1-2% |
| TOPCon | Phosphorus (n-type) | None | Low, 0.5-1% under aggressive test | 0.5-1.5% |
| HJT | Phosphorus (n-type) | None | None detected | 0-0.5% |
| IBC | Phosphorus (n-type) | None | None detected | 0-0.5% |
TOPCon, HJT, and IBC are all built on n-type substrates. The difference between them lies in the front and rear surface passivation and contacting scheme. All three avoid BO-LID by construction.
LeTID is a different story. Because LeTID involves hydrogen rather than boron-oxygen complexes, it can in principle affect any cell that incorporates hydrogen during passivation. TOPCon cells use a similar silicon nitride passivation step to PERC, and they include a hydrogen-rich poly-Si layer on the rear. Recent research from 2024 and 2025 has shown that commercial TOPCon cells can develop 0.5 to 1 percent LeTID-like losses under aggressive test conditions, particularly when the rapid thermal anneal temperature is poorly optimized. HJT cells use hydrogenated amorphous silicon passivation and seem to avoid the effect, perhaps because the hydrogen is bound in the passivation layer rather than driven into the bulk.
Key Takeaway
N-type technologies are essentially BO-LID free. For LeTID, n-type TOPCon and HJT show roughly an order of magnitude lower losses than PERC. The remaining LeTID in TOPCon is a known issue and tier one manufacturers have specific firing and light-injection treatments to suppress it. For project finance purposes in 2026, treat n-type modules as having under 1.5 percent first-year stabilization loss versus 3 to 5 percent for legacy PERC.
Why LeTID Got Buried When PERC Was Already Selling
There is a contrarian read on the LeTID story that the industry rarely discusses in public. By the time LeTID was confirmed in 2014 and characterized in detail by 2016, PERC was already the dominant cell architecture. Tier 1 manufacturers had spent billions of dollars retooling production lines for the aluminum oxide rear passivation. Suppressing LeTID would have required either switching to gallium doping, which created intellectual property and supply chain headaches, or redesigning the firing step, which risked degrading cell efficiency.
The path of least resistance was to ship PERC modules with the LeTID issue partially mitigated through firing optimization, write a 2 to 3 percent first-year warranty haircut into the data sheet, and let asset owners absorb the residual loss. The IEC TS 63342 LeTID test protocol was not published until 2022, ten years after the phenomenon was first identified. PVEL began reporting LeTID losses in its scorecard in 2018, but the methodology was not consistent across the industry until 2021.
The result was a six-year window from roughly 2014 to 2020 in which PERC modules were sold globally with an undisclosed degradation mechanism that was material to project economics. Some manufacturers genuinely did not know about LeTID until field data forced the issue. Others knew and underdisclosed. The lawsuits that resulted, including a major class action settled by a top-five Chinese manufacturer in 2023, are public record.
The lesson for 2026 is uncomfortable. The TOPCon LeTID story is roughly where the PERC LeTID story was in 2017. The defect mechanism is being characterized, accelerated test protocols are being refined, and the first major manufacturers are publicly claiming that they have solved it. A repeat of the PERC pattern is plausible, particularly because the TOPCon LeTID losses are small enough to hide within the noise of normal yield model uncertainty for 3 to 5 years. Project finance teams underwriting 30-year n-type PPA contracts in 2026 should ask for explicit LeTID test data from PVEL or an equivalent independent lab, not just data sheet claims.
IEC 63202, IEC TS 63342, and PVEL Test Protocols
There are three test protocols a project finance team should know about, plus one industry scorecard.
IEC 63202-1 is the cell-level LID test. Published in 2019, it specifies a dark anneal at above 200 degrees Celsius to set the initial state, followed by light soaking under simulated sunlight at 1000 watts per square meter and 60 degrees Celsius for a minimum of 24 hours. Maximum power is measured before and after, and the LID magnitude is reported as a percentage. The test is intended to help module manufacturers match cells within a module to minimize mismatch losses, and it is increasingly cited in spec sheet appendices for cell suppliers.
IEC 61215 is the broader module qualification standard, with a specific LID test in Module Quality Test 19. The MQT19 test exposes a complete module to natural or simulated sunlight totaling 60 kWh per square meter, with maximum power measured at the start and at the end. The pass criterion is that final power must be within minus 5 percent of the data sheet rating. This is the test that gates module type approval, and it catches gross BO-LID but is not sensitive to LeTID.
IEC TS 63342 is the module-level LeTID test, published as a Technical Specification in 2022 and refined through 2024. The protocol uses current injection at 75 degrees Celsius for 486 hours, with intermediate flash tests at 162 hour intervals. Current injection simulates the carrier concentration inside an operating cell at maximum power point without requiring a full solar simulator. The current is set to twice the difference between short-circuit current and maximum power point current, which matches the field carrier concentration. BO-LID preconditioning is required before the LeTID test phase to avoid masking by BO recovery.
PVEL PV Module Reliability Scorecard is the industry’s leading independent reliability benchmark. PVEL combines a 162-hour BO-LID light soak with a 486-hour LeTID current injection at 75 degrees Celsius, then publishes anonymized but bin-categorized results. Top performers in 2024 reported under 1 percent combined LID plus LeTID. Worst performers exceeded 3 percent. The scorecard is the single best source of pre-procurement degradation data and is referenced in most independent engineer reports for project finance.
| Standard | Level | Test Conditions | Duration | Primary Use |
|---|---|---|---|---|
| IEC 61215 MQT19 | Module | Natural or simulated sunlight, 60 kWh/m² | Varies | Type approval, BO-LID screen |
| IEC 63202-1 | Cell | 1000 W/m² simulated, 60°C | Min 24 h | Cell binning, BO-LID measurement |
| IEC TS 63342 | Module | Current injection 2×(ISC-IMPP), 75°C | 486 h | LeTID benchmark |
| PVEL Scorecard | Module | Combined BO-LID and LeTID protocols | Roughly 650 h | Independent procurement benchmark |
The remaining gap is a cell-level LeTID test standard. The draft IEC TS 63202-4 is expected to publish in 2026 or 2027 and will give cell suppliers a way to bin out LeTID-prone cells before module assembly. This matters because field LeTID is dominated by the worst-performing cells in a module rather than the average, since string current is set by the lowest cell.
Model LID and LeTID in Your Yield Forecast
SurgePV’s generation and financial tool lets you input separate first-year stabilization loss and long-term degradation rate by module technology. Project finance teams use it to compare PERC and TOPCon procurement options side-by-side.
Book a DemoNo commitment required · 20 minutes · Live project walkthrough
Mitigation Methods
Manufacturers have four broad levers to suppress LID and LeTID. They are used in combination.
Doping changes. Switching from boron to gallium in p-type silicon eliminates most BO-LID and reduces LeTID. Most Tier 1 PERC manufacturers transitioned to gallium-doped wafers between 2020 and 2022. The downside is supply chain complexity, since gallium dopant sources were dominated by a small number of suppliers, and a few manufacturers had to revert temporarily during the 2022 supply squeeze.
Wafer growth process. Magnetic Czochralski growth applies a magnetic field to the molten silicon, which suppresses convection and reduces oxygen incorporation. Reduced oxygen means fewer boron-oxygen complexes. The technique adds cost but is used by some premium cell suppliers.
Pre-deployment regeneration. A cell or module can be deliberately regenerated by exposing it to combined light and heat for 30 minutes to 2 hours at 75 to 95 degrees Celsius. This converts most of the boron-oxygen complexes from the degraded state to the benign regenerated state. The technique is used by some manufacturers as a final processing step before module shipment. It works for BO-LID but only partially for LeTID.
Firing recipe optimization. Reducing the hydrogen incorporation during the firing step reduces the available hydrogen for LeTID defect formation. The trade-off is that hydrogen also passivates surface and bulk defects during firing, so cutting hydrogen too aggressively reduces cell efficiency. Manufacturers have spent the last decade fine-tuning firing recipes to balance these effects.
Architectural choices. Moving from PERC to TOPCon, HJT, or IBC eliminates or reduces both BO-LID and LeTID by construction. This is the dominant industry response in 2026 and explains why n-type now leads the global module mix.
| Mitigation | What It Targets | Typical Effectiveness | Cost Impact |
|---|---|---|---|
| Gallium doping | BO-LID, partial LeTID | 70-90% reduction | Small premium |
| Magnetic Cz | BO-LID | 30-50% reduction | Moderate premium |
| Pre-deployment regen | BO-LID | 80-95% reduction | Small cost |
| Low-hydrogen firing | LeTID | 50-70% reduction | None to small |
| N-type switch | Both | Essentially complete for BO-LID, 70-90% for LeTID | Premium narrowing, near parity in 2026 |
In practice, a 2026 Tier 1 TOPCon module benefits from the last lever almost entirely, and the others are not needed. A 2026 Tier 1 PERC module, which is still produced for some markets, typically uses gallium doping plus optimized firing.
Detection and Field Measurement
Confirming LID and LeTID in the lab is straightforward. Confirming them in the field is hard.
In the lab, the workflow is to flash test before and after the test protocol, compute the change in maximum power, and report it as a percentage. Electroluminescence imaging adds spatial information, showing which areas of which cells are degrading most. The combination of IV curve analysis and EL imaging is sufficient to distinguish BO-LID, LeTID, potential induced degradation, and physical defects such as cracks.
In the field, the difficulty is establishing the right baseline. Module data sheets report annealed power, but modules in the field have already passed through BO-LID. Commissioning IV curves are taken minutes to days after first sun exposure, so they catch a partial BO-LID state. Year-one performance ratios compare measured energy yield to the irradiance and temperature record, but this conflates LID, LeTID, soiling, inverter losses, dispatch curtailment, and weather variance.
The cleanest field methodology is to measure module-level IV curves with a portable tracer at commissioning, then again at 30 days, 90 days, and one year. The 0 to 30 day delta is mostly BO-LID. The 30 to 365 day delta is LeTID plus normal degradation. This requires deliberate measurement, dedicated test equipment, and a willing O&M provider. Most asset owners do not collect this data, which is why LID and LeTID often become visible only as a P50 yield miss.
EL imaging in the field is increasingly common, particularly with drone-mounted cameras that can image full strings without breaking the seal. EL is not directly quantitative for LID and LeTID, but a degraded cell shows reduced brightness relative to its neighbors, which can flag modules for further investigation.
For project finance, the practical recommendation is to budget for a year-one IV curve campaign on a sample of modules, written into the EPC scope. The data flows into the warranty file and is the only credible basis for a degradation-related warranty claim.
Bankability and Project Finance Implications
LID and LeTID became material to project finance around 2016, when the first generation of PERC plants began missing P50 yield projections by 2 to 4 percent. The standard practice today is for the independent engineer to explicitly model first-year stabilization loss separately from the long-term linear degradation rate.
A typical 2026 yield model for a 100 megawatt utility-scale plant looks like this. Module nameplate is taken from the data sheet. First-year stabilization loss is applied as a step-down at the start of year one. Long-term degradation is applied as a linear curve from year one onward. The total energy yield over 25 or 30 years drives the revenue forecast that supports the debt service.
For a PERC project commissioning in 2026, the typical assumptions are 2 percent BO-LID, 2 to 3 percent LeTID, and 0.5 to 0.6 percent annual linear degradation. Combined first-year loss is therefore 4 to 5 percent. For a TOPCon project, the typical assumptions are under 0.5 percent BO-LID, 0.5 to 1 percent LeTID, and 0.4 to 0.5 percent annual linear degradation. Combined first-year loss is under 1.5 percent. The difference compounds over 30 years and is the central reason n-type PPAs trade at lower bid prices than equivalent PERC plants.
| Parameter | PERC (2026 commissioning) | TOPCon (2026 commissioning) | HJT (2026 commissioning) |
|---|---|---|---|
| BO-LID assumption | 2.0% | 0.3% | 0% |
| LeTID assumption | 2.5% | 0.8% | 0.2% |
| Combined first-year loss | 4.5% | 1.1% | 0.2% |
| Long-term degradation rate | 0.55%/year | 0.45%/year | 0.40%/year |
| 25-year energy yield versus nameplate | 78% | 86% | 89% |
| 30-year energy yield versus nameplate | 75% | 84% | 87% |
Warranty terms reflect these assumptions. Top Tier 1 manufacturers offer 30-year linear performance warranties on n-type modules with an end-of-warranty floor of 87 to 88 percent of nameplate, versus 84 to 85 percent for legacy PERC. The 3 to 4 percent gap in warranty floor reflects the LID and LeTID differential, plus modest improvements in long-term degradation rate.
For solar design and proposal workflows, this means solar design software needs to allow the user to set first-year stabilization loss independently from long-term degradation, and to swap module assumptions easily when comparing PERC and TOPCon procurement options. The same logic applies to solar proposal software used for residential and commercial sales, where the difference in 25-year energy yield between PERC and TOPCon translates directly into the homeowner or business savings number.
Long-Term Field Data, 2018 to 2026
The cleanest long-term field data on LID and LeTID comes from a handful of monitored test sites operated by NREL, Fraunhofer ISE, ISFH, and a few utility R&D groups. The pattern is consistent.
PERC modules deployed in 2018 and 2019, before LeTID mitigation was widespread, show 3 to 5 percent loss in year one followed by 0.5 to 0.7 percent annual loss thereafter. After eight years, total power loss is roughly 7 to 10 percent, which is slightly worse than the warranty curve allows in some cases.
PERC modules deployed in 2021 and later, with LeTID mitigation, show 2.5 to 3.5 percent year-one loss followed by 0.5 to 0.6 percent annual loss. Total loss at three to four years is on track with warranty curves.
TOPCon modules deployed in 2022 and later show under 1.5 percent year-one loss and 0.4 to 0.5 percent annual loss thereafter. The field data set is still short, but the trajectory is well below the warranty curve. HJT modules, where data exists, show even lower numbers.
The takeaway is that the industry is on a clear improvement trajectory. Modules commissioned in 2026 are substantially more reliable than modules commissioned five years earlier, and the residual LID and LeTID losses are small enough to fit comfortably inside the warranty haircut.
Further Reading
See SurgePV’s guide to solar irradiance for the input side of the yield equation, and the SurgePV solar shadow analysis software for site-level losses that can amplify or mask LID and LeTID in real plants.
For a direct comparison, see Arka 360 vs SurgePV.
Module Procurement Checklist for 2026
When evaluating modules for a utility-scale or commercial project, ask for the following data in the supplier RFI:
- BO-LID magnitude per IEC 63202-1 or IEC 61215 MQT19, with test report attached
- LeTID magnitude per IEC TS 63342 or equivalent, with test report attached
- PVEL Module Reliability Scorecard bin for the most recent year, including LID and LeTID rankings
- Wafer dopant type and growth method (boron Cz, gallium Cz, magnetic Cz, phosphorus Cz, etc.)
- Firing recipe and pre-deployment regeneration treatment, if any
- Long-term linear degradation rate quoted in the warranty
- Field data from at least one comparable production lot, ideally 18 to 24 months in operation
- Independent third-party test report from PVEL, RETC, TÜV Rheinland, or equivalent
- Bill of materials freeze date and supply chain traceability
A 2026 Tier 1 supplier can provide all of these without effort. A Tier 2 or Tier 3 supplier may struggle, and the gaps are useful flags for due diligence.
For residential and commercial sales workflows, the procurement burden is lighter but the principle is the same. Sales teams using solar software to generate proposals should confirm that the module library is current, that LID and LeTID assumptions are baked into the degradation model, and that the year-one stabilization loss is shown explicitly to the customer rather than hidden in a single composite degradation number.
ROI Impact: Worked Example
Take a 1 megawatt commercial rooftop project in Northern Italy. The system is grid-connected, generates 1.2 GWh per year at nameplate, and sells energy to the building owner at 0.14 euros per kWh under a 15-year power purchase agreement. Also see: solar panel ROI in Italy. See our guide on Commercial Rooftop Solar Case Study Italy for more.
Scenario A uses PERC modules with 4.5 percent combined first-year LID plus LeTID and 0.55 percent annual degradation. Scenario B uses TOPCon modules with 1.1 percent combined first-year loss and 0.45 percent annual degradation. The TOPCon modules carry a 3 percent capex premium.
| Metric | PERC (Scenario A) | TOPCon (Scenario B) |
|---|---|---|
| Capex per W | 0.85 EUR | 0.875 EUR |
| First-year energy | 1146 MWh | 1187 MWh |
| Year 15 energy | 1059 MWh | 1124 MWh |
| Total 15-year energy | 16,920 MWh | 17,720 MWh |
| Total 15-year revenue | 2.37 million EUR | 2.48 million EUR |
| 15-year revenue uplift | Baseline | +110,000 EUR |
| Capex premium | Baseline | +25,000 EUR |
| Net 15-year benefit of TOPCon | Baseline | +85,000 EUR |
The TOPCon premium pays for itself roughly 4.4 times over the PPA life. For a typical commercial project, the IRR improves by 0.4 to 0.7 percentage points by choosing TOPCon over PERC, which is decisive when bidding for tendered capacity.
For deeper financial modeling on actual sites, the generation and financial tool lets users plug in module-specific degradation curves and run scenario comparisons across capex, tariffs, and financing terms. For France-specific information, see Agricultural Solar Case Study.
For broader European policy context that shapes these models, the SurgePV guide to European solar incentives covers the country-by-country subsidy and tariff landscape, and the solar panel ROI Italy deep-dive walks through the Italian-specific payback math. Also see: European Solar Tax Credits.
Conclusion
Three takeaways for project teams and procurement leads in 2026.
- For new projects, default to n-type TOPCon or HJT modules. The 3 to 4 percent first-year yield advantage over PERC pays for the capex premium in under five years on most utility and commercial projects.
- For yield models, separate first-year stabilization loss from long-term degradation. Use 4 to 5 percent for PERC, under 1.5 percent for n-type. Do not bury LID and LeTID inside a single annual degradation rate.
- For procurement RFIs, ask for IEC TS 63342 and PVEL scorecard data explicitly. Tier 1 suppliers will provide it without friction. The absence of this data on a Tier 2 or Tier 3 quote is a red flag.
The LID and LeTID story is roughly half done. BO-LID is essentially solved through the industry’s pivot to n-type silicon. LeTID is largely solved in current TOPCon and HJT products, with small residual losses that should be monitored as 30-year field data accumulates. The 2026 conversation is no longer “should we worry about LID” but “how do we underwrite the last 0.5 to 1 percent of n-type LeTID risk.”
External references used in this guide:
- NREL Technical Report on LID and LeTID Impacts to PV Module Performance and System Economics
- PVEL PV Module Reliability Scorecard LID and LeTID Tests
- IEC 63202-1 Photovoltaic cells Part 1 Measurement of light-induced degradation
- Light and Elevated Temperature Induced Degradation of N-type TOPCon Solar Cells, Solar Energy Materials and Solar Cells 2025
- Progress in the Understanding of LeTID in Silicon Solar Cells, Progress in Photovoltaics 2021
- REC Group Combatting LeTID in Solar Panels Technical White Paper
- PV-Tech Critical TOPCon Module Degradation Article
Frequently Asked Questions
What is the difference between LID and LeTID in solar cells?
LID, or light-induced degradation, is a fast power loss in the first 100 hours of sun exposure caused by boron-oxygen defects in p-type silicon, typically 1 to 3 percent of nameplate power. LeTID, or light and elevated temperature induced degradation, is a slower mechanism that develops over hundreds to thousands of hours at operating temperatures above 50 degrees Celsius, mainly in PERC modules, and can reach 2 to 5 percent power loss before partial recovery. Also see: Us Residential Solar Market Trends 2026.
Are n-type TOPCon and HJT modules really LID-free?
N-type modules avoid classical boron-oxygen LID because the wafer is doped with phosphorus and contains no substitutional boron. Most TOPCon and HJT products on the market show under 0.5 percent BO-LID. They are not perfectly free of every degradation mode, and recent 2025 research from groups working with commercial TOPCon cells has found small LeTID-like losses tied to hydrogen dynamics in the passivation stack, typically below 1 percent.
How is LeTID tested in the lab?
The dominant module-level protocol is IEC TS 63342, which uses current injection at 75 degrees Celsius for 486 hours, with flash testing and electroluminescence imaging every 162 hours. PVEL applies a similar protocol in its annual scorecard. Cell-level testing uses IEC 63202-1 conditions of 60 degrees Celsius and 1000 watts per square meter, with a cell-specific LeTID standard still in draft.
Does LID get worse over the lifetime of a module?
Classical BO-LID saturates within roughly 100 hours of sun exposure, so it does not get worse after the first few weeks in the field. LeTID is different. Its kinetics span thousands of hours and the degradation curve can keep falling for years before plateauing and slowly recovering, which is why long-term field data on PERC fleets has been worse than 2018-era data sheets predicted.
Should I derate yield models for LID and LeTID in 2026?
For p-type PERC modules still being commissioned, use 2 percent BO-LID plus 2 to 3 percent LeTID in the first year, then add the linear long-term degradation rate from the warranty. For n-type TOPCon and HJT modules, use under 0.5 percent first-year loss and trust the warranty curve, with a small reserve of 0.5 percent for emerging LeTID-like effects if the project is highly leveraged.
Can LeTID be reversed in the field?
LeTID is metastable and does partially recover under continued field operation, but the recovery timescale is decades, not months. In practice, by the time a fielded module has recovered most of its LeTID loss, the warranty period has ended. Laboratory regeneration using combined light and heat at 75 to 95 degrees Celsius can accelerate recovery, but this is a pre-deployment process and is not feasible on installed plants.
Which test certification proves a module is LeTID resistant?
The strongest credential is an independent PVEL Module Reliability Scorecard top performer ranking in the LID and LeTID category, combined with a passing test report under IEC TS 63342. Manufacturer self-reported numbers are useful for screening but should not be the basis for final procurement. RETC and TÜV Rheinland publish equivalent reliability data that is also accepted by most independent engineers.
How does LeTID interact with high-temperature climates?
LeTID is temperature-driven, so it develops faster in hot climates. A PERC fleet in Dubai or Phoenix will reach LeTID saturation within months, while the same fleet in Northern Germany may take two to three years. The final magnitude is similar but the kinetics differ. For warranty claim purposes, hot-climate projects can document LeTID losses earlier, while cool-climate projects may need longer monitoring windows. Also see: Germany solar subsidies. See our guide on Community Solar Projects Germany for more.


